 DOCS/VIEWALYZER/THE WORKSPACE
VIEWALYZER · GPUI EDITION
DOCS/VIEWALYZER/THE WORKSPACE
VIEWALYZER · GPUI EDITION
The workspace
- Layout
- The sidebar
- The top bar and the capsule
- The dock: tabs, splits and tiles
- The log
- The shared time model
- Themes, scale and shortcuts
- Where things are stored
Layout
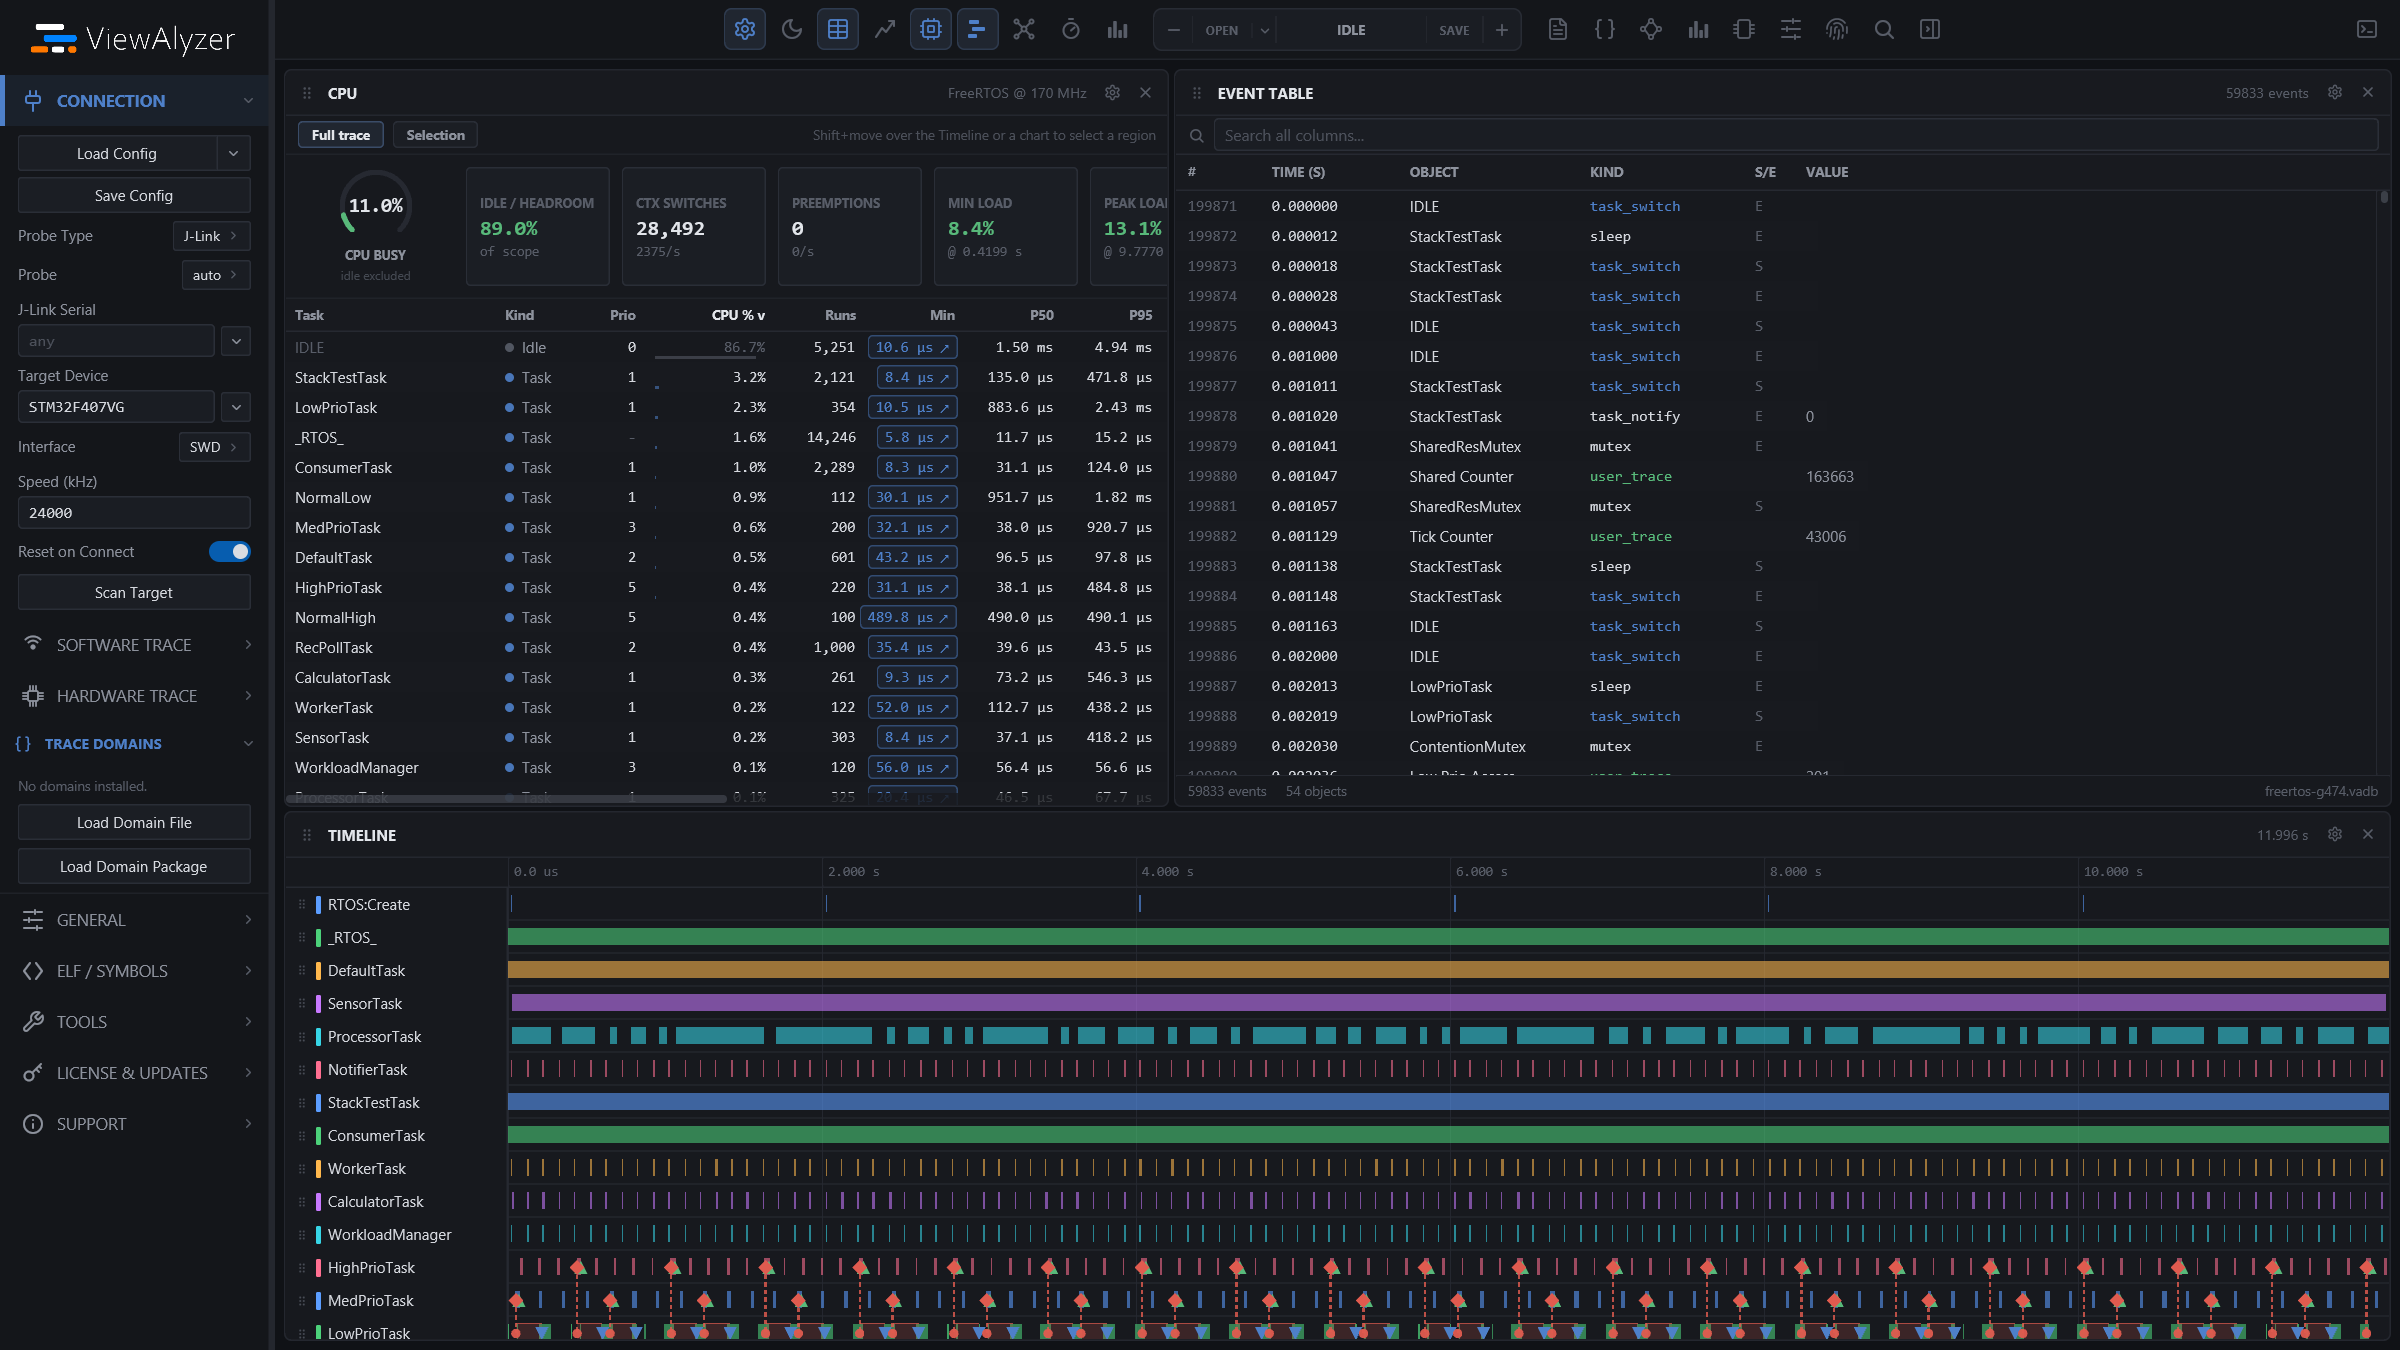
The sidebar holds every setting. The top bar holds one card per view and the capture capsule. The dock is where views live. The log sidebar on the right opens with the panel icon at the far right of the top bar. Both sidebars can be dragged wider or narrower at their inner edge.
The sidebar
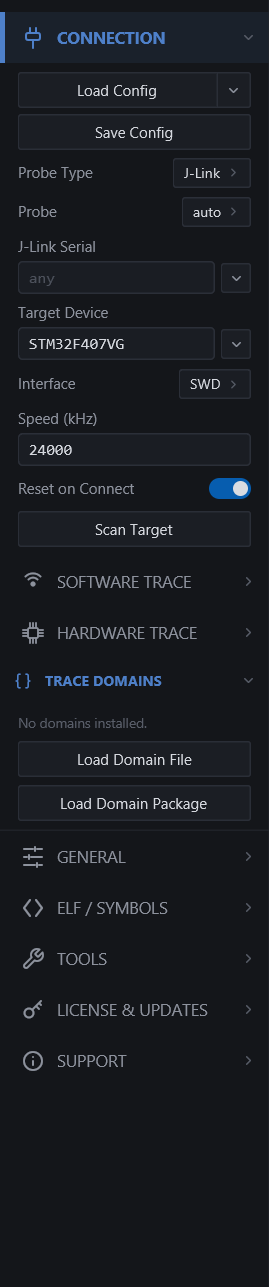
Sections open and close independently. A field's value is saved as soon as you leave it; a dropdown applies on pick. Fields that do not apply to the current choice are hidden (J-Link fields under ST-Link, SWO fields under RAM Buffer, and so on).
Connection
Probe type, serial, target device, interface and speed, CPU clock, and the network / serial parameters. Reset on Connect decides between recording from boot and attaching to the running firmware. Load Config / Save Config read and write .vacf files. Described field by field in Getting started, step 3.
Software Trace
Open Recording at the top opens a .vadb / .va from disk, the same action as OPEN on the capsule; its chevron lists recent recordings. Below it, the firmware-side recorder: the Trace Source (RAM Buffer, RTT, SWO) with its addresses and clocks, COBS framing for UDP / serial, and Take Snapshot for reading the RAM ring out of an untethered board. Live Trace Mode and Trace Tuning only are kept for settings compatibility and have no effect in this version: a capture always streams live.
Trace Domains
Installed domain descriptors, each with an on / off toggle (an enabled domain applies to every recording), a gear that opens it in the Domain Editor, and a delete button with a confirmation. Domains that bundle a live instrument show their parameters here. Load Domain File installs a .vadomain; Load Domain Package installs a folder.
General
| FIELD | MEANING |
|---|---|
| Sticky Cursor | A click in the Timeline, a chart, or the Timers and Comms timelines pins the shared cursor; click the same spot again to release it. |
| Live History (sec) | No effect in this version. |
| Toolbar Labels | Shows each top-bar card's name under its icon; off gives the compact icon-only bar. |
| Verbose logs | No effect in this version. |
| GPU Rendering | Linux only; no effect in this version. |
| Full Sync | No effect in this version: the zoom window is always shared between views. |
| Cursor Sync | No effect in this version: the cursors are always shared between views. |
| Load Full Trace After Stream | No effect in this version. |
The settings marked "no effect" are kept so a settings file saved by an earlier version loads unchanged.
ELF / Symbols
ELF File (used by Symbols, Memory, Timers, Overview) and MAP File.
Tools
Paths to external tools: the ARM toolchain and GDB, the J-Link install (when the SEGGER software is somewhere the app does not look), and the vacore_capture probe tool. Nothing here is needed for a normal native capture.
License & Updates and Support
The license status line says what licenses this machine and, when nothing does, what that costs: without a license ViewAlyzer runs in free mode (captures capped at 5 s with a 5 s cooldown between them, the first 10 task/ISR lanes, symbol polling up to 4 symbols at 100 Hz). Enter a key and press Activate License to bind this machine to it (needs the internet once; the license then works offline and refreshes itself when connected), or Install License File for a partner-issued viewalyzer-oem.license, which never contacts our server. Licensed To, Tier and Updates Until appear once a license is in force; Deactivate License releases this machine's seat so the key can move to another. Check for Updates asks what the newest build is (reporting only; a partner install is answered by the partner). The Support section links to email support, the documentation site and the website, or to whatever a partner's license file names instead.
The top bar and the capsule

One card per view, in this order: Settings (shows / hides the sidebar), Theme (cycles Dark, Graphite, Light), then Table, Trace, CPU, Timeline, Comms, Timers, Overview, Symbols, Call Graph, Memory, Registers, Trace Tune, Fingerprint, Analyzer, and the rest. Clicking a card opens its panel, or brings it to the front if it is already open somewhere; hovering a card names it in the capsule.
The capsule, idle:

| STATE | MEANING |
|---|---|
| REC (red dot) | Nothing running. Click it to start a capture. |
| REC 01:30 | A timed capture is armed; - / + change it in 30-second steps, down to plain REC for "until stopped". |
| LINK (amber) | Attaching to the target. |
| REC 00:42 (red) | Recording; the elapsed time counts up. The whole capsule is the stop button. |
| SAVING | Finalising the file after stop. |
| LOADING | Opening a recording or taking a snapshot. |
OPEN opens a recording from disk. SAVE saves the current one to a place of your choice and is highlighted while the recording in memory is unsaved. Both words hide while recording.
With a recording open, REPLAY appears beside REC:

REPLAY turns the whole capsule into replay controls that move the shared cursor through the recording, so every cursor-linked view follows. The X at the right end returns to the normal capsule. See Replay.
The dock: tabs, splits and tiles
Views live in tiles. A tile has a header with the view's title (and a status hint for some views), a grip, and a close button; tiles with several views show them as tabs.
- Drag a tab by its header onto another tile's header to tab it there.
- Drag it onto another tile's left, right, top or bottom band to split that tile and dock the view on that side.
- Drag the dividers between tiles to resize.
- Close with the tile's or the tab's close button, or click its top-bar card.
The arrangement, the open views, the theme and the sidebars are remembered between runs. The first-run layout is CPU and the Event Table above the Timeline.
Some views tile again inside themselves: the Trace panel's charts and the Timers and Comms Split views, each with the same drag and divider gestures.
The log
The log sidebar (panel icon, far right of the top bar) has two tabs:
- System: what the app did, one line per step (
[h:mm:ss pm] [LEVEL] message): probe attach, ring discovery, decode statistics, losses, warnings and errors. The first place to look when a capture does not behave. - User: string messages the firmware sent (
[ 12.345678] message), on the recording's clock.
Buttons clear the log, copy it, save it to a file, and toggle auto-scroll. Long lines wrap; the panel is drag-resizable.
The shared time model
Every time-based view reads the same four things, so what you do in one is visible in all of them:
| THING | HOW IT IS SET | WHERE IT SHOWS |
|---|---|---|
| Zoom window | Ctrl+wheel (Cmd+wheel on macOS) over the Timeline, a chart, or the Timers timeline zooms around the pointer (a plain wheel does it in the Comms flow chart, which has nothing to scroll); Shift+wheel or a horizontal wheel pans; drag pans; a fit chip returns to the full recording | Timeline ruler, chart time axis, Timers ruler, Comms window caption; the Comms Split view scopes its table to it |
| Hover cursor | Moving the pointer over any of those views | A hairline in every view with a time axis, with the time in each ruler |
| Pinned cursor | A click, when Sticky Cursor is on; a double-click in the Event Table, CPU tiles, Analyzer findings and the Timers / Comms jumps pin it too and flash the spot | An amber hairline everywhere; the Event Table keeps the nearest event centred; the next click anywhere releases a jump-pinned cursor |
| Selected region | Hold Shift and move the pointer over the Timeline or a chart: the region sweeps from where Shift went down and settles when you release it; Escape clears it | Dimmed outside the region in the Timeline and charts; the CPU and Analyzer views can scope to it (the Selection pill) |
Themes, scale and shortcuts
| KEY | ACTION |
|---|---|
Ctrl / Cmd + +, Ctrl / Cmd + -, Ctrl / Cmd + 0 | Scale the whole interface up, down, back to 100 % |
| Escape | Clear the selected region |
| Ctrl / Cmd + wheel | Zoom the time axis around the pointer |
| Shift + wheel, or a horizontal wheel | Pan the time axis |
| Shift + move | Sweep the selected region |
The Theme card cycles Dark, Graphite and Light.
Where things are stored
| OS | PER-USER FOLDER |
|---|---|
| Windows | %APPDATA%\ViewAlyzer-GPUI\ |
| macOS | ~/Library/Application Support/ViewAlyzer-GPUI/ |
| Linux | $XDG_CONFIG_HOME/ViewAlyzer-GPUI/ (default ~/.config/ViewAlyzer-GPUI/) |
Inside it: sidebar-settings.xml (every sidebar field and toggle), state.json (window, theme, dock layout), recordings/ (captures and snapshots, shared with the command line), the Trace Tune graph, and the installed domains. Deleting state.json restores the first-run layout; deleting the whole folder resets the app.