 DOCS/VIEWALYZER/TIMERS
VIEWALYZER · GPUI EDITION
DOCS/VIEWALYZER/TIMERS
VIEWALYZER · GPUI EDITION
Timers
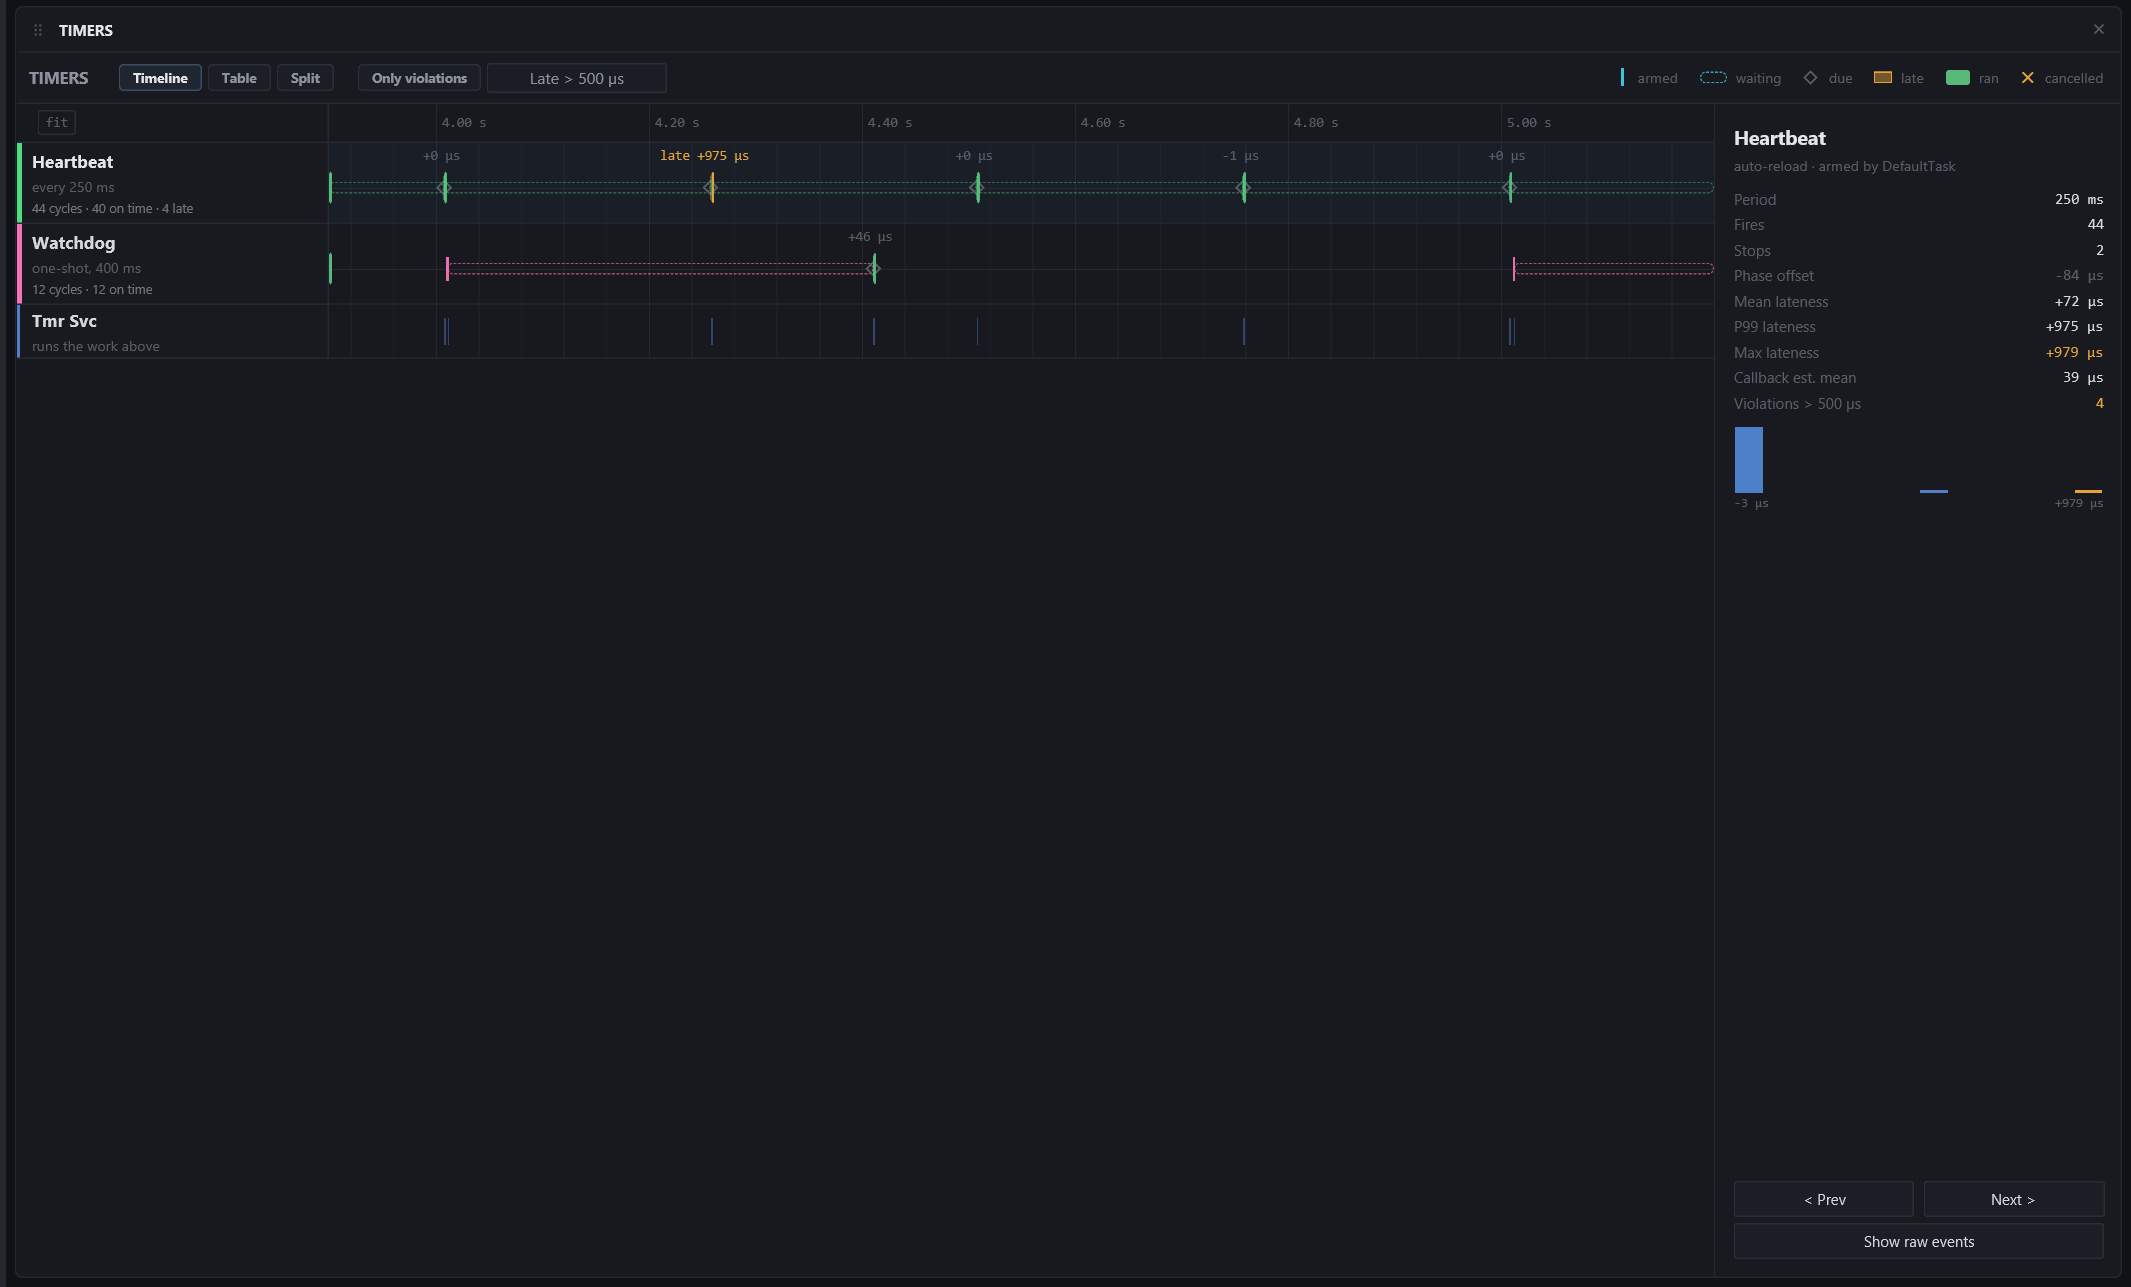
Kernel timers and deferred work, drawn as cycles: a timer is armed, comes due, fires, its callback runs, it re-arms. Every row draws that arc, and the view answers the question a timer user actually has: is it firing on time, and if not, what got in the way.
Needs: a recording with timer events (FreeRTOS software timers, Zephyr k_timer and k_work). Enable the timers category in the recorder build if the view stays empty on a firmware that uses them.
The rule the view follows
Nothing is invented. A fire is either measured (the kernel emitted the expiry, which FreeRTOS does from its timer service task) or computed from the arm time and period, and computed fires are drawn hollow and never feed the statistics. Zephyr has no expiry trace point, so its k_timer rows are computed; wrap the handler in VA_EVENT_START / VA_EVENT_END to measure it.
Three ways to look
The toolbar's Timeline, Table and Split pills switch views.
Timeline
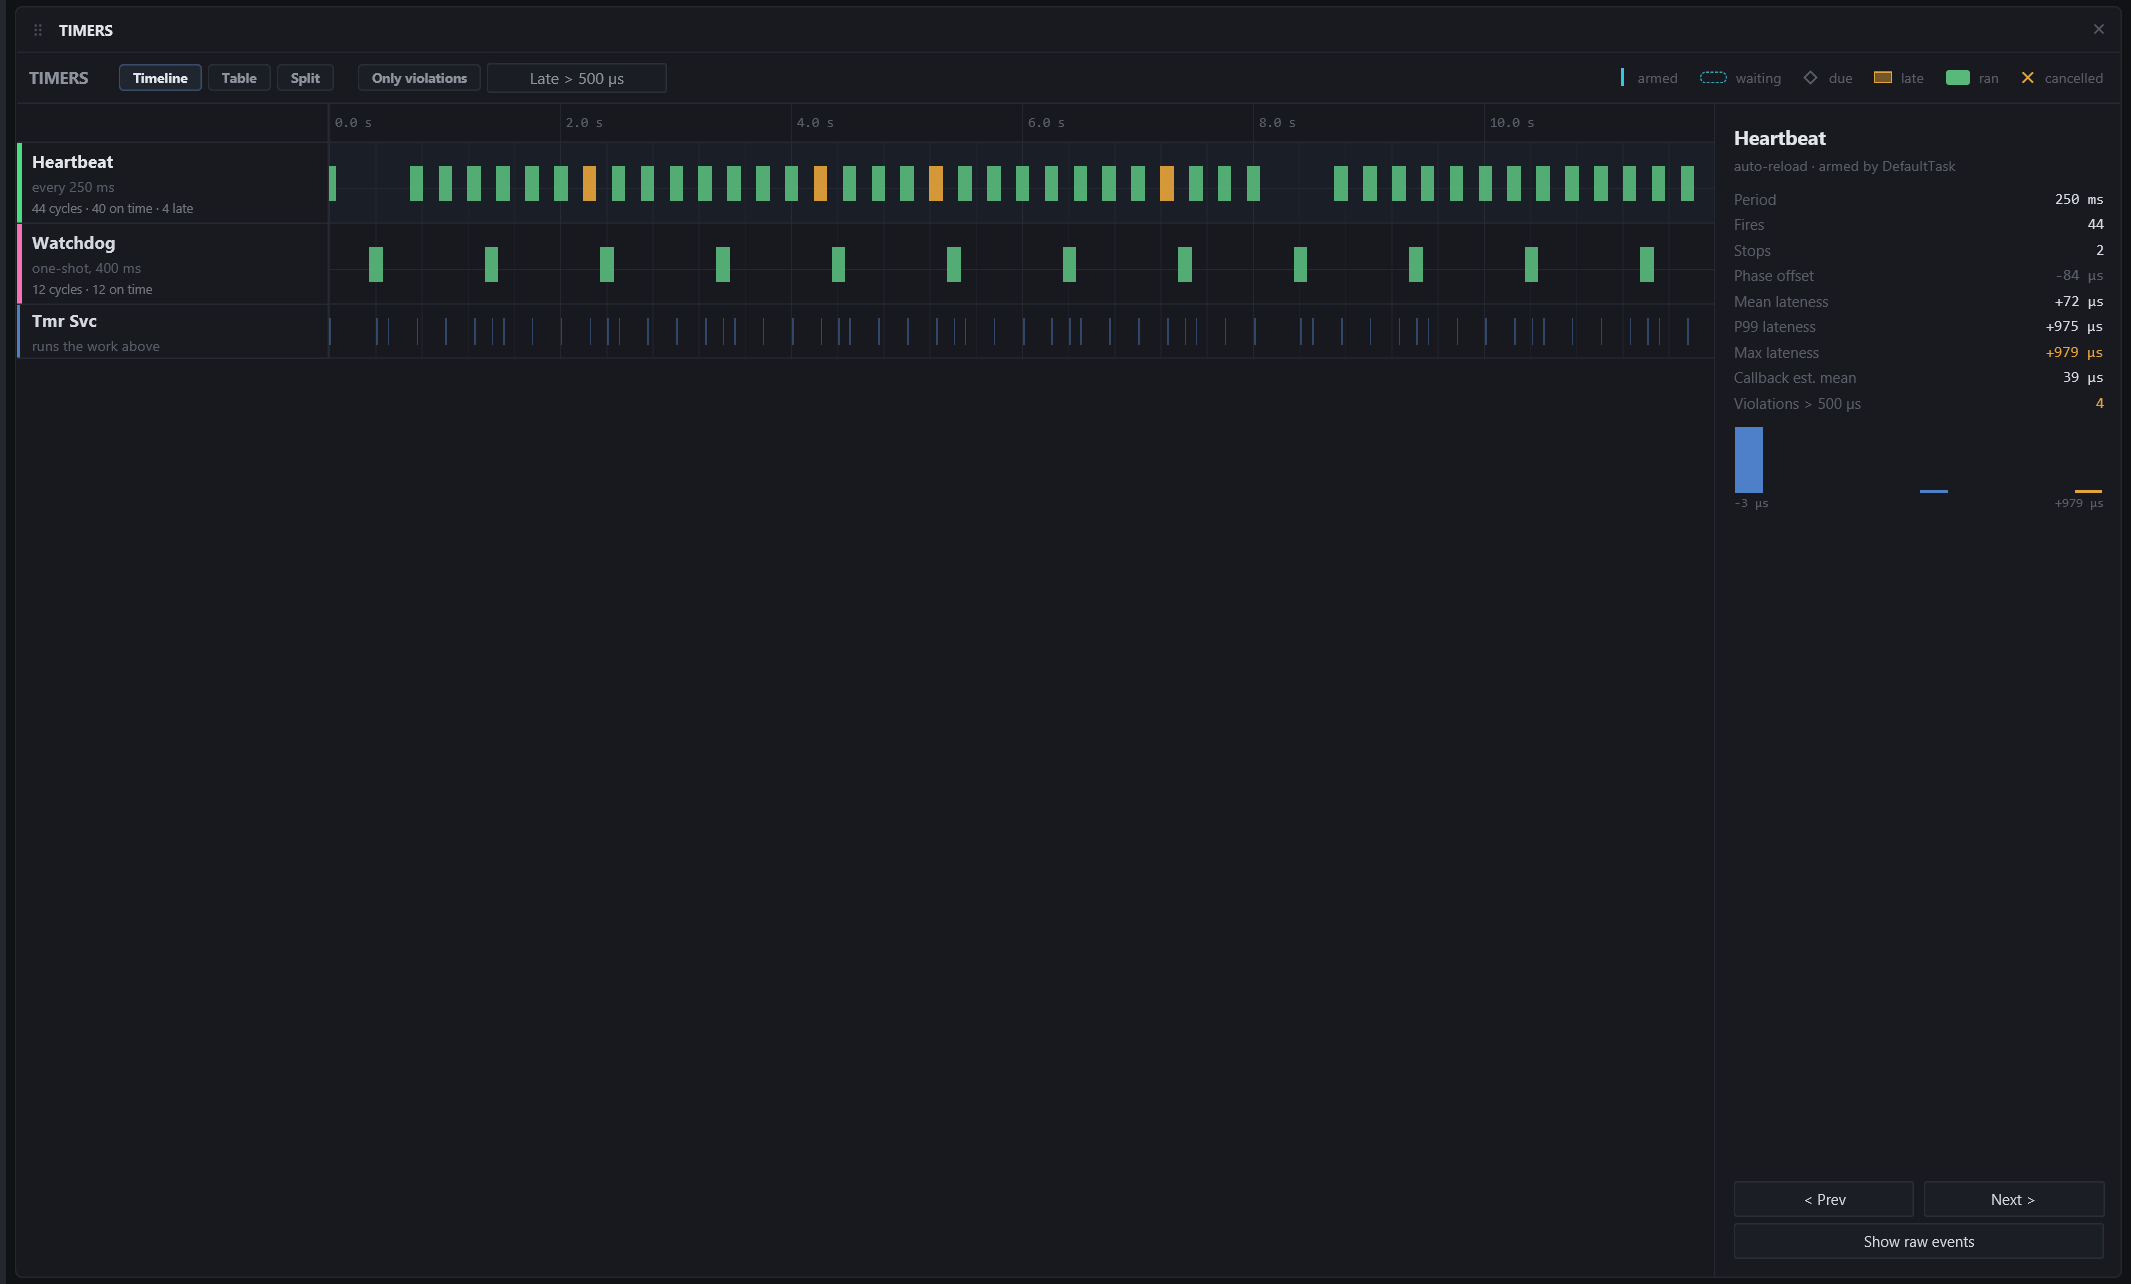
One row per timer or work handler on the shared time axis, and a row for the service task that runs them (Tmr Svc on FreeRTOS, sysworkq on Zephyr). The drawing grammar never changes between rows:
| GLYPH | MEANING |
|---|---|
| Vertical tick | Armed (a re-arm at the previous expiry is drawn fainter) |
| Hollow dashed track | Waiting: the timer is pending. Never filled, so it cannot be mistaken for execution |
| Hollow diamond | Due: when it was supposed to fire |
| Amber box | Lateness: from due to fired, drawn to scale, outlined solid when it breaks the threshold |
| Solid green block | Ran: the callback or handler executing. The only solid fill in the view. Hatched with "1 of N" when several items were due in the same service slice and the owner is uncertain |
| Amber cross | Cancelled or stopped before it came due |
| Red hollow box, "never ran" | Came due and nothing was ever seen running it |
Zoomed out, a row has no room for this anatomy and collapses to a health strip: one column per cycle, green on time, amber late or cancelled, red missed, and the row label carries the tally ("226 cycles · 221 on time · 5 late"). Zoom in and the capsules come back.
A work handler whose arms consistently follow one timer's expiries is indented under that timer, and the service task's slices wash faintly behind work rows so an attributed run block is visibly inside one.
Gestures are the Timeline's: Ctrl+wheel zooms, Shift+wheel and drag pan, plain wheel scrolls the rows, hover moves the shared cursor, the fit chip in the ruler shows the whole recording. Click a cycle to select it (a ring marks it); double-click to spotlight it: the Timeline zooms onto the cycle's span, the cursor pins on its run, the service slice that ran it is selected for the Details view, and the raw event behind a measured fire is selected in the Event Table. Click a row's label to select the row.
Table
The same rows as a sortable table: type, name, interval, cycles, on time, late, cancelled, never ran, mean / P99 / max lateness, time in handler. A lane with nothing measured shows - in the outcome columns rather than zeros. The status strip above it says how many rows and which threshold are in effect.
Split
Table on the left, timeline on the right, with a draggable divider. Picking a row selects that lane in the timeline.
Toolbar
- Over threshold: keep timer and work-handler lanes with at least one cycle later than the selected tolerance. Cancellation alone is not a violation. The remaining lanes retain their other cycles for context.
- Late > 500 µs: click to cycle the lateness threshold through 100 µs, 250 µs, 500 µs, 1 ms and 5 ms. Outcomes and tallies re-grade at once.
- The legend on the right names each glyph.
Inspector
Select a row (or a cycle) and the inspector opens on the right:
- For a timer: period or duration, fires, stops, the phase offset that was removed (the arm timestamp lands mid-tick while the kernel counts whole ticks, so the constant part is subtracted and what is left is jitter), mean / P99 / max lateness, the estimated callback time, violations against the threshold, and a lateness histogram.
- For a work handler: queued, scheduled, ran, cancelled, never seen running, mean time in the handler, and how many run blocks have an uncertain owner.
- For the service task: what it is.
- Under it, the selected cycle told as a sentence: armed at, due at, fired at (how late), ran for (on which task), and for a violation the cause found in the window: another timer's callback occupying the service task, or a task that held the CPU.
- < Prev / Next > step through the selected timer or work handler's violations, centring each in the view. Show raw events filters the Event Table to the timer's events.
A notice under the toolbar tells you when a capture has timer events but no arm events: fires are shown, but expected times and lateness need the timers category enabled in a current recorder.
Tips
Timer and work lanes use the same legend colors: cyan armed/waiting, gray due, amber late/cancelled, and green execution. The demo's heartbeat timer appears as Timer when the recorder supplies its default name.
Zephyr 4.4.2 callback hooks provide measured expiry callback boundaries. The inspector labels their duration Callback mean and separately shows stop callback count and mean duration. A stop callback is not counted as an expiry. An entry without a matching exit, including across event loss, has no measured duration. Older kernels retain their existing timer view and estimates, labeled Callback est. mean where available. These hooks do not add automatic Zephyr work-handler execution tracing.
- Set the threshold to the tolerance the system actually has before reading the tally; "late" is only meaningful against a number.
- k_work handlers are named from the ELF (ELF / Symbols); without it they show as addresses.