 DOCS/TRACE DOMAINS
BKPT DEBUG & VIEWALYZER RS
DOCS/TRACE DOMAINS
BKPT DEBUG & VIEWALYZER RS
Trace Domains
Trace Domains bring controller registers, middleware objects and application state together in decoded views. Choose a definition matched to your firmware, understand its measurements, and follow the evidence through cards, tables and traces.
Browse the Domain catalog for USBX/ThreadX, STM32N6 Ethernet, the STM32WB IMU, Joulescope channels and the complete STM32WB55 BLE suite. Each engineering reference explains the fields, cards, units, findings and limitations. The separate Authoring examples provide templates to adapt to your own firmware or recorder. Contribute domains on GitHub.
Load a domain matched to your device and firmware. It supplies the knowledge of which registers and firmware objects matter, what their values mean, and which conditions deserve attention. You can follow the subsystem's behavior without digging through reference manuals, tracing structure definitions or assembling watch lists by hand.
The debug probe can observe existing controller and firmware state without a recorder library. Some domains require firmware observation mirrors or hooks, including the BLE suite and IMU demo; styling domains annotate channels that were recorded elsewhere. Each catalog entry identifies its acquisition requirements.
Start with USBX on ThreadX
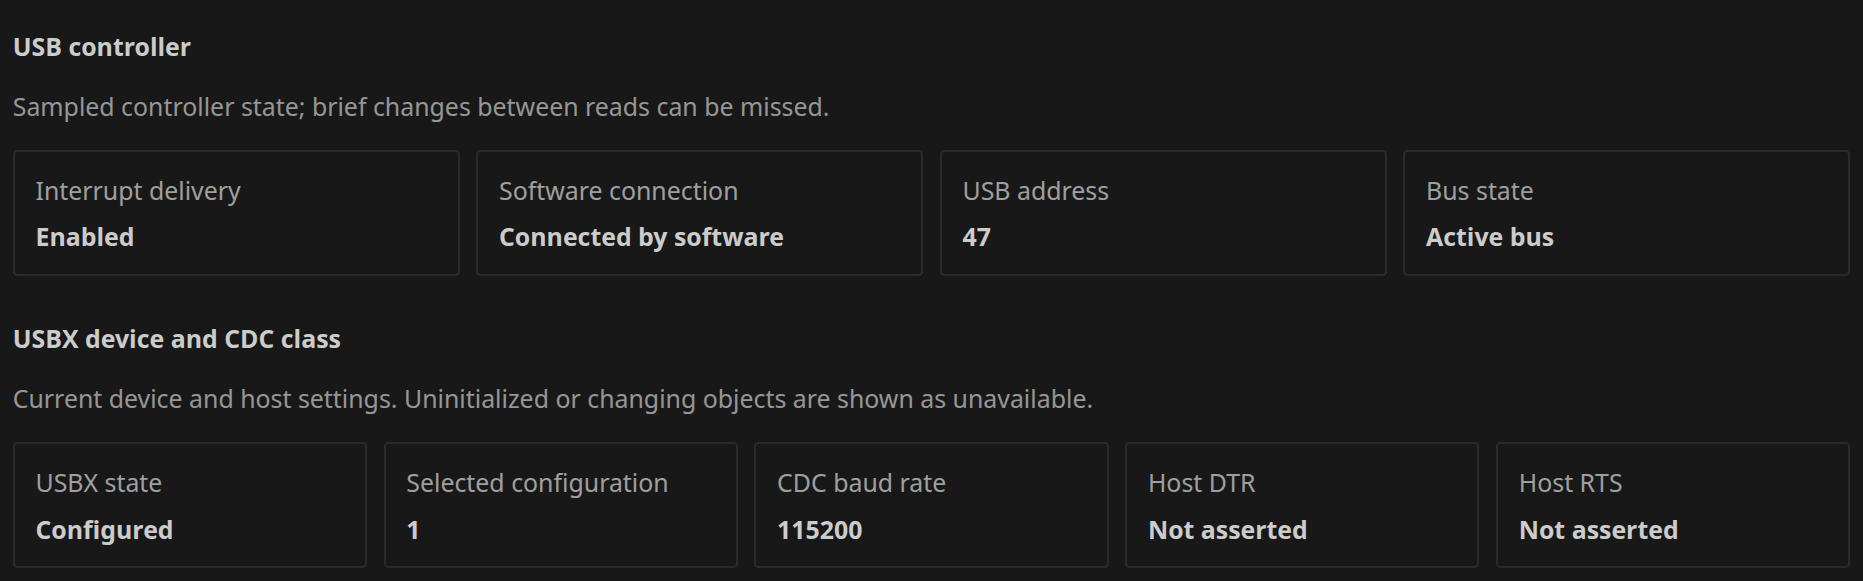
The walkthrough follows a USB CDC ACM to UART bridge running on a NUCLEO-U575ZI-Q. See USB controller state alongside USBX configuration, endpoint requests, ThreadX waits and application buffer progress. The current descriptor adds error, control-queue and allocator observations for 37 inputs and five derived channels. The walkthrough explains healthy idle behavior and traffic; its screenshots show the earlier 24-input view.
Open the USBX on ThreadX walkthrough for setup and real application screenshots. Use the USBX engineering reference for all 42 channels, exact value dictionaries and checks.
What a domain adds
| PART | WHAT YOU SEE | WHERE THE VALUES COME FROM |
|---|---|---|
| Inputs | Raw registers and application state | In this example, the probe polls SVD-defined registers and symbols or structured members resolved from the matching ELF's debug information. |
| Derived channels | Decoded bit fields with meaningful names | Calculations on those observations, such as a USB address or interrupt-enable flag. |
| Cards and tables | Related values grouped into subsystem sections | The descriptor chooses labels, grouping and display; values retain their observation availability. |
| Findings | A condition, severity, explanation and supporting evidence | Rules evaluate valid observations over time. For example, USB interrupt delivery disabled for at least half a second. |
Domains can also describe existing recorder channels. The USBX example uses probe observations and needs no ViewAlyzer Recorder integration in the firmware.
One file, two workflows
A Trace Domain packages that subsystem knowledge in a portable .vadomain JSON file. Use the same file in BKPT Debug or ViewAlyzer RS.
| PRODUCT | SET UP | FOLLOW THE DOMAIN |
|---|---|---|
| BKPT Debug, the VS Code debug extension | Install the domain in Trace Domains, enable it for the workspace, select the matching ELF and SVD, then start debugging and run the target. | Trace Domains shows input availability, cards, tables and findings. Traces shows channels selected with each value's Graph control; cards and tables retain the other values. Health describes acquisition. |
| ViewAlyzer RS, the desktop app | Use Load Domain File in the sidebar's Trace Domains section, enable it, and configure the matching ELF, SVD and probe before capture. | The sidebar gear opens its live domain view with collapsible cards/tables and per-value Graph choices. The pencil edits its JSON. Stop capture to review completed findings in Analyzer. |
The descriptor is shared. Installing or enabling it in one product does not configure the other product. Use one application at a time with a probe. This guide covers BKPT Debug and the ViewAlyzer RS desktop app; their controls and capture lifecycle differ.
Choose the view
Existing JSON sections fold automatically in both apps: cards start open and tables closed. Add optional section collapsed values to change those initial states. For deeper nesting, a field's group array defines a path such as Service → Characteristic → Value; neither app guesses the hierarchy from channel names. Expansion and Graph choices are remembered separately, without changing collection or retained history.
For desktop domain-only capture, turn Software Trace off and enable a sampled domain. Recorder firmware is unnecessary; combined recorder capture remains available. The desktop stays read-only. Typed actions require explicit Send in BKPT Debug.
Understand the observation
In BKPT Debug, set the requested polling rate from 1 to 1,000 Hz per input in the domain's Settings. The USBX descriptor supplies a 20 Hz default, which you can adjust for your capture. Observed shows the rate achieved with your probe and selected inputs; selecting fewer inputs can allow faster sampling.
Samples are taken through the probe while the target runs. Brief changes between reads can be missed, and fields read separately do not form an atomic snapshot.
An unavailable input is missing evidence, not zero and not a subsystem failure. A disconnected probe, disabled peripheral clock, missing SVD or unresolved firmware object can all prevent an observation. Resolve that reason before interpreting a card or finding.
Reference and authoring
Use Creating custom Trace Domains for the complete version-one format, step-by-step examples and offline validation directly with the ViewAlyzer CLI (the Python SDK is optional). Download the Markdown guide to use with your editor or AI assistant. The ViewAlyzer Trace Domains guide covers the desktop sidebar and Domain Editor.