 DOCS/VIEWALYZER
VIEWALYZER · GPUI EDITION
DOCS/VIEWALYZER
VIEWALYZER · GPUI EDITION
VIEWALYZER · USER GUIDE
ViewAlyzer User Guide
ViewAlyzer records what your firmware does, at the level of tasks, interrupts, kernel objects, timers and your own trace channels, and turns that into views you can read: a timeline, charts, tables and a set of analyses that say what went wrong and where. Recording needs a small recorder compiled into the firmware; the desktop app connects over the debug probe (or a network / serial link) and everything else happens on the host.
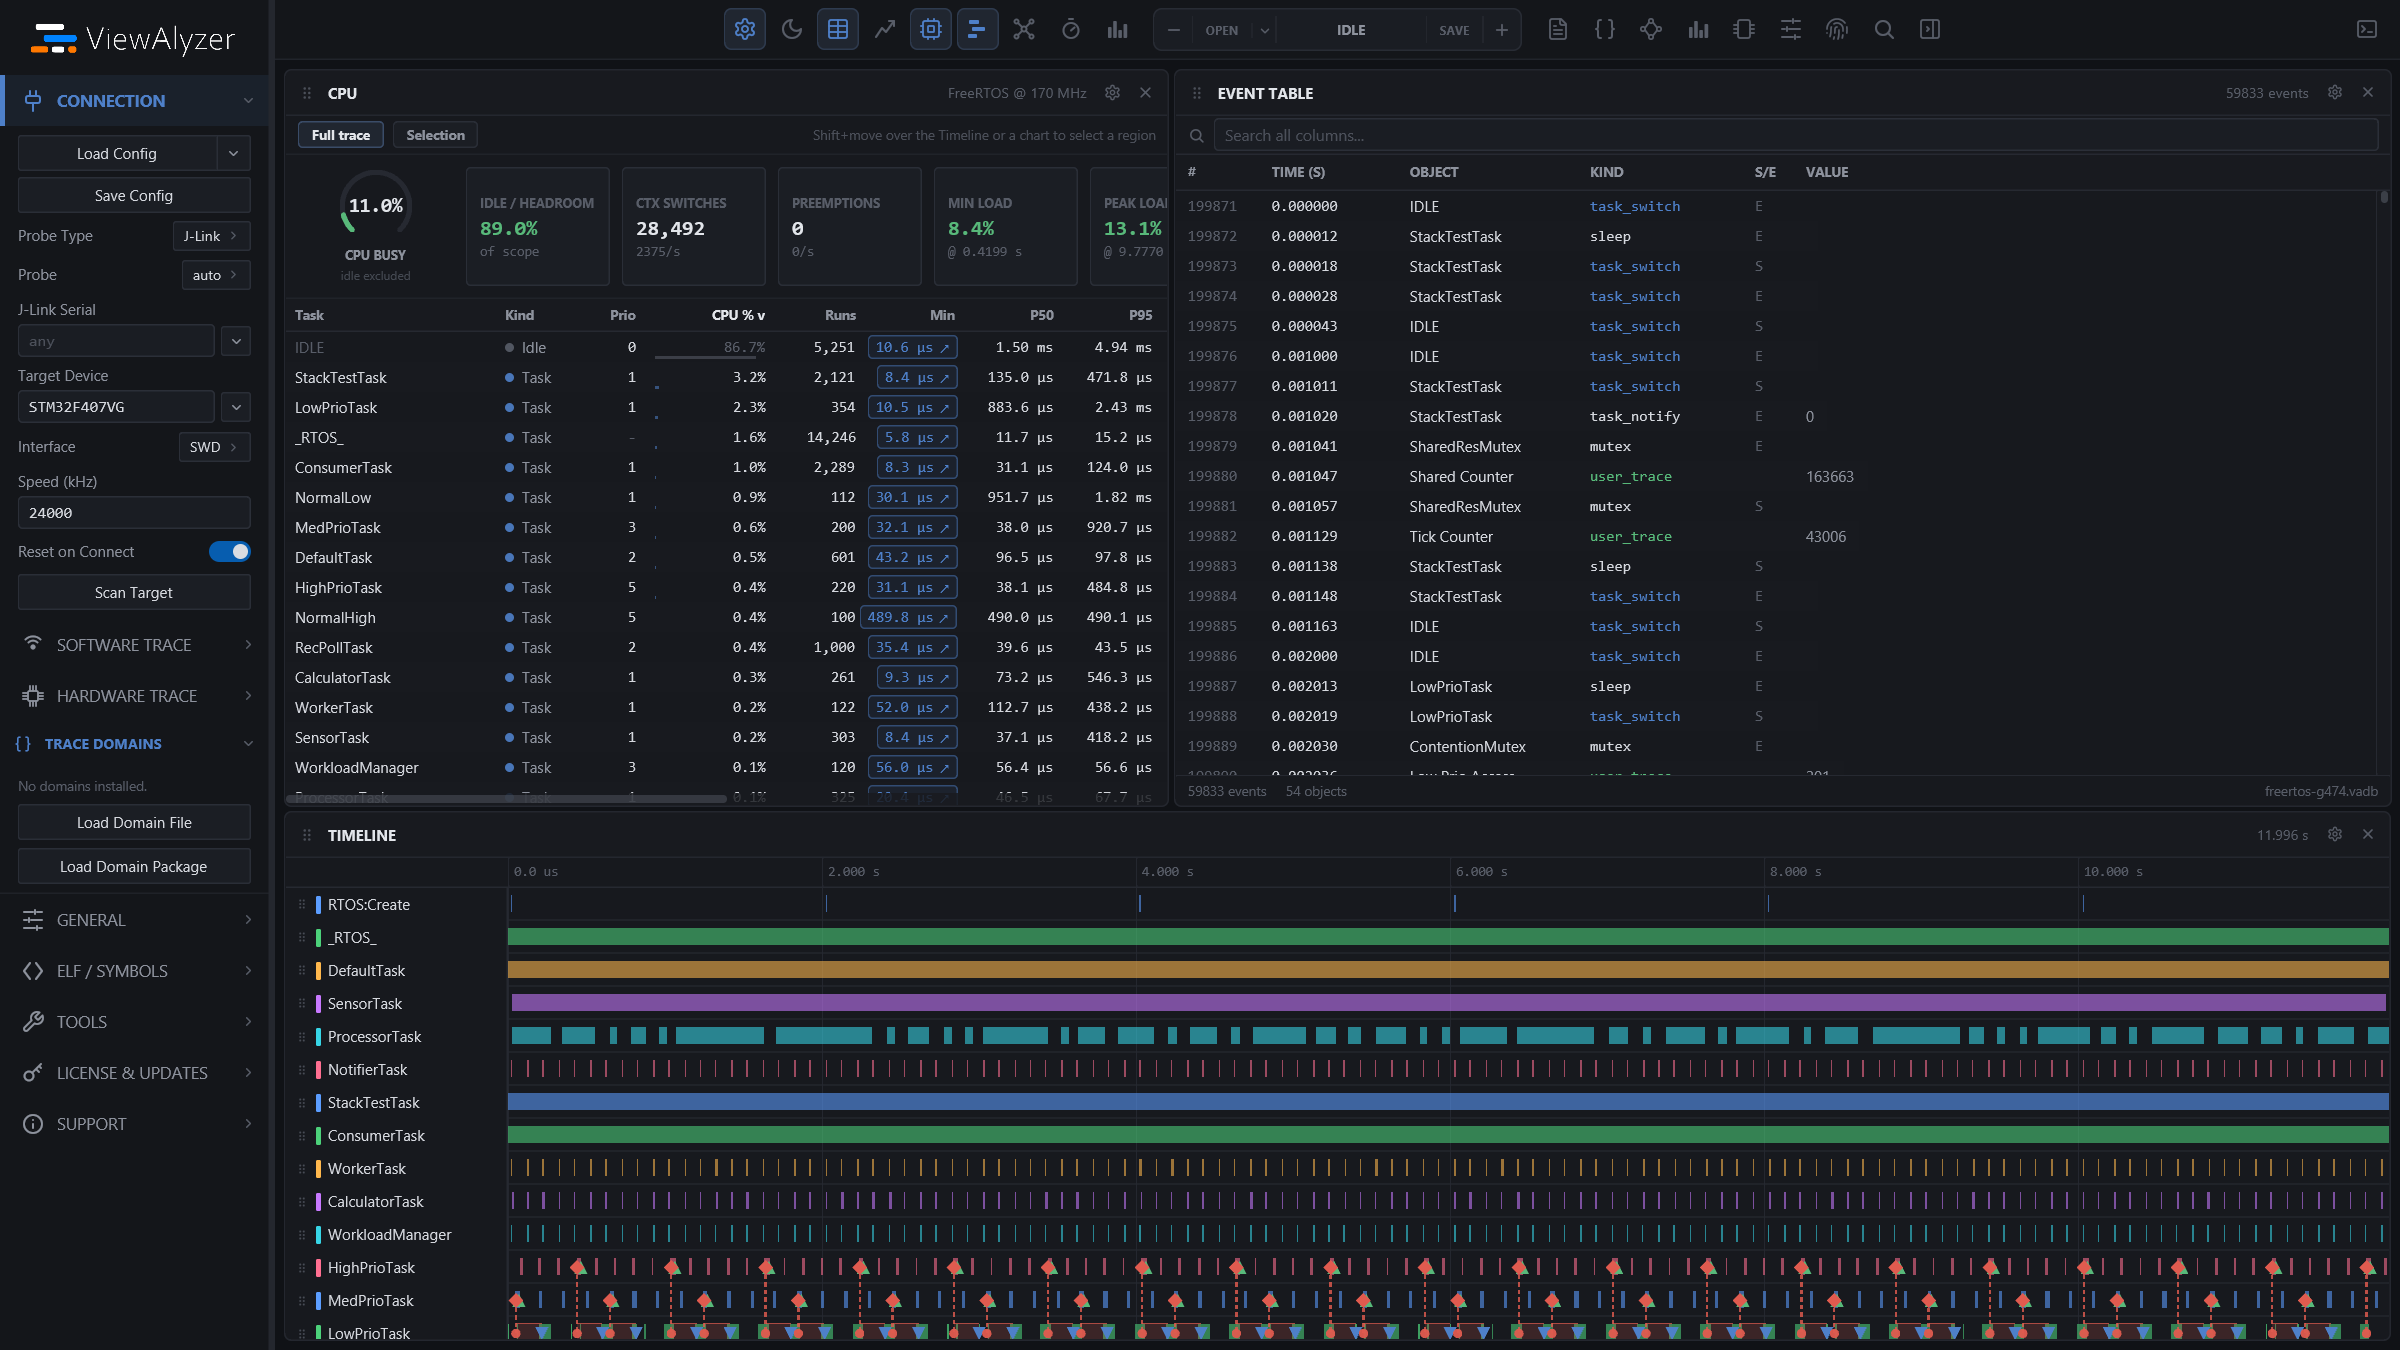
This guide is written in the order you meet things:
- Getting started: from an un-instrumented firmware to your first recording on screen, step by step.
- The workspace: the window, the sidebar settings, the capture capsule, the dock, the log, keyboard shortcuts, and the time model every view shares.
- The views: what each panel shows, when to reach for it, and how to use it.
Reference documents that go deeper than this guide:
- CLI and automation:
viewalyzer-clifor scripted captures, live streams and JSON queries over recordings, with the Python SDK on top of it. - Recorder API: the firmware side, per adapter and transport.
- Command line contract: the CLI's complete flag reference in the source repository.
- Trace Domains: the
.vadomaindescriptor format that teaches ViewAlyzer a subsystem's vocabulary (MAC, IMU, power stage...). - External instrument series and time sync: merging a bench instrument's data into a recording on the firmware's clock.
The five-minute version
- Add the recorder to your firmware and pick a transport (RAM buffer over the board's own ST-LINK is the recommended default). The fastest way to see it working is to flash one of the ready-made example projects.
- Start ViewAlyzer, open the Connection section in the sidebar, set the probe, the target device and the CPU clock, then set the Trace Source under Software Trace to match the firmware build (or load the
.vacfconnection config that ships with the example). - Click the capsule in the top bar. It reads LINK while it attaches, then REC with a running clock. The Trace panel streams live; the other views fill in when you stop.
- Click the capsule again to stop. The recording is saved as a
.vadbfile and every view is populated. Use OPEN on the capsule to come back to it later, or SAVE to put a copy where you want it. - Point ELF / Symbols at the firmware's
.elfto unlock the Symbols and Memory views and named work handlers in the Timers view.
Which view answers which question
| QUESTION | VIEW |
|---|---|
| What ran when, and what ran instead of my task? | Timeline |
| What exactly happened at 12.345 s? | Event Table |
| What is that variable doing over time? | Trace, Symbols |
| How busy is the CPU and who uses it? | CPU, Overview |
| Why is this task late, blocked or jittery? | Analyzer, Details |
| Are my periodic timers firing on time? | Timers |
| Where does a message spend its time between tasks? | Comms |
| How much flash and RAM does the build use? | Memory |
| I need a filtered, derived or smoothed signal | Trace Tune |
| How do I teach the app my peripheral's vocabulary? | Trace Domains |