 DOCS/VIEWALYZER/DETAILS
VIEWALYZER · GPUI EDITION
DOCS/VIEWALYZER/DETAILS
VIEWALYZER · GPUI EDITION
Details
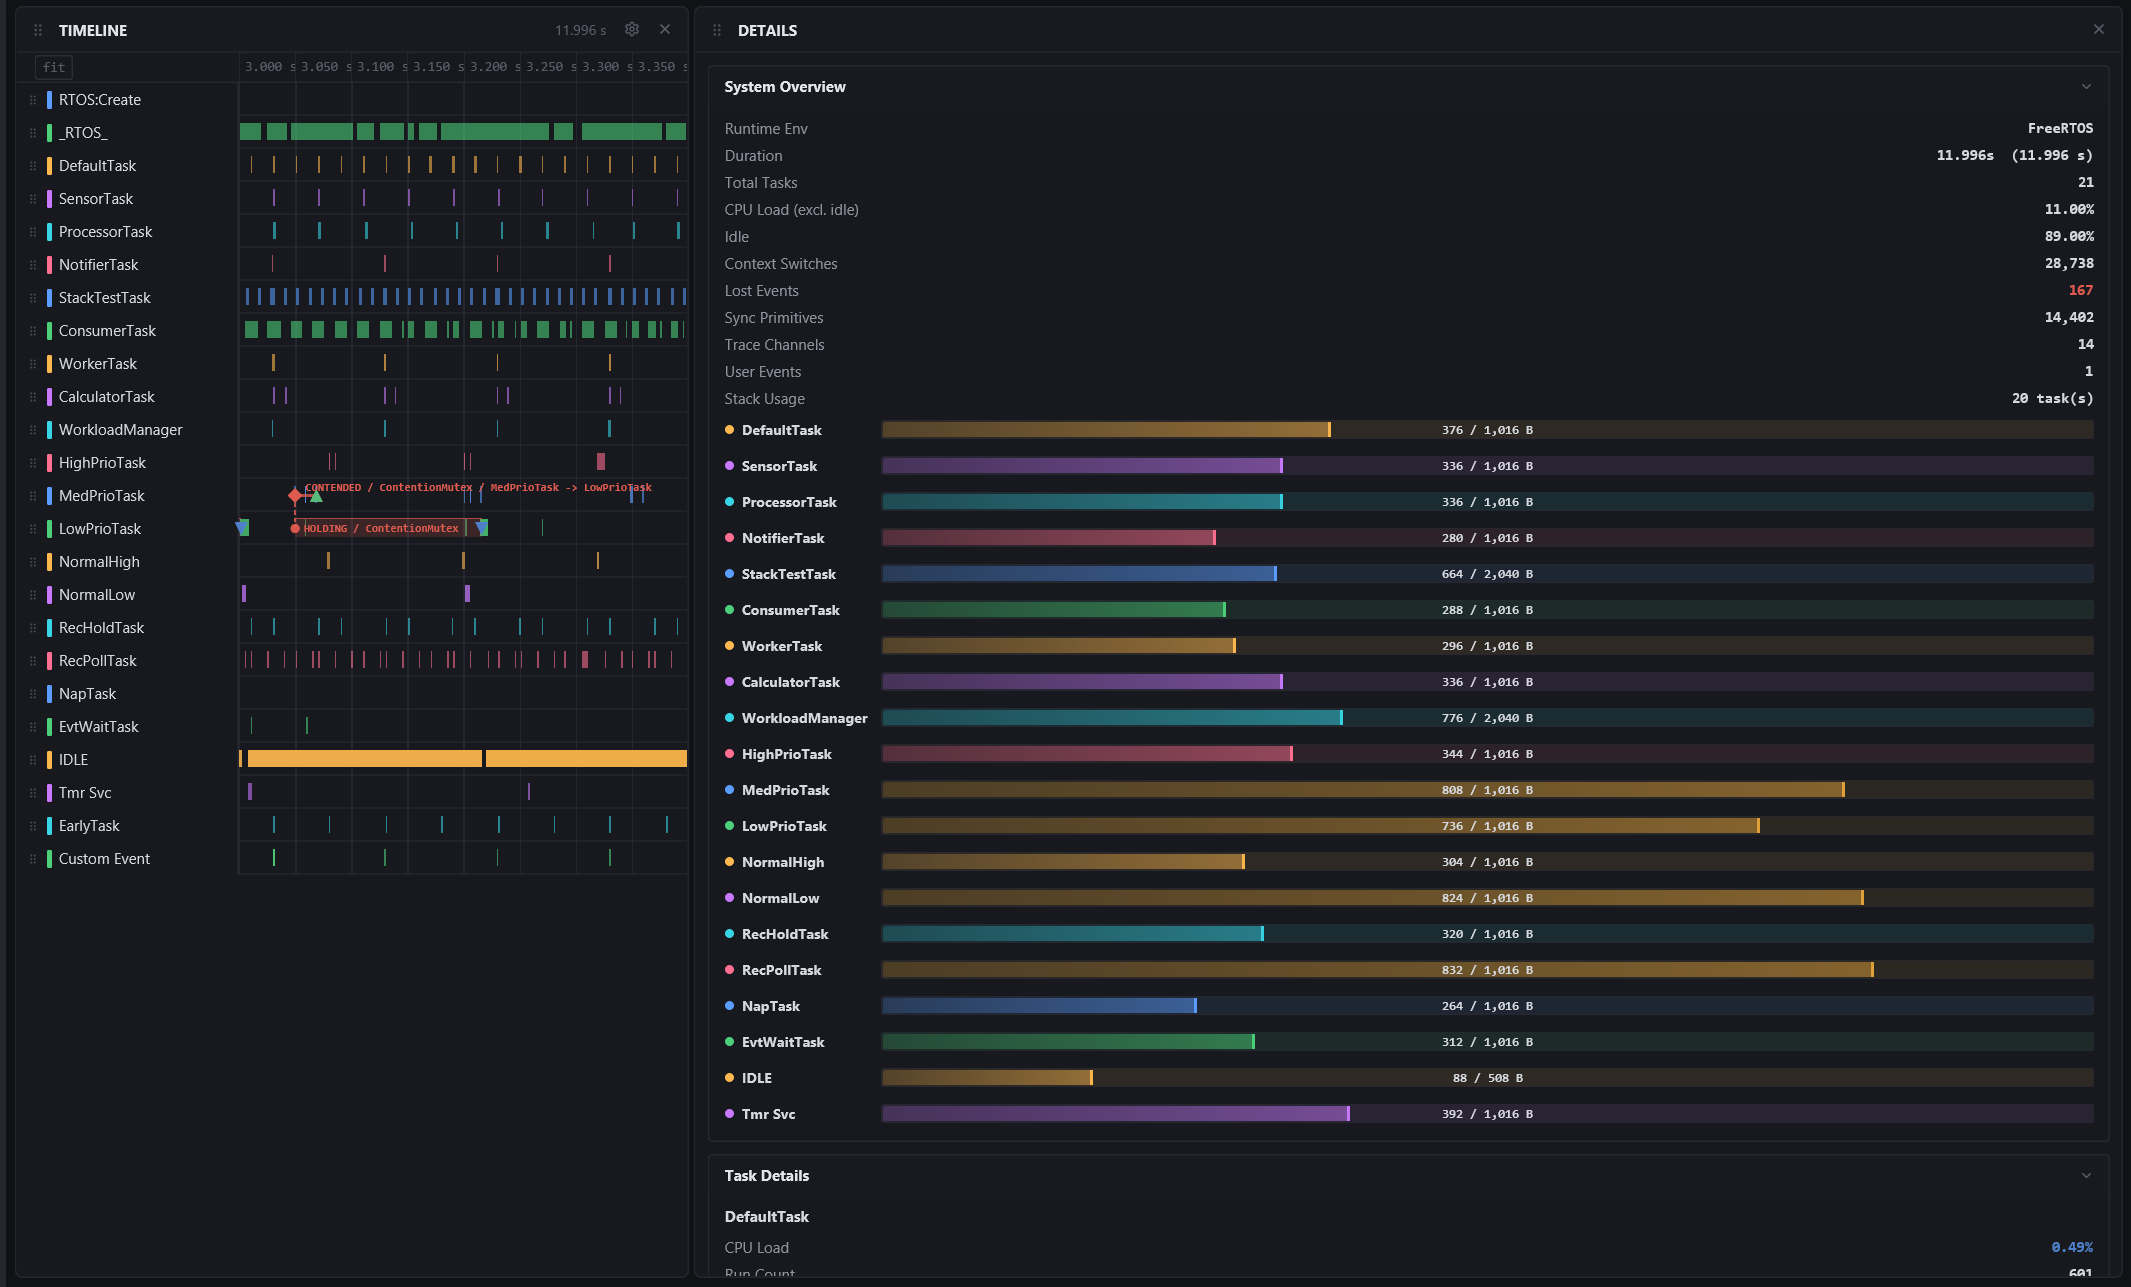
Two things in one panel: the system at a glance, and everything about the task slice you clicked.
Needs: a recording. The task sections need a selection.
System Overview
Always shown: duration, events, tasks and interrupts, context switches, preemptions, CPU load, and one stack bar per task (used against size, amber above 70 %, red above 85 %) in the task's lane colour. Sections collapse with a click on their title.
Selecting a slice
Click a slice in the Timeline, or a row in the Event Table. The slice is outlined in amber in the Timeline and the panel adds:
| SECTION | CONTENT |
|---|---|
| Task Details | The task's summary: runs, CPU share, priority, stack |
| Timeline Window | Where the selected slice sits and how long it is |
| Timing / Execution / Jitter / Task Info | Four metric cards: period and activation statistics, run-time percentiles, jitter figures, and the task's identity and configuration |
| Preemptions | Who preempted this task, how often, for how long |
| Synchronization Activity | The kernel objects this task gave, took, blocked on, and how many times |
The selection stays until you pick another slice; clicking empty space never clears it.
IPC and scheduling details
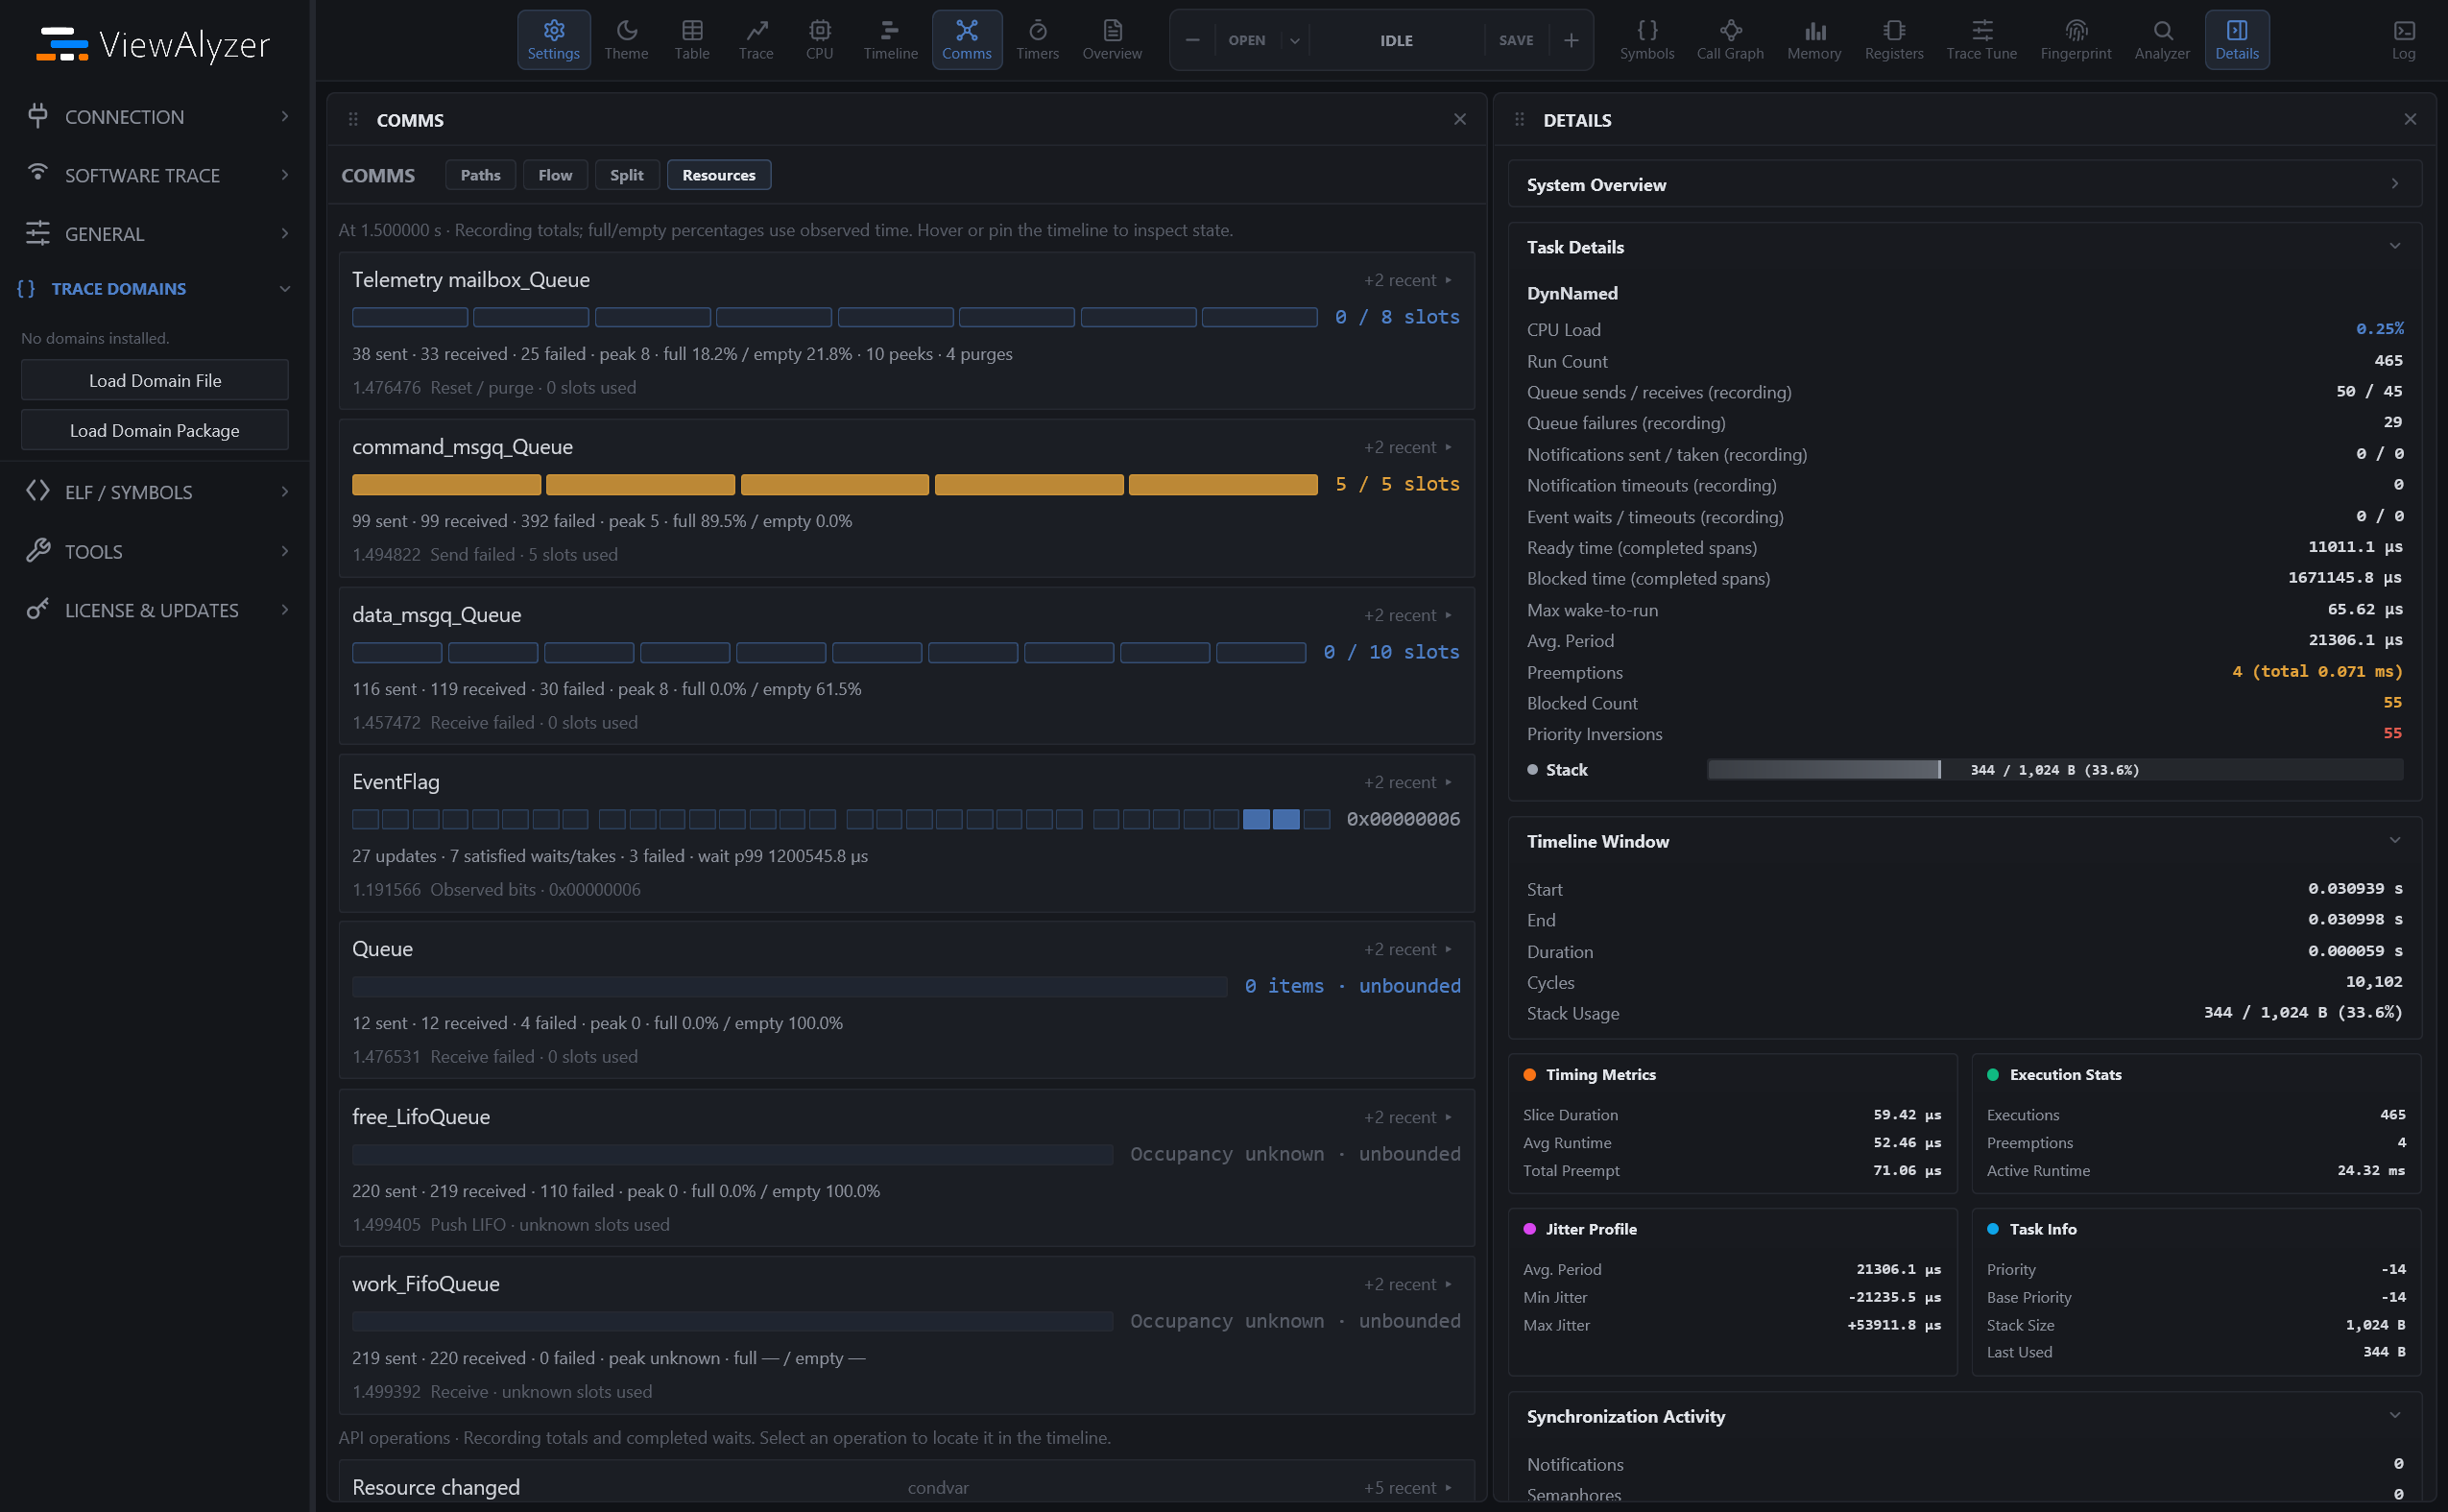
With the corresponding hooks enabled, task details include queue sends, receives and failures, notification activity and timeouts, and event-flag waits. The resource observations help connect a task's behavior with the values shown in Comms > Resources.
Scheduler-state events also provide the previous wait reason, priority at the selected time, completed ready and blocked durations, and maximum wake-to-run latency. Missing hooks leave those observations unavailable; incomplete waits at capture or loss boundaries do not become completed latency measurements.
Tips
- The numbers are the same ones the CPU table shows for the task, presented for one task at a time; the two views agree by construction.
- Missing values show as
-: a task without a period has no jitter figures, a task without stack reporting has no stack bar.