 DOCS/BKPT DEBUG/FAULT ANALYZER
BKPT DEBUG · VS CODE
DOCS/BKPT DEBUG/FAULT ANALYZER
BKPT DEBUG · VS CODE
Fault Analyzer
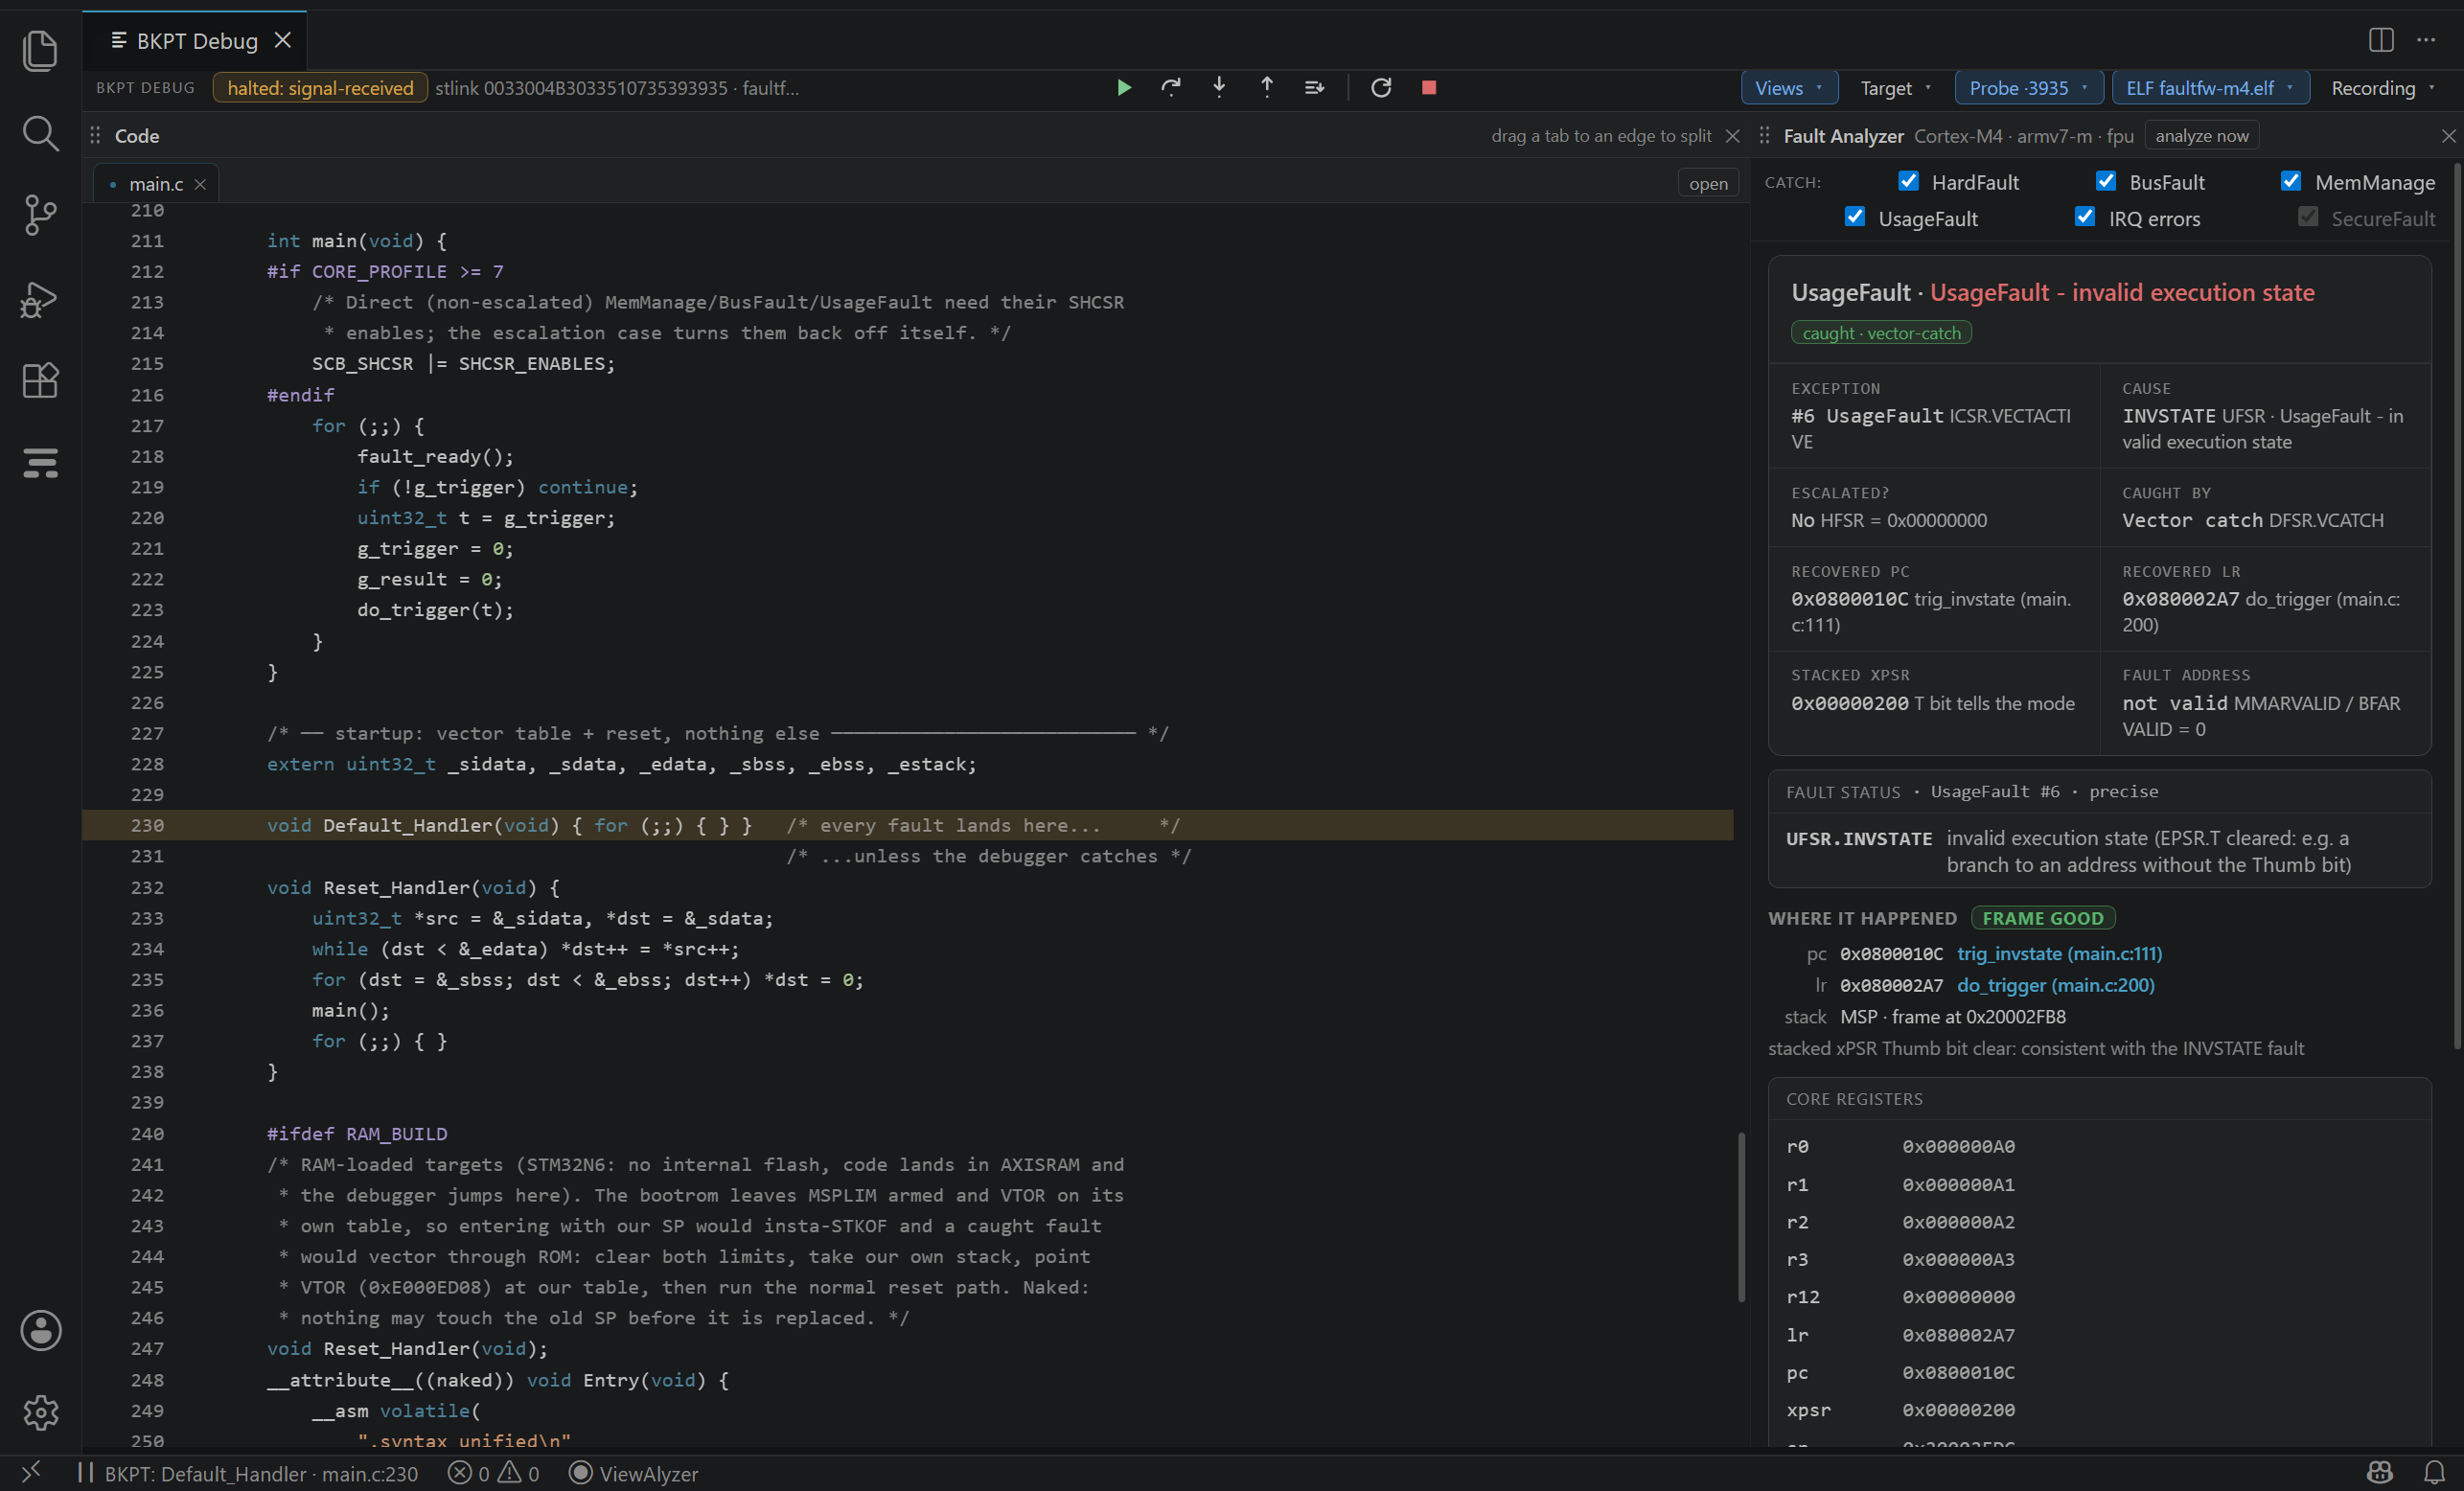
Run the firmware, hit a fault, read what happened. The debugger catches HardFault, BusFault, MemManage, UsageFault and friends at the exception itself, before any handler runs, and explains them: the root cause in one line, every set bit of the fault registers with its meaning, the faulting address when the core says it is valid, and the line of your code that did it. Your firmware needs no fault handler for this; a while (1) in HardFault_Handler is fine, the debugger stops the core before it gets there.
- How it catches
- Reading the tile
- Read the registers in this order
- Every register, every bit
- Escalation
- What each core has
- Analyze now
- Known limits
How it catches
The Cortex-M debug block can halt the core the instant a fault vector is taken (a "vector catch"). When a session starts, the debugger arms the classes you chose (bkptDebug.faultCatch, default all; the checkboxes in the tile edit it live) and disarms them when it detaches. A caught fault halts the target with the stack still intact, which is what makes the recovered frame trustworthy, and the tile opens itself once per fault.
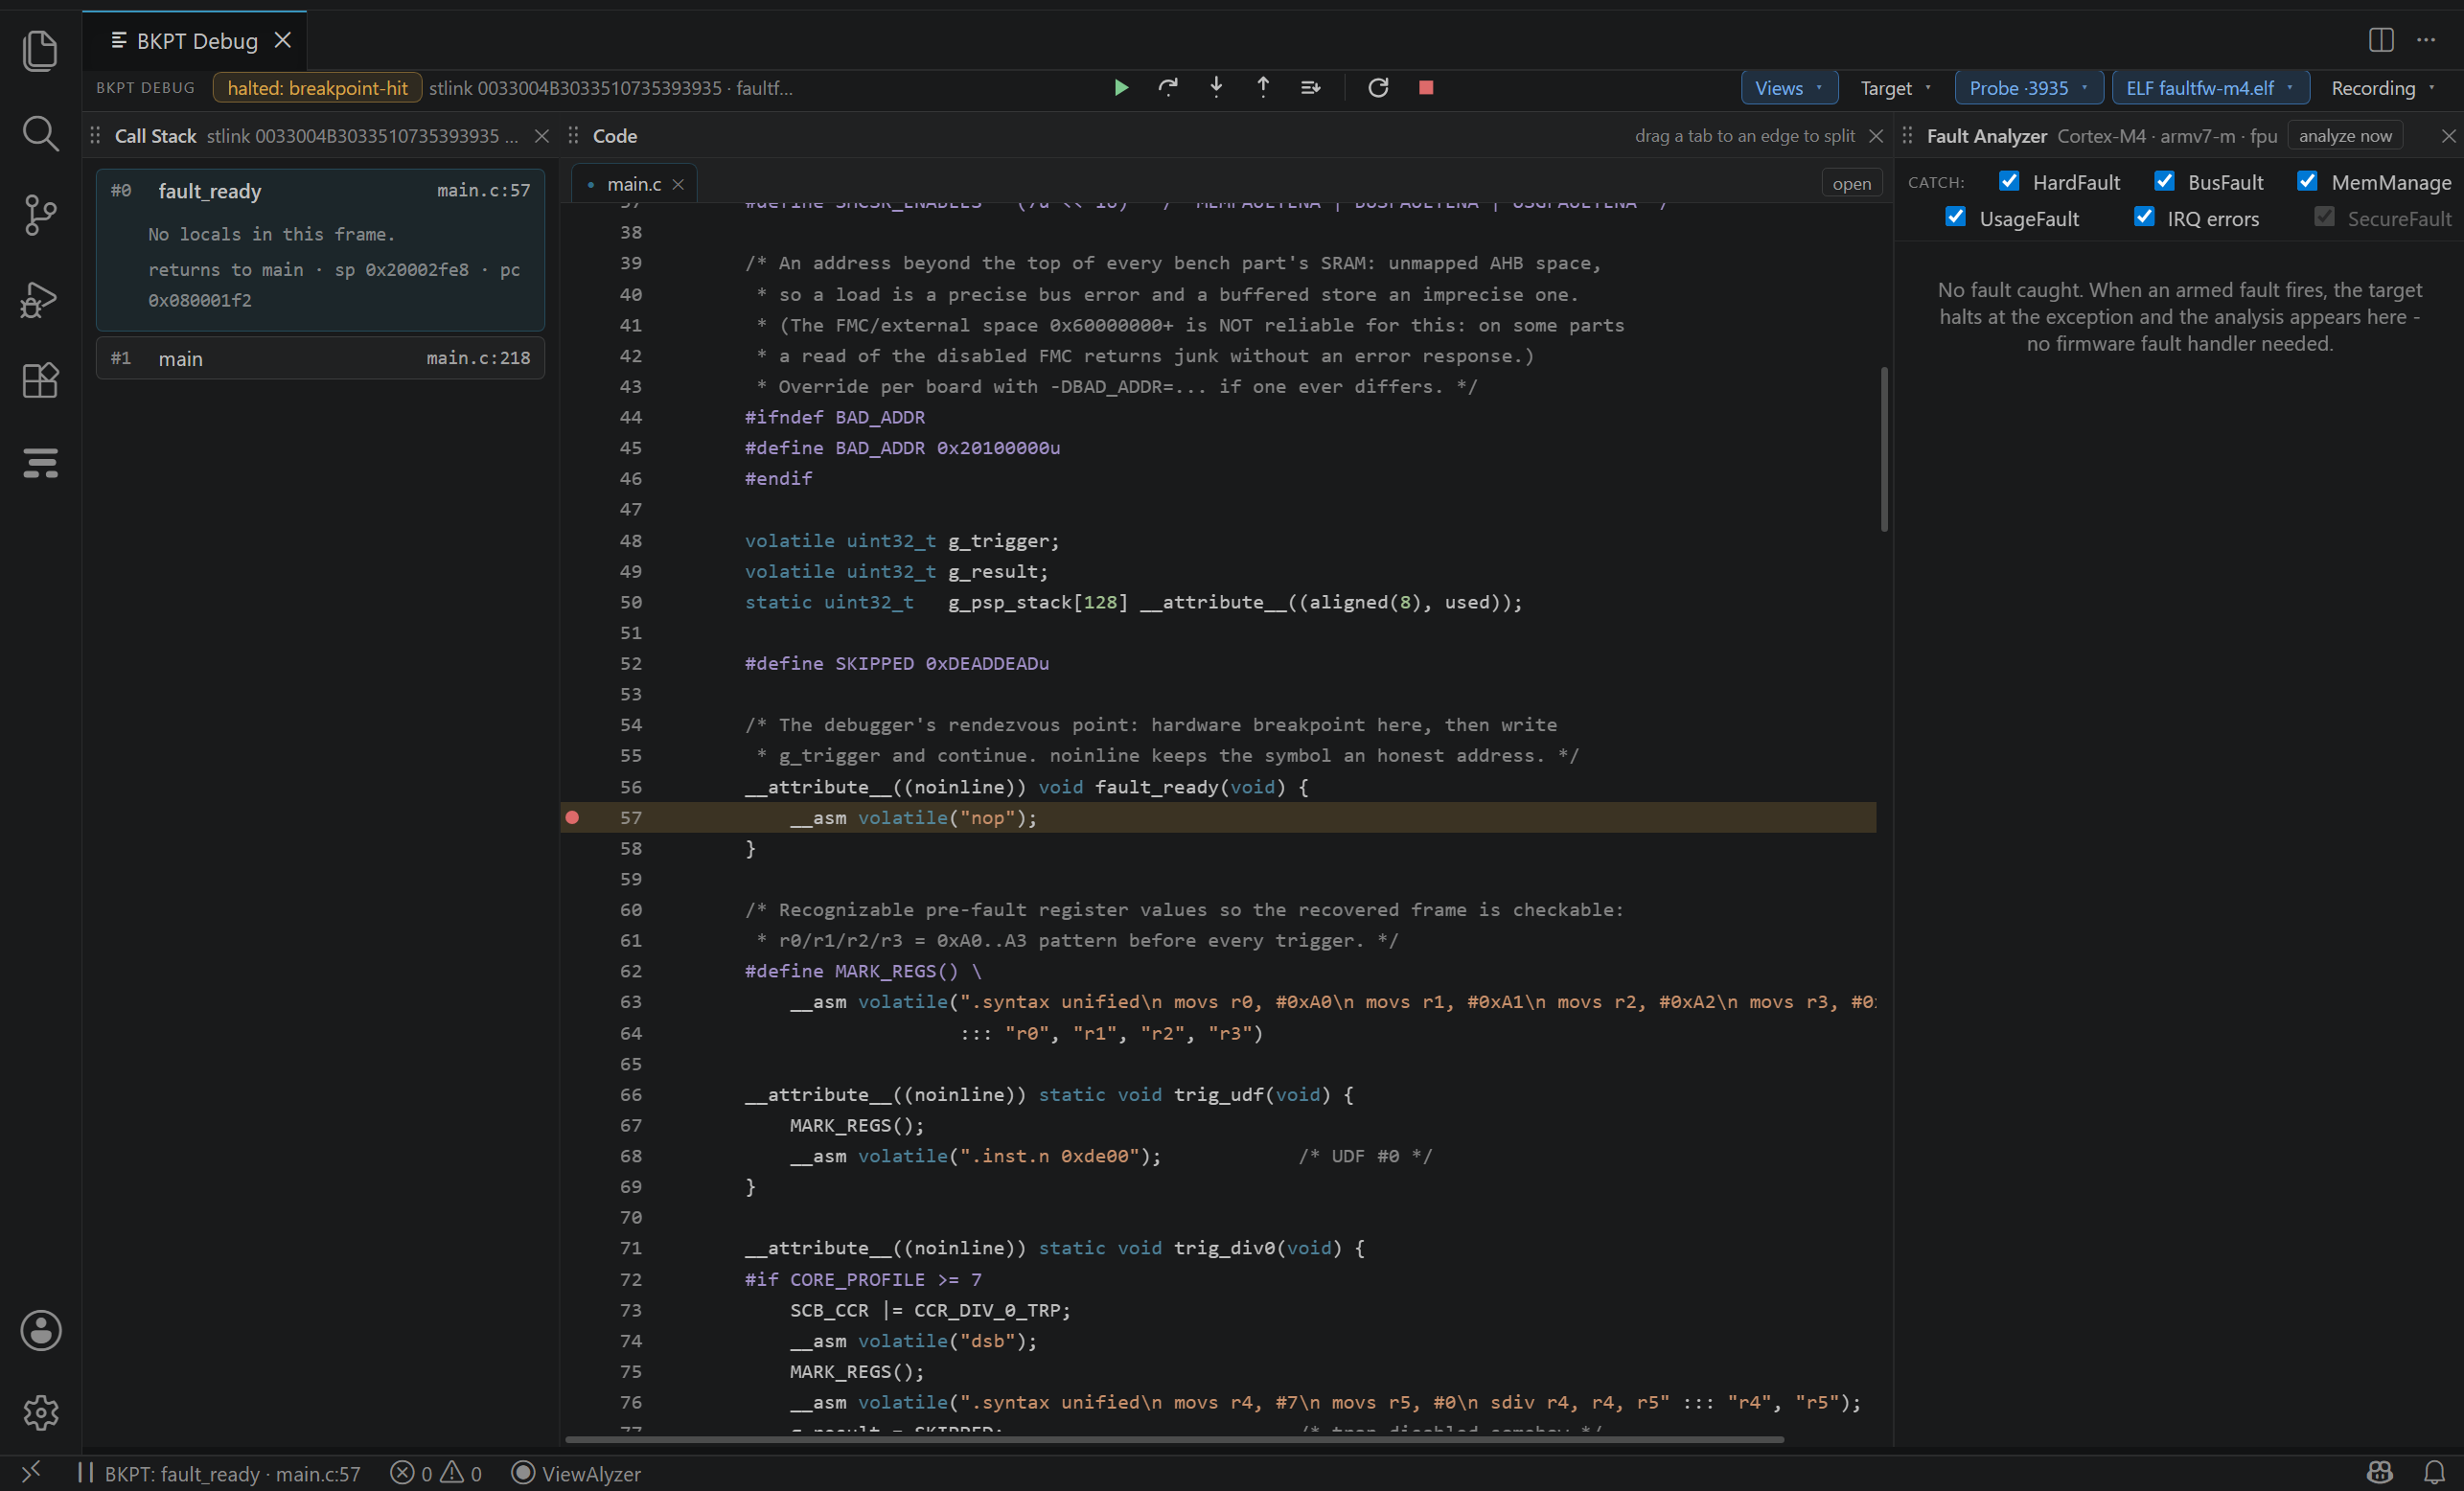
The classes, in the tile's header: HardFault (escalated faults, vector-table read errors), BusFault (precise and imprecise bus errors, stacking errors), MemManage (MPU violations, execute-never), UsageFault (undefined instruction, invalid state, divide by zero, unaligned access, stack overflow), IRQ errors (exception entry and return integrity) and SecureFault (Armv8-M with the Security Extension). A class the core does not have is greyed out with the reason.
Reading the tile
The summary card answers the fault in one line and eight facts:
| FACT | WHAT IT COMES FROM |
|---|---|
| Exception | The active exception number and name (#6 UsageFault) |
| Cause | The status bit that names it (INVSTATE) and the root-cause sentence |
| Escalated? | Whether a configurable fault was taken as a HardFault instead |
| Caught by | Vector catch (halted at the exception, frame intact) or At halt (analyzed after the fact) |
| Recovered PC | The instruction that faulted, resolved to function and line; click to open it |
| Recovered LR | Where it was called from, resolved the same way |
| Stacked xPSR | The program status the hardware pushed; its Thumb bit is the tell for an invalid-state fault |
| Fault address | MMFAR / BFAR, shown only when the core marked it valid, else not valid |
Below it: Fault status, the set bits with their meaning, each one clickable; Where it happened, the recovered pc and lr with a trust badge on the frame (good, suspect, none), the stack in use (MSP or PSP) and whether an FPU frame was pushed; Notes the analyzer adds when something needs saying (an imprecise bus error, a frame it could not trust); and two cards with the core registers of the faulting context and the raw architectural state.
Read the registers in this order
Faults do not have a single status word; the answer is spread over five registers, read in a fixed order. The tile does this for you; knowing the order tells you how much to trust each line.
| STEP | QUESTION | REGISTER |
|---|---|---|
| 1 | How was it caught? Halted at the fault, or noticed later? A stale report lies about "where". | DFSR |
| 2 | Which exception, and was it escalated? | ICSR, HFSR |
| 3 | What went wrong: bad access, undefined instruction, divide by zero? | CFSR |
| 4 | At what address? Only when the matching VALID bit is set. | MMFAR, BFAR |
| 5 | Where in my code? The stacked frame: pre-fault pc, lr, and the xPSR that proves the mode. | the stack |
Everything after step 3 is about where, not what.
Every register, every bit
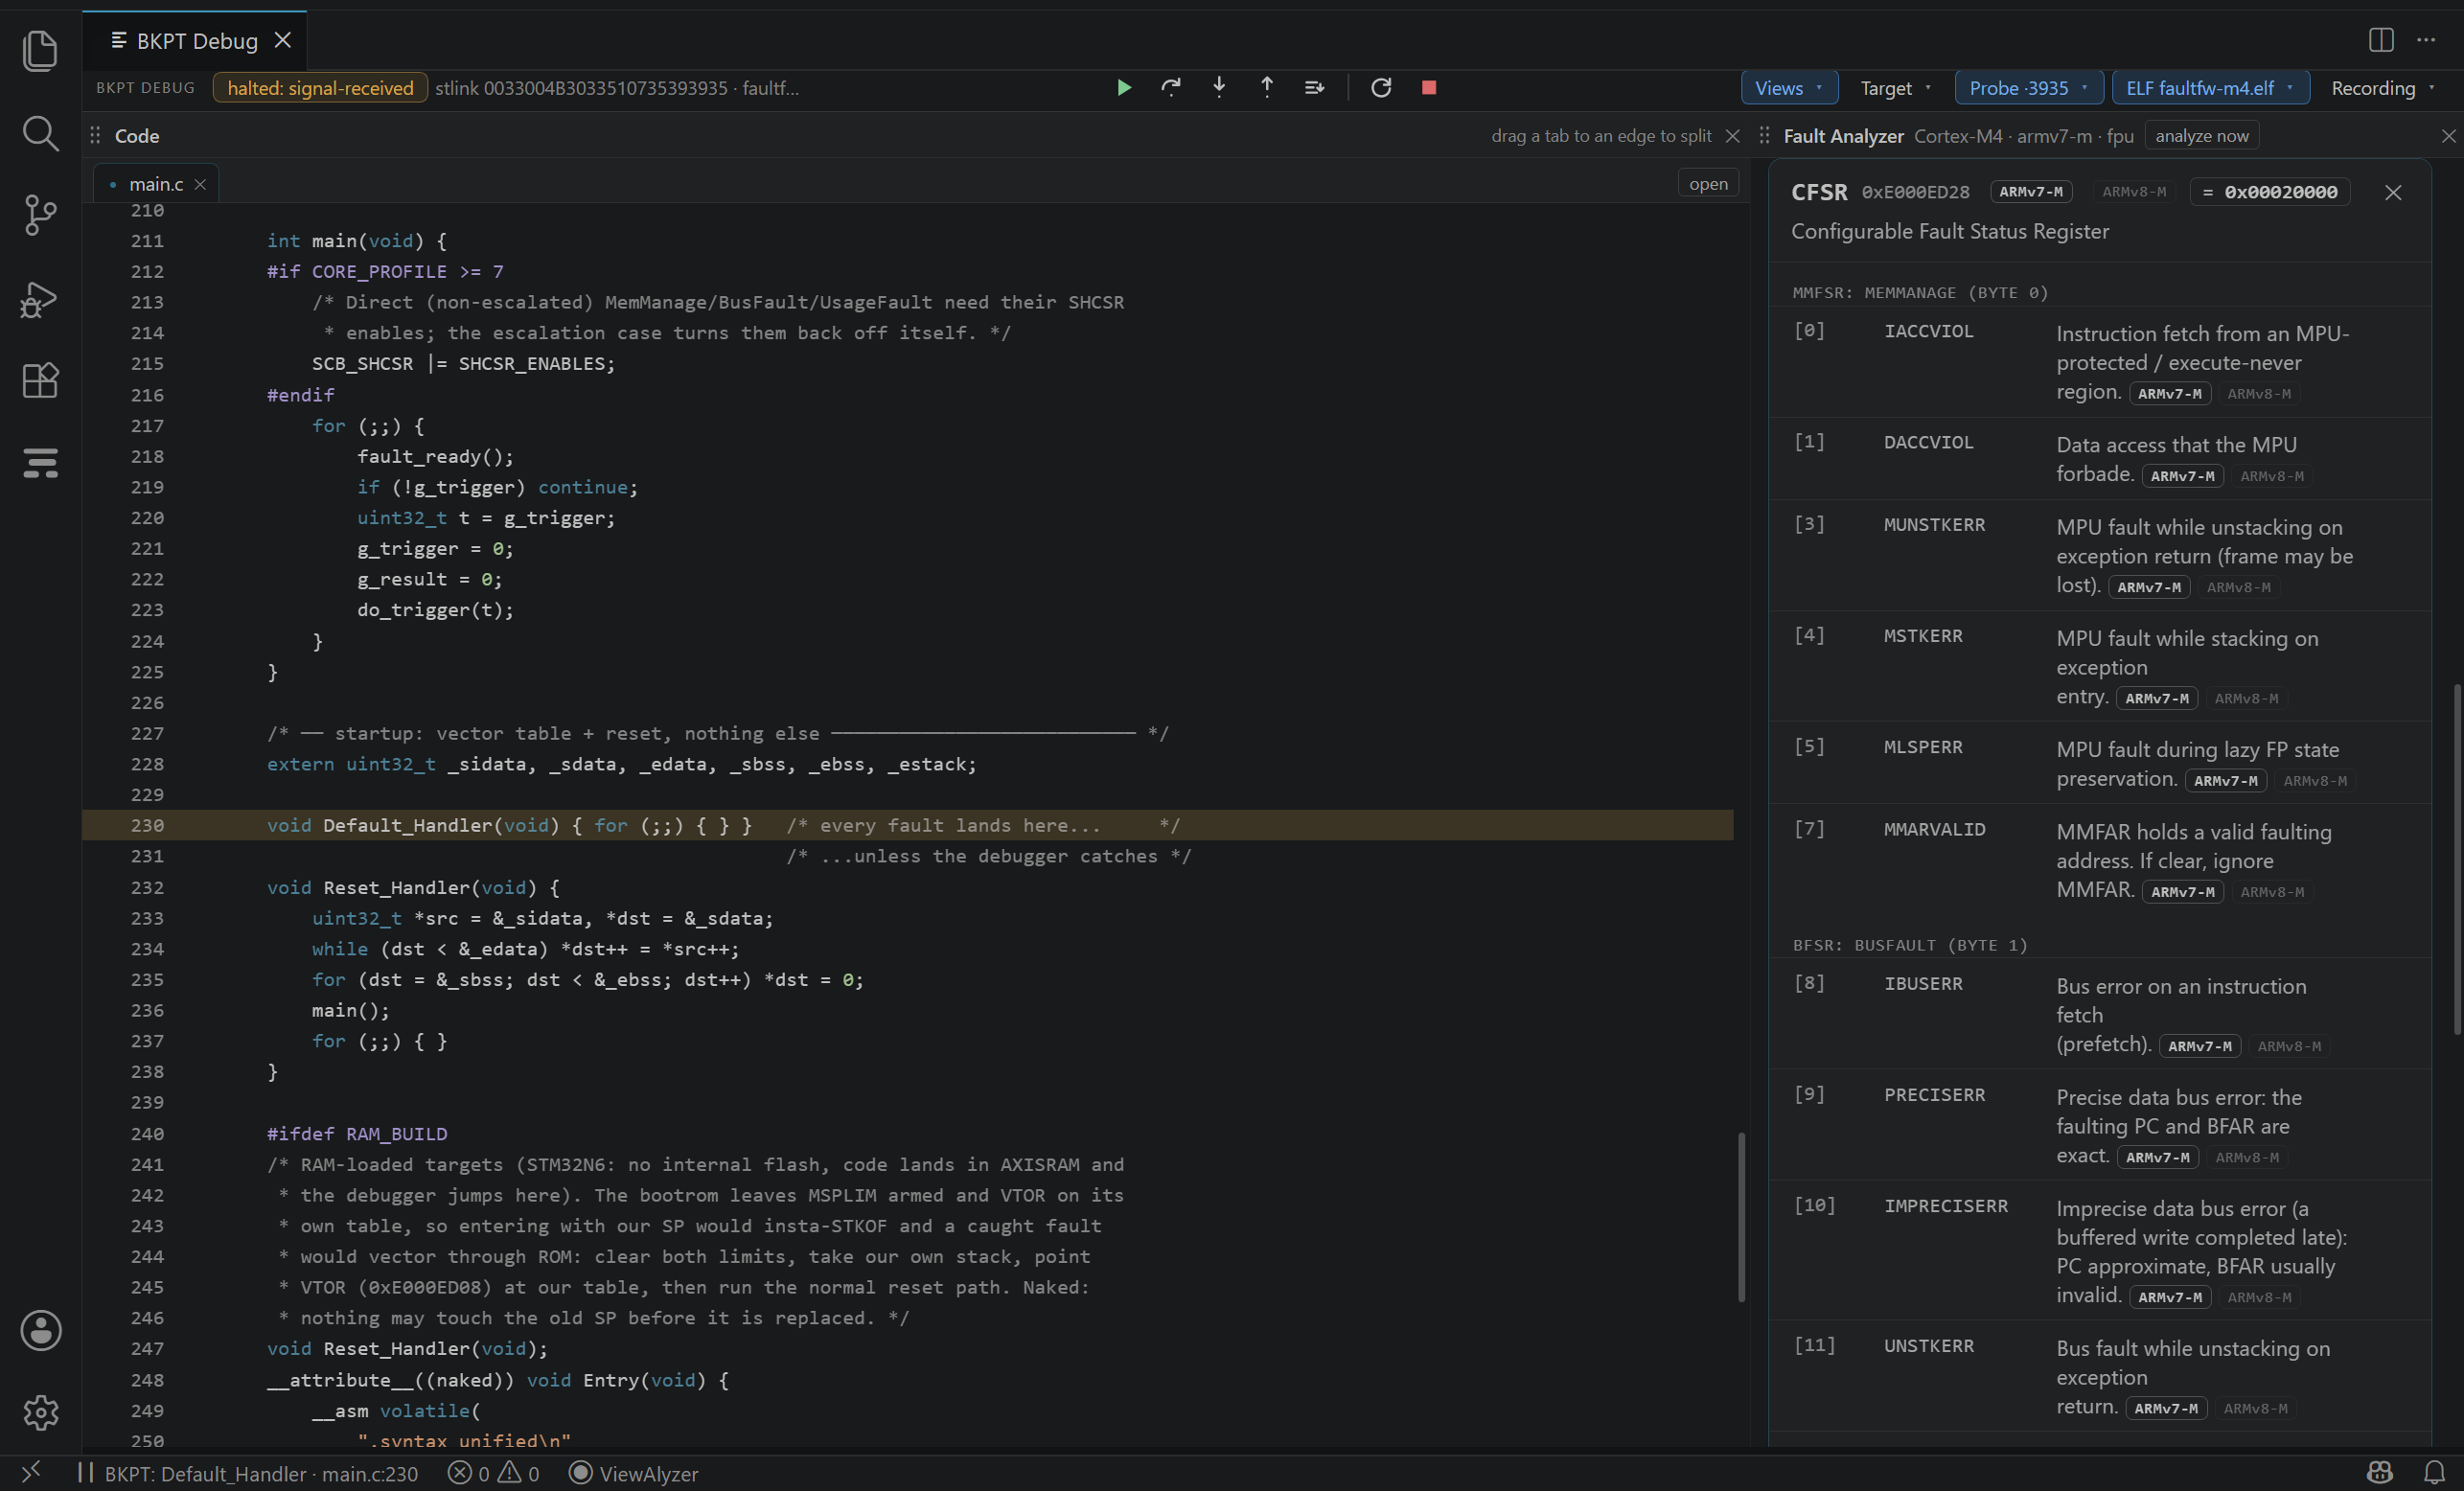
Click a status bit, or a register name, and the tile opens that register bit by bit: every field with its meaning, the bits this capture set highlighted, and a tag on each field saying which architecture has it (Armv6-M, Armv7-M, Armv8-M, FPU, Security), because the same tile runs against a Cortex-M0+ with almost none of these registers and a Cortex-M33 with a whole extra secure bank. The registers it decodes:
| REGISTER | WHAT IT TELLS YOU |
|---|---|
| ICSR | The exception whose handler is running (VECTACTIVE), and what is pending |
| SHCSR | Which configurable fault handlers are enabled; a clear ...ENA bit is why a fault escalated to HardFault |
| DEMCR | The debugger's vector-catch bits (how the target was stopped) and TRCENA |
| DFSR | Why the core entered debug halt: VCATCH means a live catch |
| CFSR | The one that matters: MMFSR (MemManage), BFSR (BusFault) and UFSR (UsageFault) stacked in one word, sticky bits |
| HFSR | Why a HardFault was taken; FORCED says "a configurable fault escalated, read CFSR" |
| MMFAR / BFAR | The faulting data address, valid only with MMARVALID / BFARVALID; an imprecise bus error leaves it invalid by nature |
| AFSR | Vendor-defined auxiliary bits, zero on most STM32 |
| FPCCR | The FPU context state (lazy stacking, which handlers are ready), on cores with an FPU |
| SFSR / SFAR | Security-boundary violations, Armv8-M with the Security Extension |
| xPSR (stacked) | The pushed program status; the Thumb bit must be 1, a 0 is exactly an INVSTATE fault |
| EXC_RETURN | The magic lr on entry: which stack the frame is on, thread or handler mode, whether FP registers were pushed |
Escalation
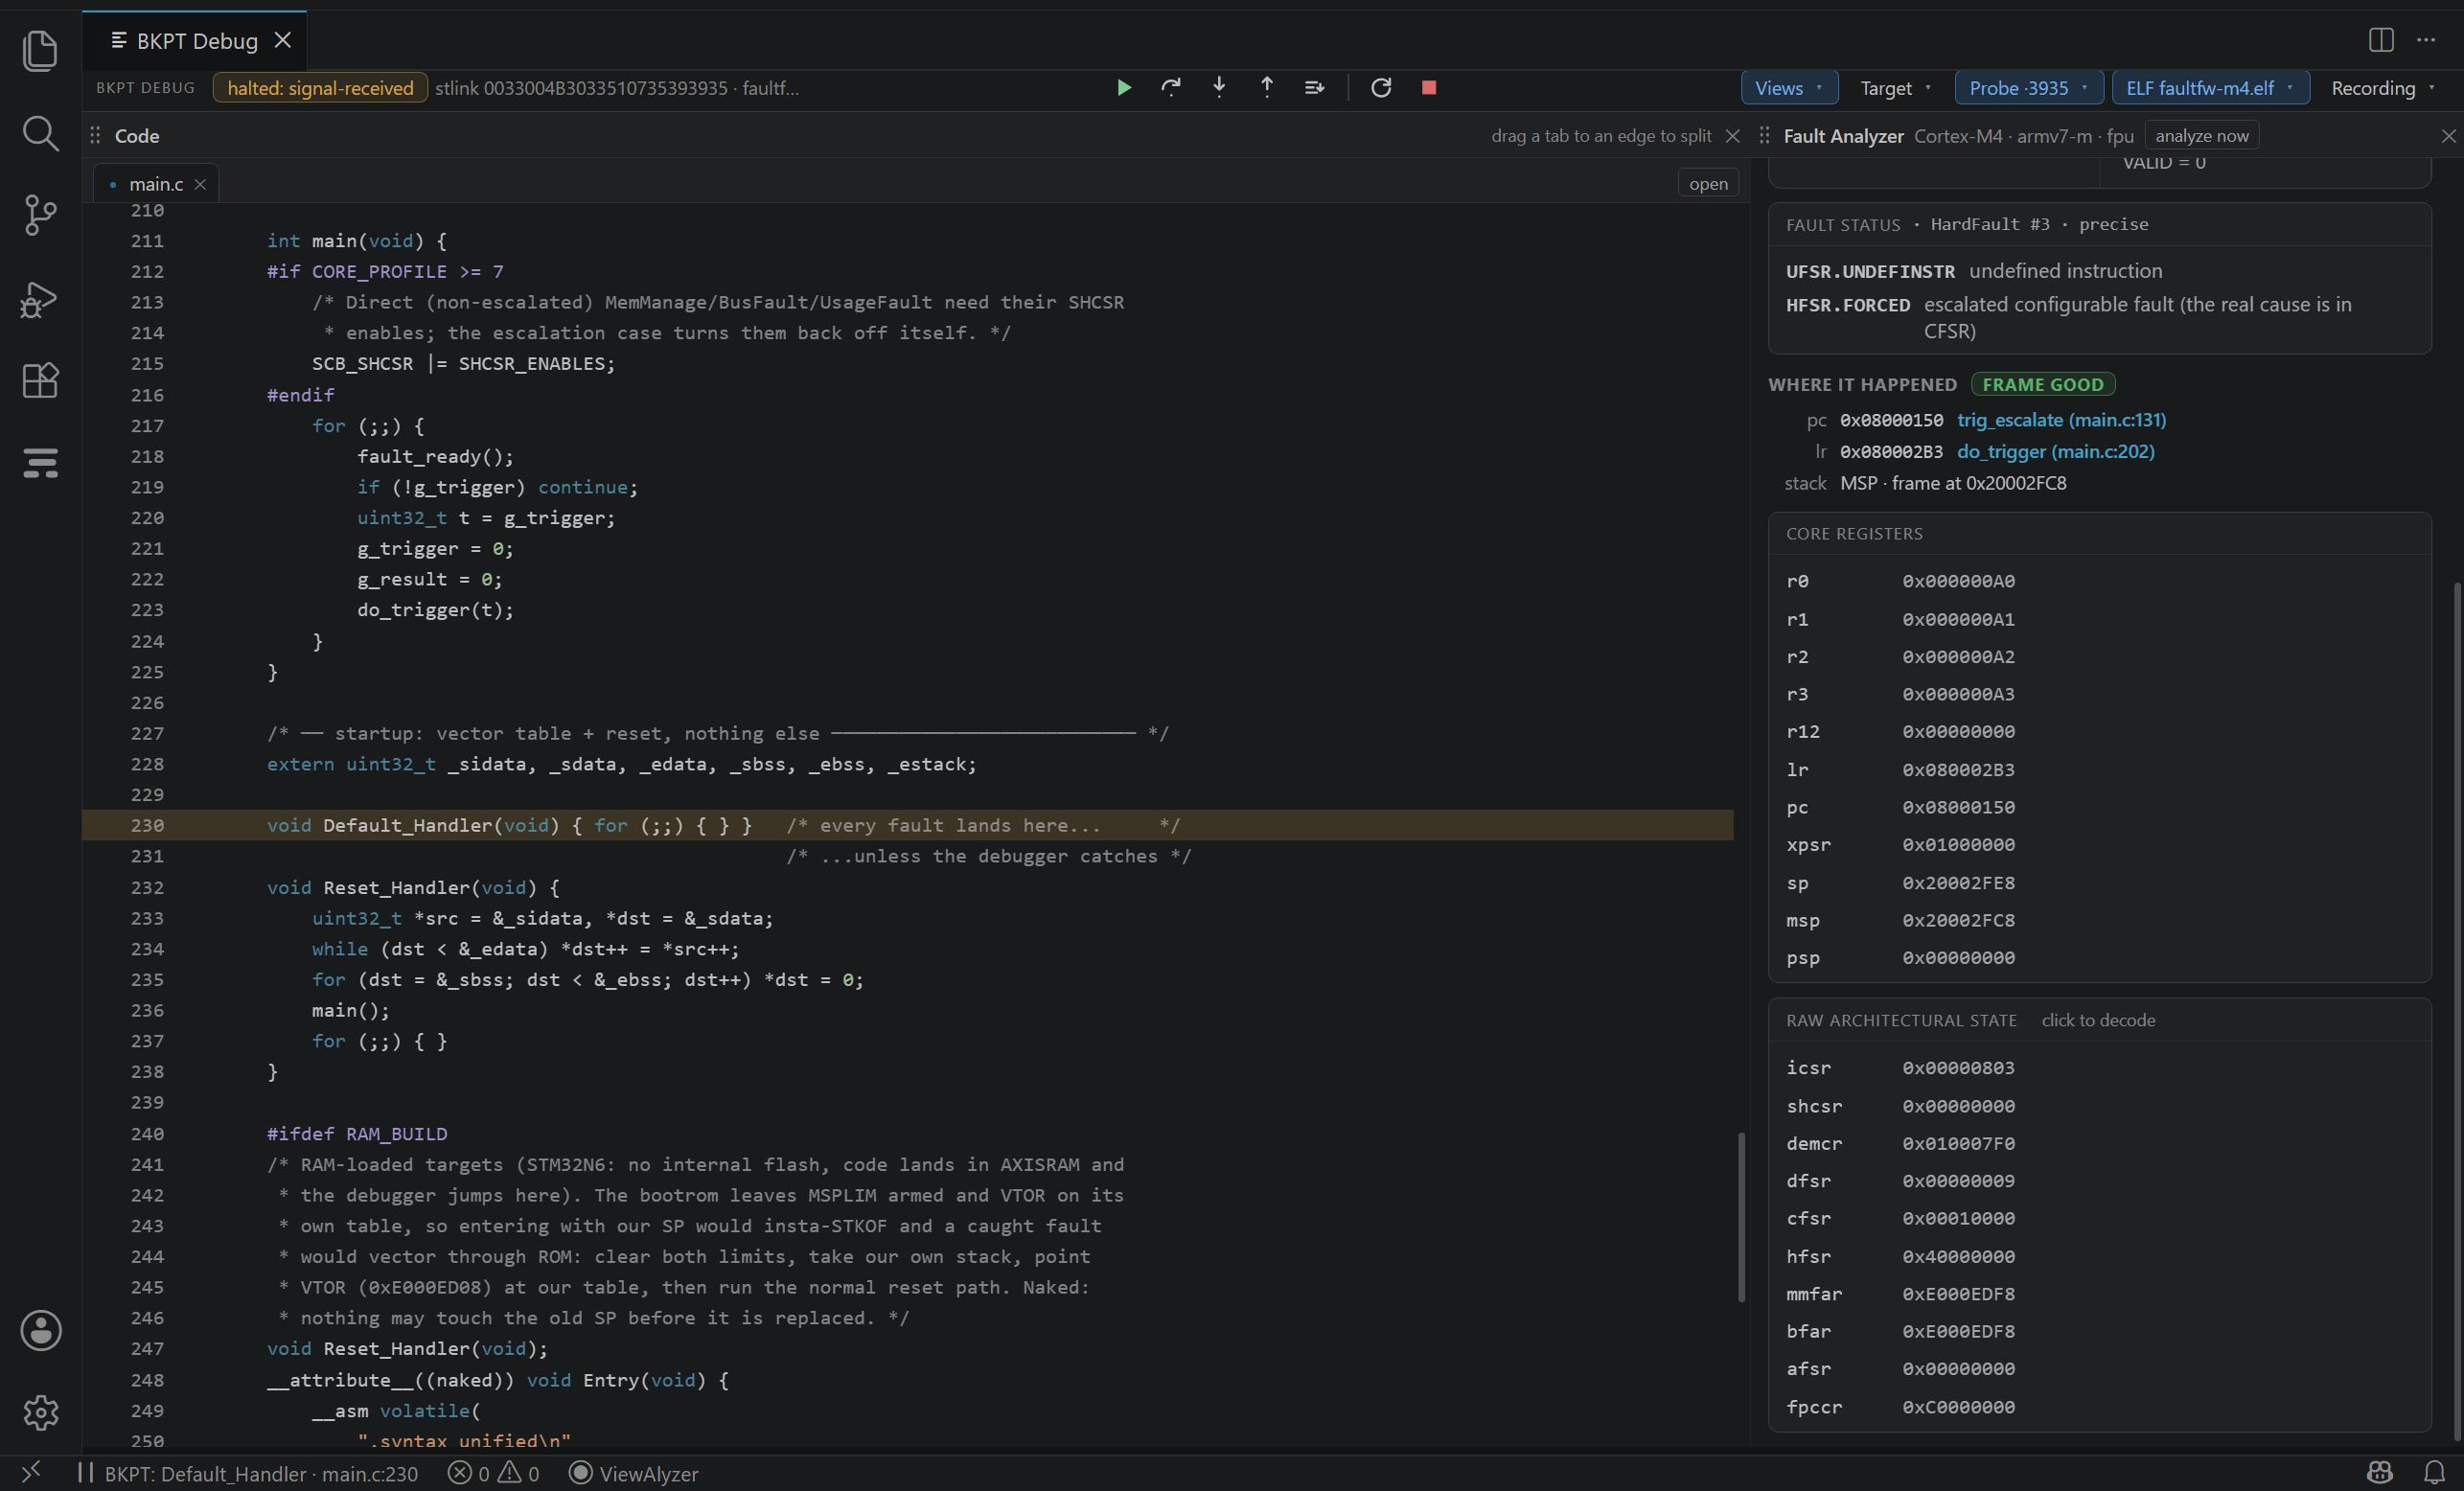
A fault whose handler is disabled in SHCSR (or masked by priority) escalates to HardFault. HFSR.FORCED records that, and the original cause is still in CFSR, so the tile reports the HardFault with its real cause and the Escalated? fact set. Firmware that never enables the configurable fault handlers sees every fault as a HardFault; the tile still tells you which one it was.
What each core has
| ARCHITECTURE | CORES | WHAT THE ANALYZER CAN READ |
|---|---|---|
| Armv6-M | Cortex-M0, M0+, M1 | HardFault only, no CFSR, HFSR or fault-address registers. The report leans on the recovered pc / lr and the stacked xPSR. Vector catch for HardFault and reset only. |
| Armv7-M | Cortex-M3, M4, M7 | Everything above; the FPU registers on M4F / M7. |
| Armv8-M | Cortex-M23, M33, M55, M85 | Everything, plus stack-limit overflow (STKOF) and, with the Security Extension, SecureFault with its own address register. |
The tile knows which it is talking to (the core and profile show in its header) and greys out what the core lacks, with the reason.
Analyze now
Analyze now in the tile's header runs the same analysis on any halted target: a firmware that faulted into its own handler before you attached, a fault you did not catch because its class was off. The report is marked At halt rather than Vector catch: the status registers still say what happened, but the frame and the "where" may be stale if the handler ran. A report goes stale when the target runs again after it.
Known limits
- Catching needs a session started or attached by BKPT Debug; a fault that happened before that is a job for Analyze now.
- An imprecise bus error (a buffered write that faulted late) has no exact
pc; the tile says so and shows the approximate one. - Armv8.1-M and Security-Extension cases are decoded from the architecture manuals but have had less bench time than the Armv6-M / Armv7-M cores.