 DOCS/BKPT DEBUG/VARIABLES AND EXPRESSIONS
BKPT DEBUG · VS CODE
DOCS/BKPT DEBUG/VARIABLES AND EXPRESSIONS
BKPT DEBUG · VS CODE
Variables and expressions
Use Call Stack → Variables to answer “what does this code see at this stop?” Locals, arguments, globals, structures, and saved expressions all use the selected frame. For values that update while the firmware runs, use Symbols and Traces.
Needs: an active, halted debug session and an ELF containing debug information. Build with -g; a debug-friendly optimization level such as -Og usually makes stepping and variables easier to follow.
Inspect your first value
- Pause or hit a breakpoint inside a function you want to inspect.
- Open Views → Call Stack. Select frame #0, the current function.
- In Variables, choose Locals / Args. Arguments carry an arg label; the type sits beside the name.
- Click a value or Inspect to read it. Use the small triangle to expand a structure, union, array, or readable pointer.
- Step once. Values now belong to the new stop. Select a caller frame to inspect that caller's scope instead.
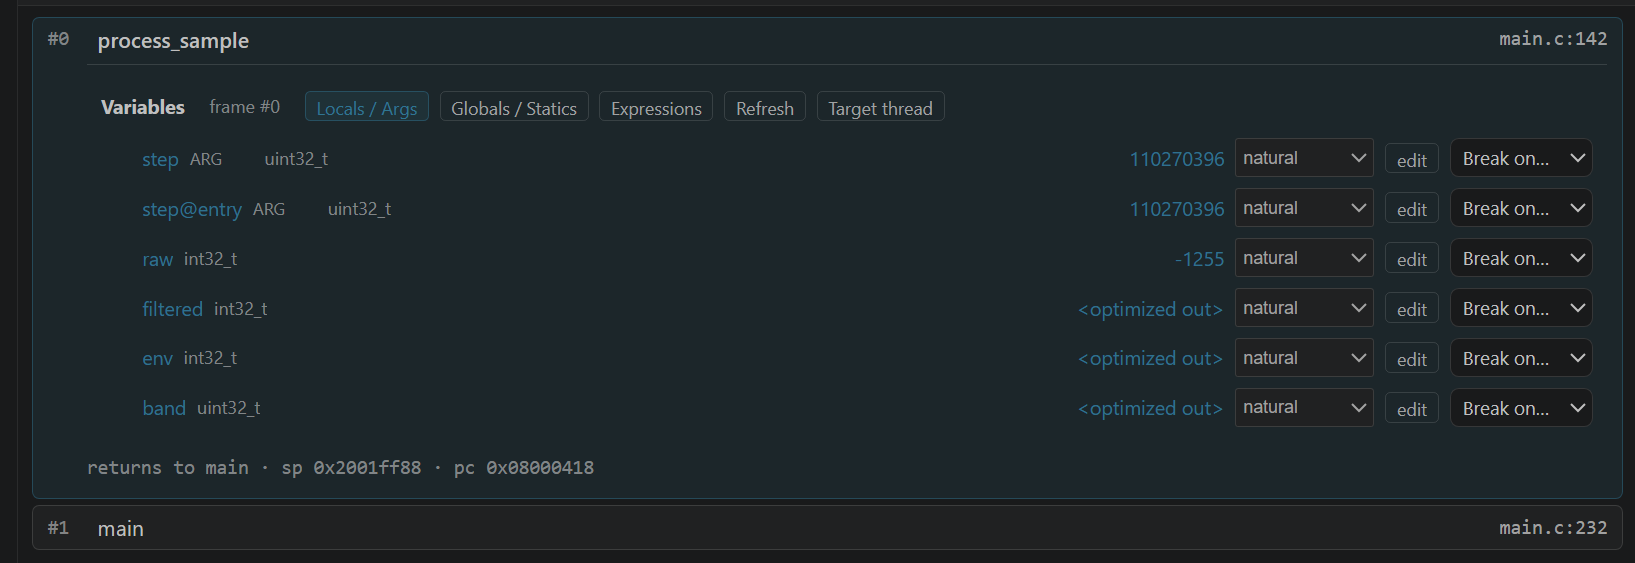
Check: the Variables header names the selected frame. A local named step in one function is not necessarily the same variable as step in its caller. Resume disables halted-value inspection; a displayed old value is not a live measurement.
The three tabs
| TAB | HOW TO USE IT | WHAT PERSISTS |
|---|---|---|
| Locals / Args | Select a frame to see its local variables and function arguments | The values belong to this stop and frame |
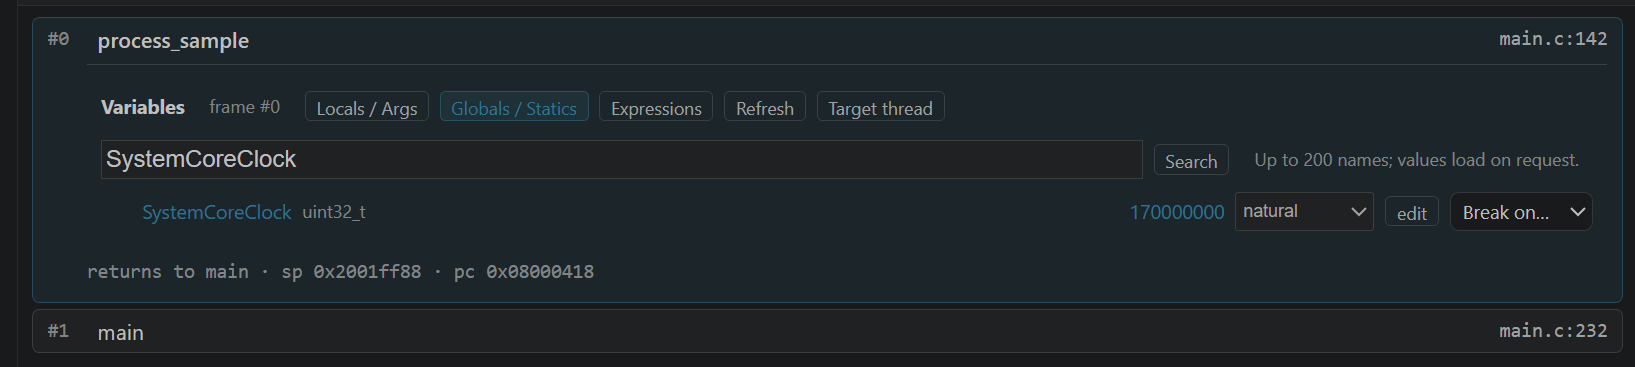
| Globals / Statics | Enter a name filter and press Search; click Inspect on a result to read its value | Names are cached during the session; values are read on demand |
| Expressions | Enter a read-only expression, press Add, then choose its display format | Expressions and formats are saved in the workspace as bkptDebug.expressionWatches |
Globals searches return up to 200 names at once. Narrow the filter when a name is absent from a broad search. File-local statics can be qualified by their source file so two files' counter variables remain distinct.
Follow structures, arrays, and pointers
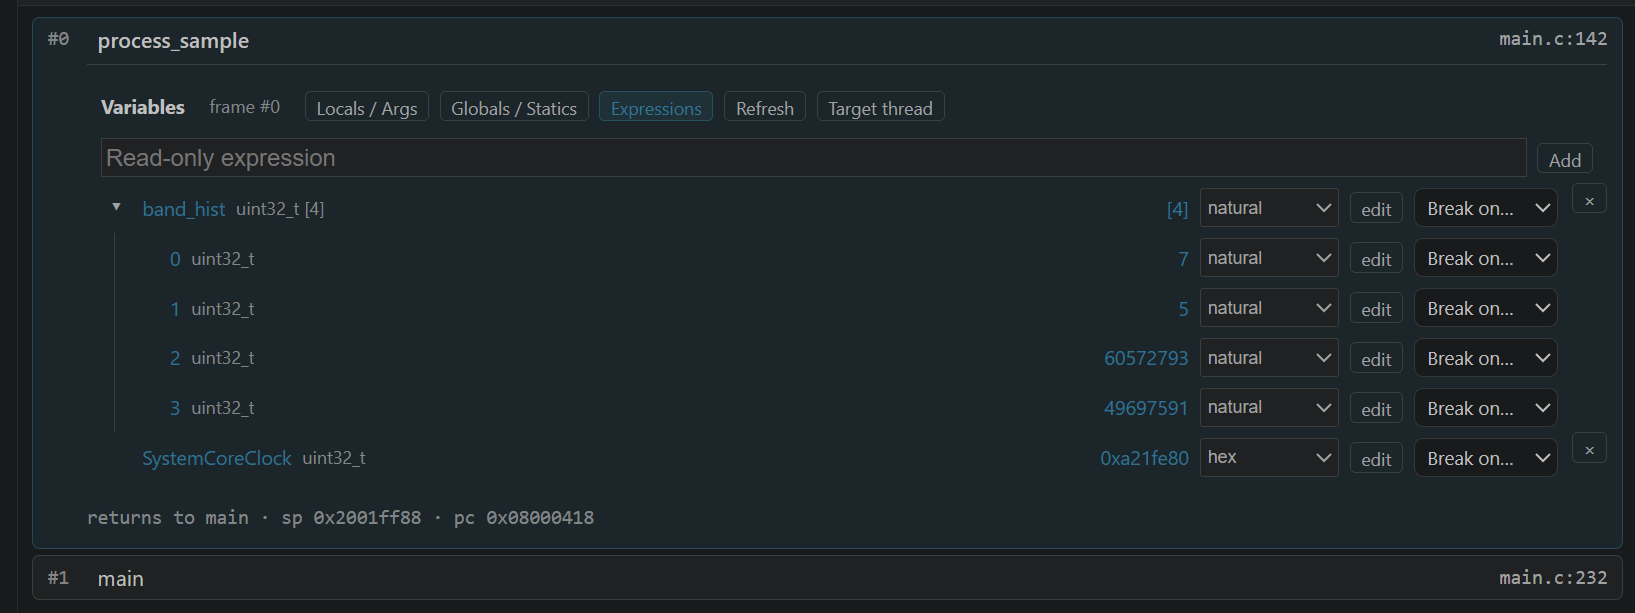
Expand only the part you need. Children load in groups of 32; Load next 32 requests the next group. Expansion stops after eight levels and the inspection has a bounded node budget. Use Refresh to start a fresh inspection if you reach the limit.
A null pointer, a pointer cycle, or an unreadable address has a reason in the row or hover. Peripheral addresses are excluded from pointer expansion; use Peripheral Registers, where SVD read semantics are available. These guards do not make an arbitrary typed memory expression safe: avoid reading device registers through expressions just to bypass a blocked SVD action.
For arrays, an explicit expression such as samples[40] is useful when you know the element you want. For a union, the debugger shows overlapping members; it cannot tell which member your firmware currently considers valid.
Add expressions
Expressions can refer to locals in the selected frame, globals, members, array elements, and registers. Examples for firmware that defines these names:
| EXPRESSION | MEANING |
|---|---|
SystemCoreClock | Read the firmware's reported core clock |
samples[3] | Read one array element |
sensor.temperature | Read a structure member |
packet->length | Follow a pointer and read one member |
counter + 1 | Calculate a value without changing counter |
$sp | Read the stack pointer in the selected GDB context |
There are up to 32 saved expressions. × removes one. A local expression can become unavailable after returning from its function; its saved definition remains so it can work again at the next appropriate stop.
Assignments, increment/decrement, and target function calls are refused in inspection expressions. Once inspection is used, BKPT also tells GDB not to call target functions, including implicit C++ operator calls. An expression that needs such a call reports a refusal instead of running firmware while you are trying to inspect it.
Every display format
The format dropdown changes how a value is displayed; it does not change the variable's type or stored bytes.
| FORMAT | USE IT FOR |
|---|---|
| natural | GDB's normal representation for the declared type |
| hex | Addresses, bit masks, and register-like values |
| decimal | Base-10 integers, preserving the declared signedness |
| binary | Inspecting individual bits of an integer |
| signed | Interpreting an integer as signed at its declared width |
| float | Converting a numeric value to floating-point display; this does not reinterpret integer bits as an IEEE float |
| string | Reading a character array or character pointer as text, bounded to 128 bytes and to a known array's length |
For example, an unsigned 32-bit 0xffffffff displays as 4294967295 in decimal and -1 in signed format. A format that does not apply to the selected value reports an error. A long or unterminated string is a bounded preview, not proof that the buffer ends there.
Hover and edit
While halted, hold the pointer over a variable in Code for a brief moment. The popup shows its type and value in the selected frame. Clicking a variable name or using its context action also opens inspection. Composite previews are limited; use the Variables tree for deeper exploration.
To change a scalar, choose edit, enter a numeric, boolean, or character literal, and choose Set…. Review the confirmation and accept Set value. Cancelling leaves the target unchanged. Accepted edits refresh the halted state. Examples include 42, 0x20, -1, true, and 'A'; function calls and assignment expressions are not edit values.
Warning: editing memory changes the running program's future behavior. Use a disposable test state or record the original value. A changed frame, resumed target, or replacement session cancels an outstanding confirmation.
The Registers tile also supports confirmed edits: click a register name to open its inspect/edit popup. Select frame #0 before changing a physical register. A caller's unwound registers describe that caller's context, not a separate hardware register bank. Changing PC has the same consequences as Set next.
The Break on… dropdown next to a value creates a hardware data watchpoint. Its write, read, and read / write choices stop on accesses; they do not change the value or select a format.
Refresh, threads, and missing values
Refresh rereads the current inspection while halted. Target thread asks GDB for its threads and offers a selector when entries are returned. Changing it changes the frame and expression scope together. With the bundled single-core server, a single target thread is normal. This is not an RTOS task browser or a saved-task stack unwinder.
| WHAT YOU SEE | WHAT TO DO |
|---|---|
<optimized out> | The compiler did not preserve a recoverable value here. Try another source location or a less optimized build. A register-held variable can still be available. |
| No locals available in this frame | Select a function with locals and matching debug information; instruction-only or stripped code may have none. |
| No matching debug symbols | Refine the globals filter, check the ELF, and include DWARF information in the build. |
| Null pointer or Pointer cycle | Inspect the pointer value and the surrounding object; do not keep expanding the same address. |
| Inspection context changed or stale value | Wait for a stable halt, select the desired frame, and refresh. |
| Cannot edit / read-only | Select a writable scalar or member; whole structures and arrays are not assigned as a block here. |
Closed Variables views issue no inspection reads. Hidden layouts pause this presentation work; opening a tree requests its children only when needed.