 DOCS/BKPT DEBUG/PERIPHERAL REGISTERS
BKPT DEBUG · VS CODE
DOCS/BKPT DEBUG/PERIPHERAL REGISTERS
BKPT DEBUG · VS CODE
Peripheral registers
The Peripheral Registers tile is the SVD-backed view of memory-mapped device registers. It is separate from Registers, which shows the Cortex-M core register bank. Open the MCU's CMSIS-SVD once; BKPT saves its path and all row actions in the workspace, then reloads them when that project opens.
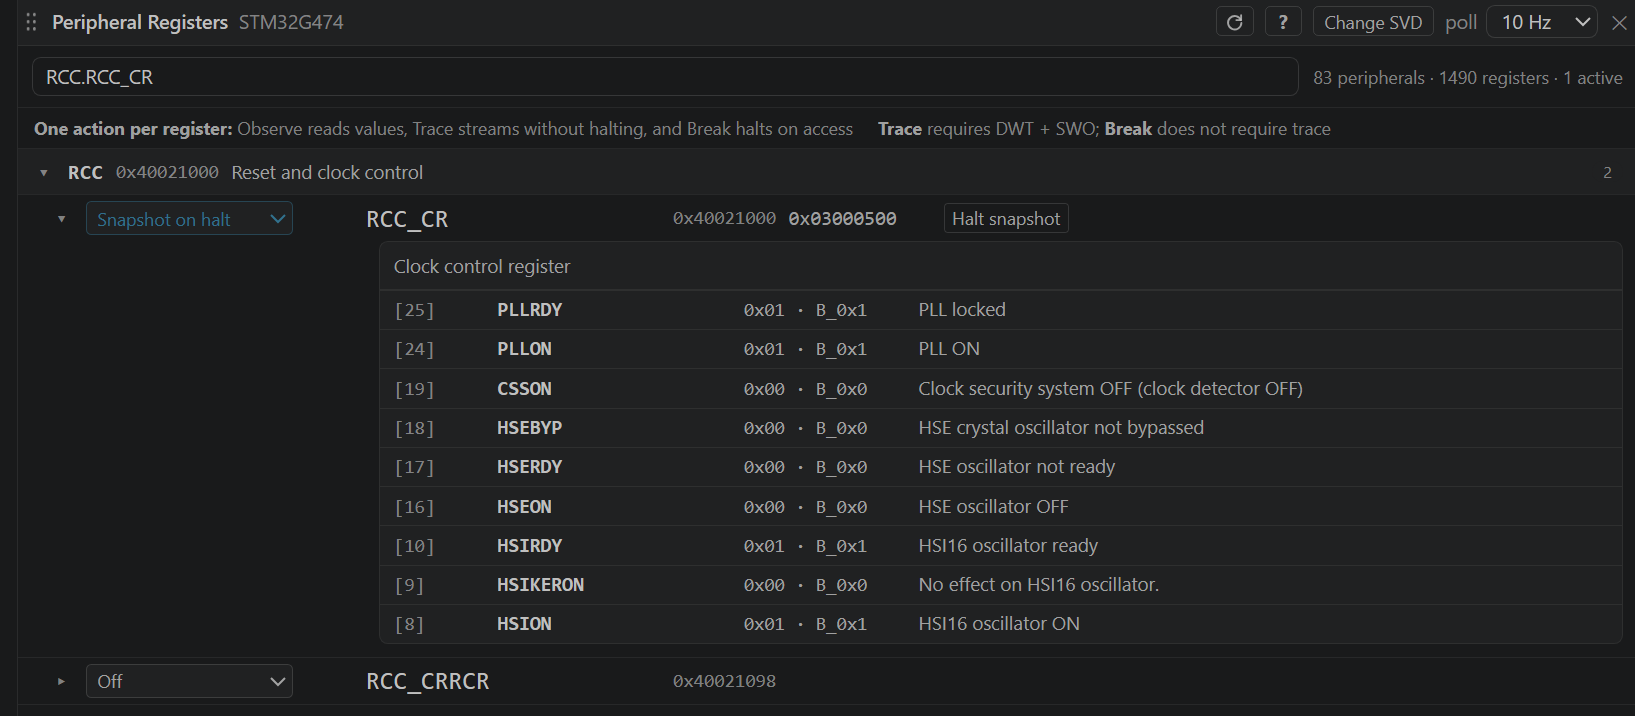
Use the filter with a peripheral, register, field, or full path such as RCC.CR. Expand a register to see its named fields, bit ranges, decoded values, enumerations, and descriptions from the SVD.
Register names come from the SVD. For example, the G474 vendor file calls the clock register RCC.RCC_CR, while another device's SVD may call it RCC.CR. Search a shorter name such as RCC if copying a path from a different device finds no rows.
Open an SVD
Choose Open SVD in the tile title bar and select the file for the exact device. The title shows the parsed device name, and the browser reports the number of peripherals and registers it loaded. Change SVD replaces the selection; the refresh button reparses the same file from disk.
The path is saved as bkptDebug.svd. A file inside the project is stored as a workspace-relative path; an installed vendor file can remain absolute. The poll rate and row actions are saved in bkptDebug.peripheralRegisters, while halt-on-access actions use the project's bkptDebug.dataWatchpoints list.
One action per register
Every row has one action selector. Picking a new action replaces the old one, so polling, streaming, and halting cannot silently compete for the same register.
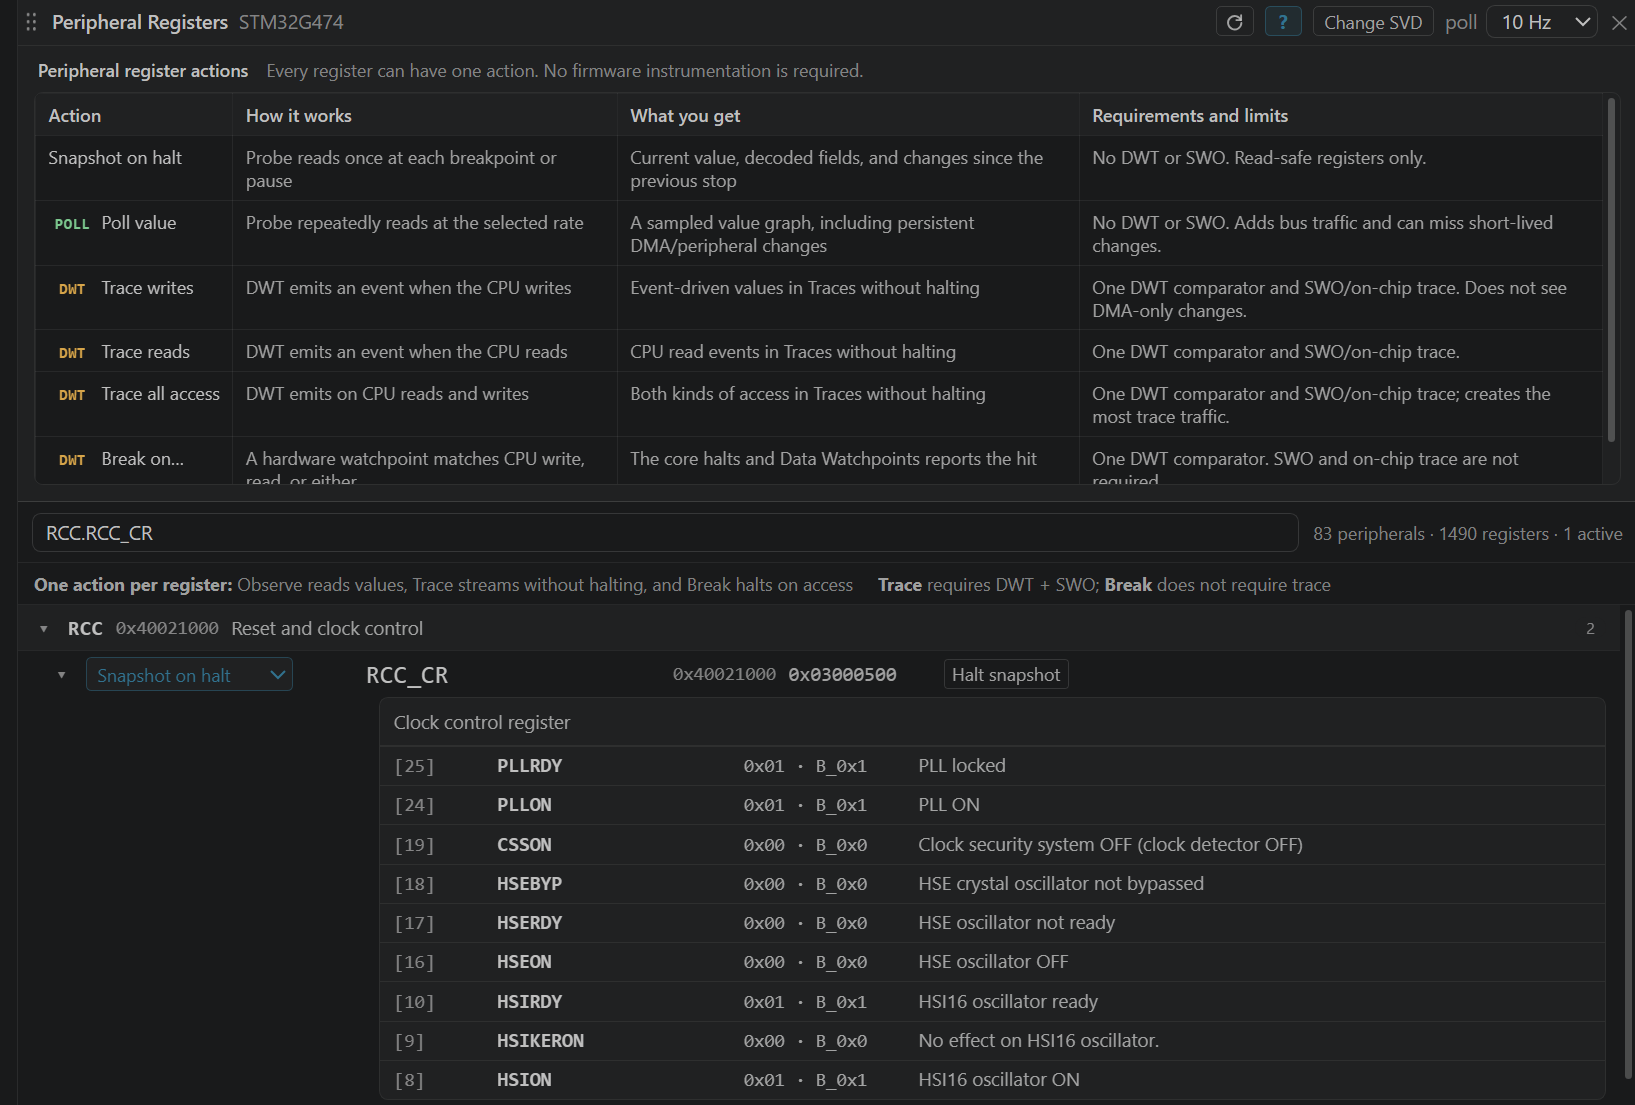
| ACTION | RESULT | HARDWARE AND BEHAVIOR |
|---|---|---|
| Snapshot on halt | Value and decoded fields in this tile; changes since the previous genuine stop are highlighted | One probe read at each breakpoint or pause. No DWT or SWO. Available only for registers the SVD marks safe to read. |
| Poll → Traces | A sampled register track and bit view in Traces | Repeated probe reads at the title-bar rate. No DWT or SWO; sees persistent changes made by the CPU, DMA, or the peripheral itself, but can miss short events. |
| Trace writes / reads / all access | Event-driven values in Traces without stopping the core | One DWT comparator and the on-chip SWO path. It observes CPU accesses only, not DMA. All access produces the most traffic. |
| Break on write / read / access | The core halts and Data Watchpoints names the SVD register and access that hit | One DWT comparator. SWO and On-chip trace are not required. |
| Off | No reads, trace, or halt watch for this row | Releases the row's acquisition intent and any live comparator it owned. |
The small POLL and DWT labels identify the mechanism. The neutral Halt snapshot, Probe sampled, and Hardware event badges explain the producer; hover them for timing, intervals, and reported loss. The ? button keeps the action comparison beside the controls. See data sources for the complete badge legend.
Snapshot and field changes
Snapshot mode reads only at a real stop. Repainting the panel or expanding a row does not create a new baseline. On the first stop BKPT shows the value without a false change; on the next breakpoint or pause it highlights both the register and the named fields whose values changed.
BKPT does not poll read-to-clear, write-only, or otherwise unsafe registers. The SVD access metadata explains why an Observe action is unavailable. DWT trace and break actions monitor the CPU bus access without performing a probe read, so they remain available where the target supports that access type.
An unavailable action has a specific explanation beside the control or in its hover. This includes inherited register/cluster access properties and read actions that clear, set, or otherwise modify bits. A register marked write-only or write-once is not an ordinary safe polling source. SVD files can be incomplete: consult the device reference manual for undocumented side effects rather than interpreting a missing warning as a guarantee.
This view does not yet provide general peripheral register/field writes. Expanding a field decodes it; it is not a bit-edit operation.
Poll into Traces
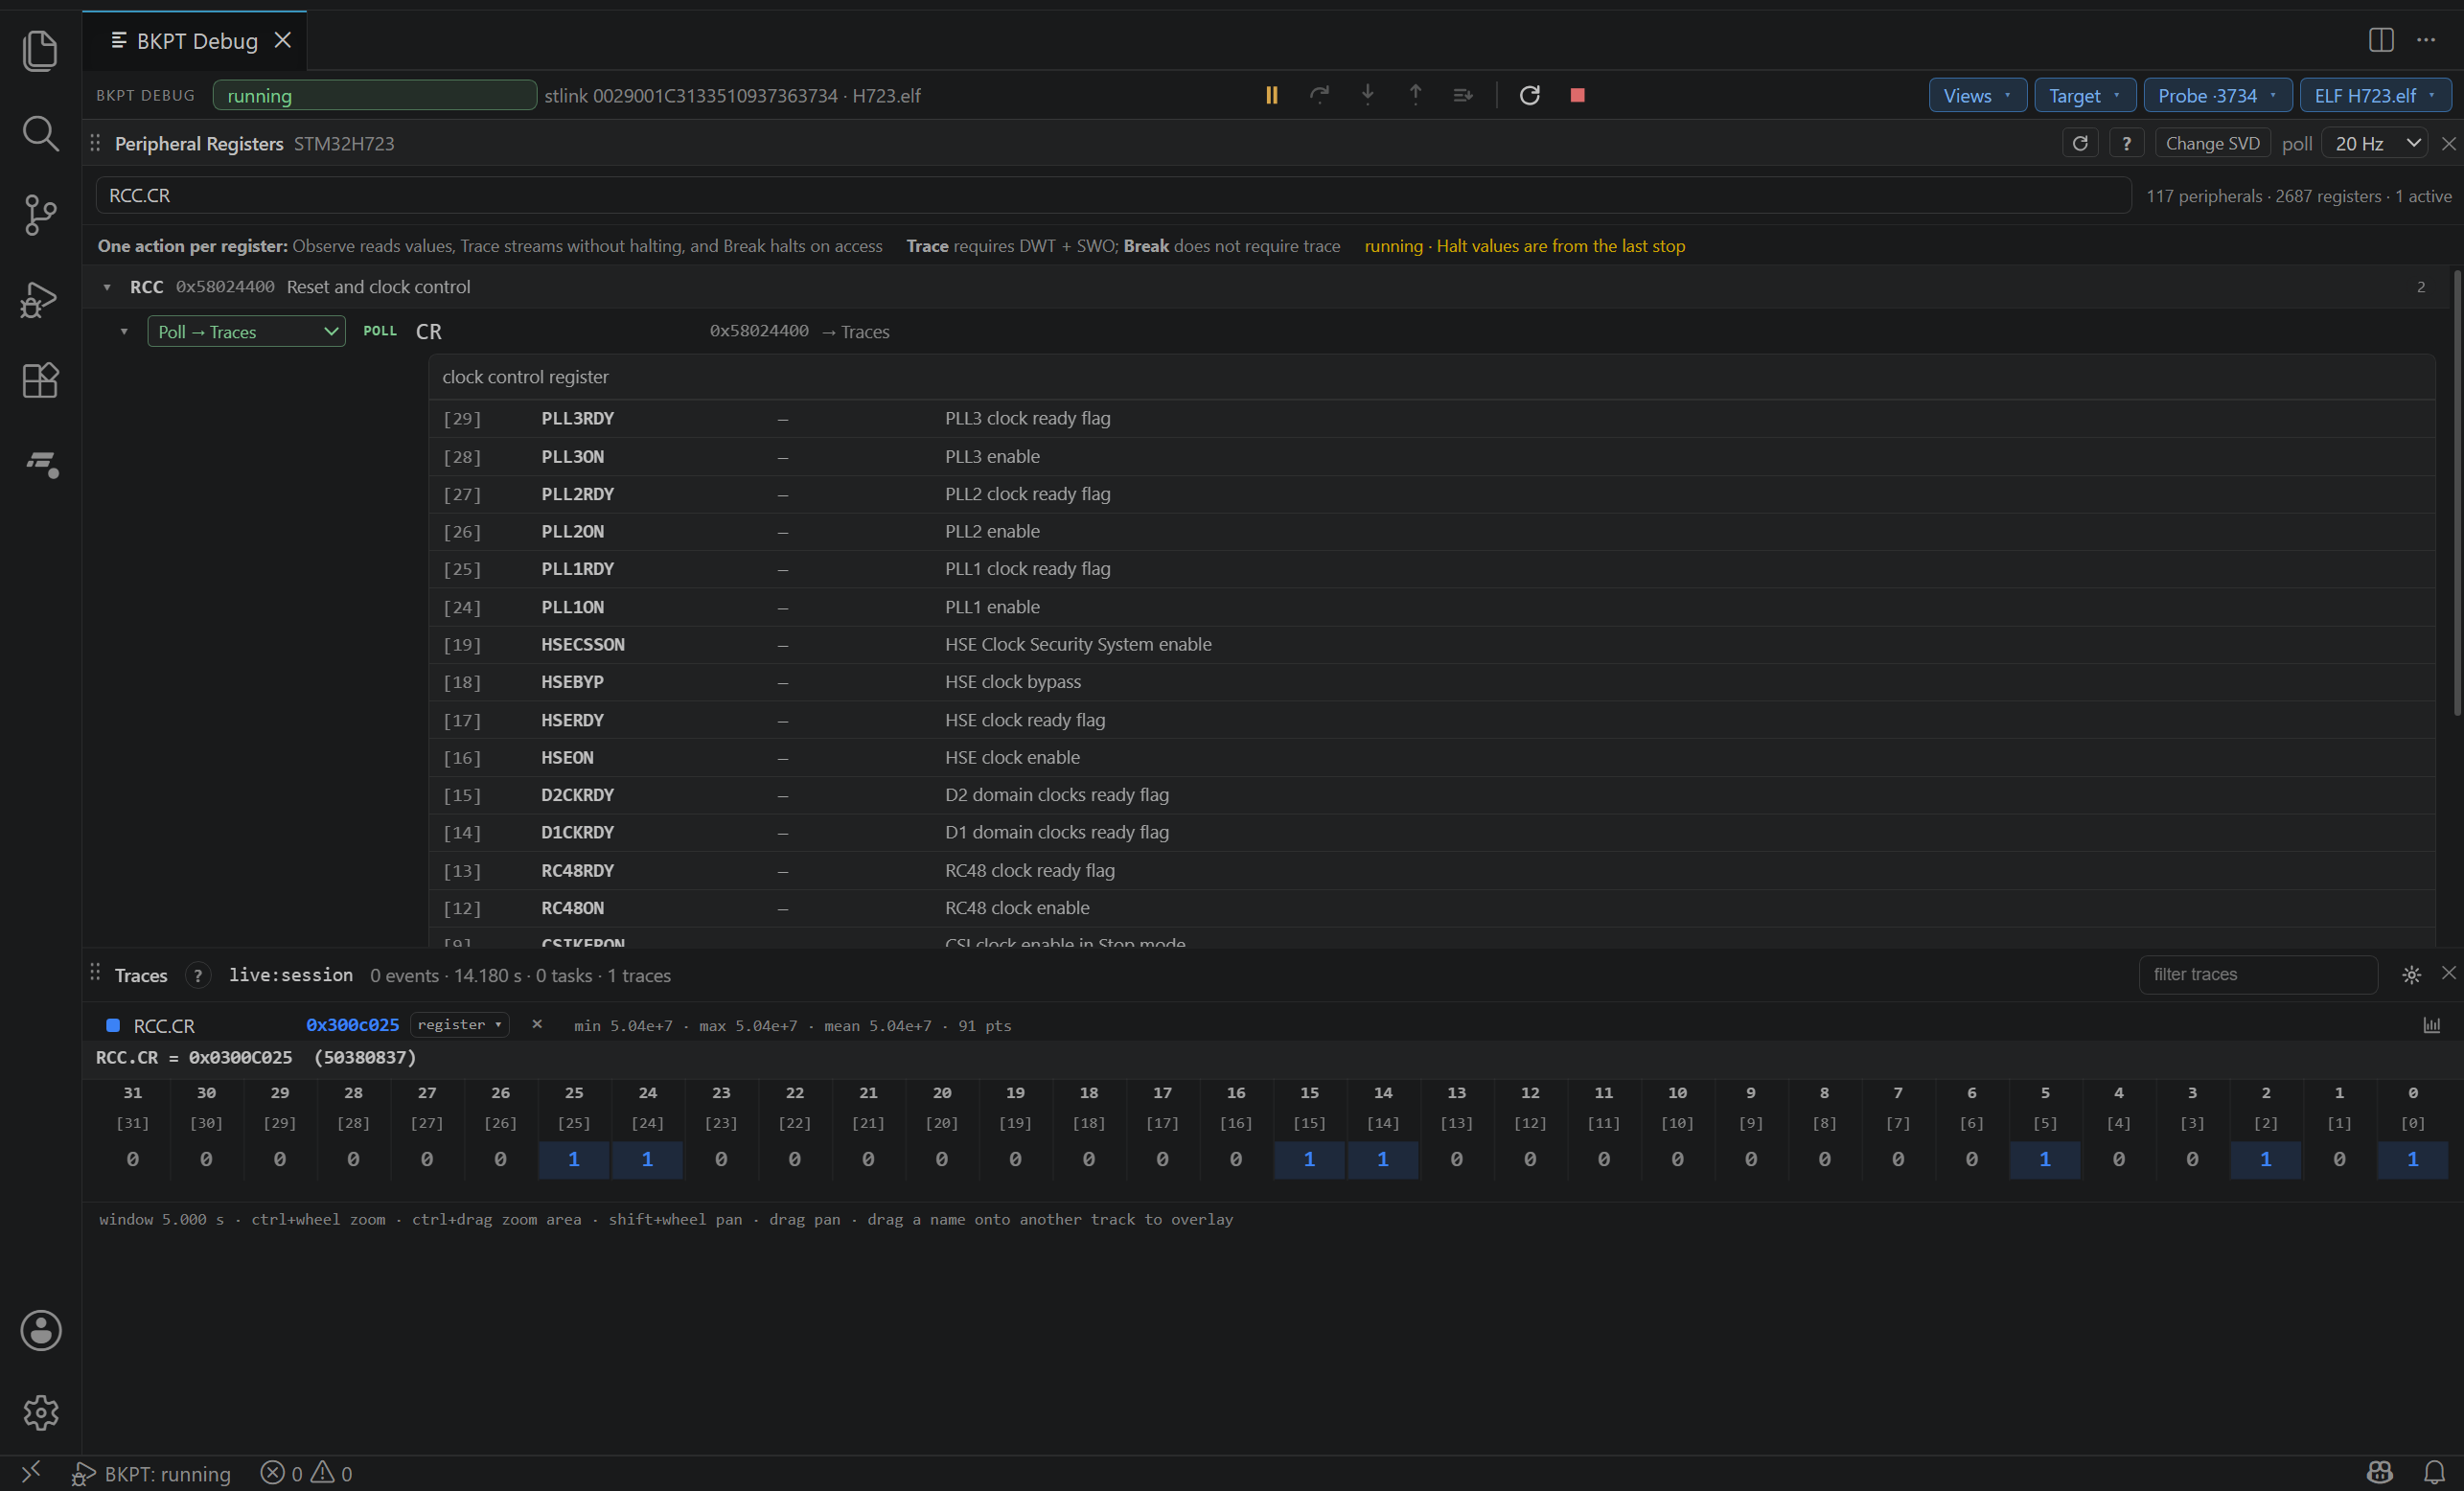
Choose Poll → Traces, then set the shared rate in the tile title bar. Each polled peripheral row becomes a register track; it does not overwrite the last halt snapshot in this tile. BKPT uses the same live-memory connection and scheduler as ELF symbol watches, rather than starting one process or timer per register.
Polling is the right choice when there is no SWO connection, when DMA changes the register, or when you care about the value over time rather than every CPU access. Reduce the rate if the probe link is busy or the register changes slowly.
The dropdown is a requested rate shared by the selected peripheral poll rows. It is not a guaranteed per-register frequency. Hover a graph's source badge to compare the requested and actual intervals when available. A halt snapshot and a running poll graph remain separate observations.
DWT trace without halting
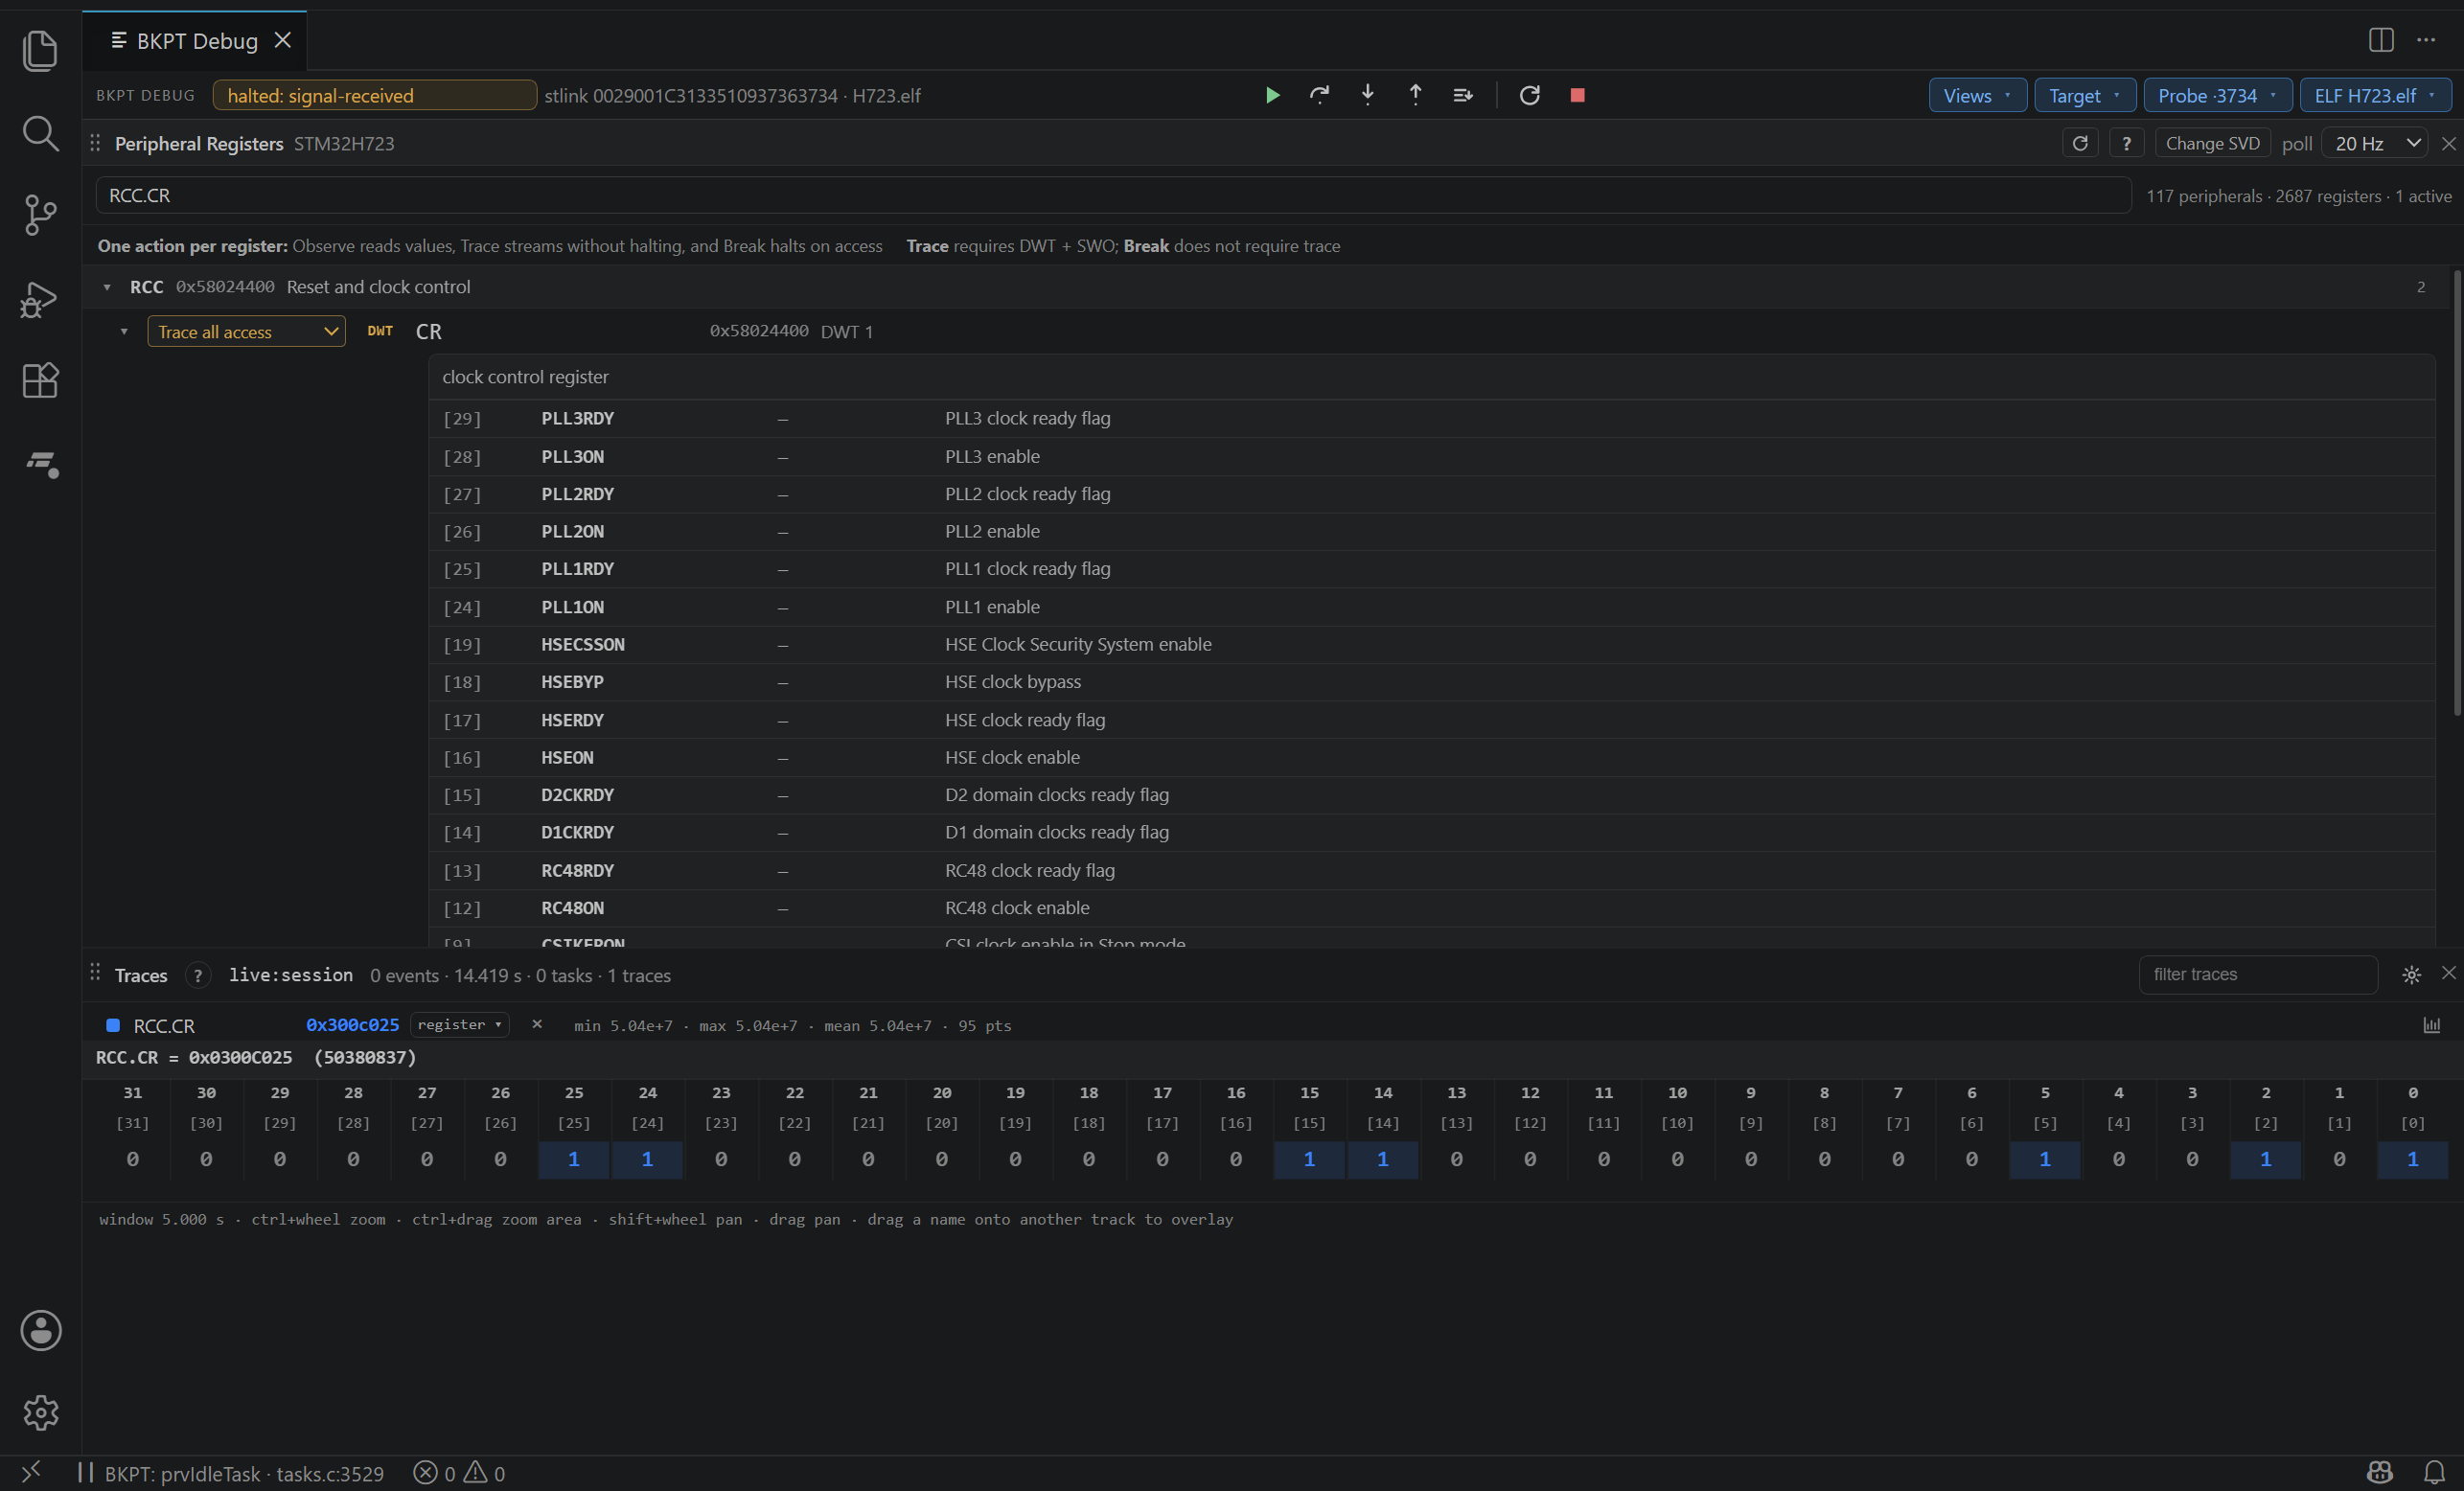
Run Target Scan, enable On-chip trace in Hardware Trace, and choose the CPU access to stream. The row shows its real one-based DWT slot, or no free DWT when it could not be armed. A selection is not considered applied until the target reports the matching data-w, data-r, or data-rw function.
DWT comparator capacity is discovered from DWT_CTRL.NUMCOMP; BKPT does not assume the count of the board used for these screenshots. Halt watchpoints can use that full target-reported pool. Streamed DWT data packets are a separate case: their packet header identifies comparator slots 0 through 3, so at most four slots can be routed unambiguously into trace tracks even when a core has more comparators. Extra comparators remain available for halt watchpoints.
Every selected Trace action also appears in Breakpoints → Data watchpoints, including before a session starts or if setup fails. Saved means intent only; Armed means hardware accepted it. ! Error keeps the request visible with the reason in a hover. Use the row's edit to return to the peripheral control. Data watchpoints explains the complete status lifecycle.
DWT break on access
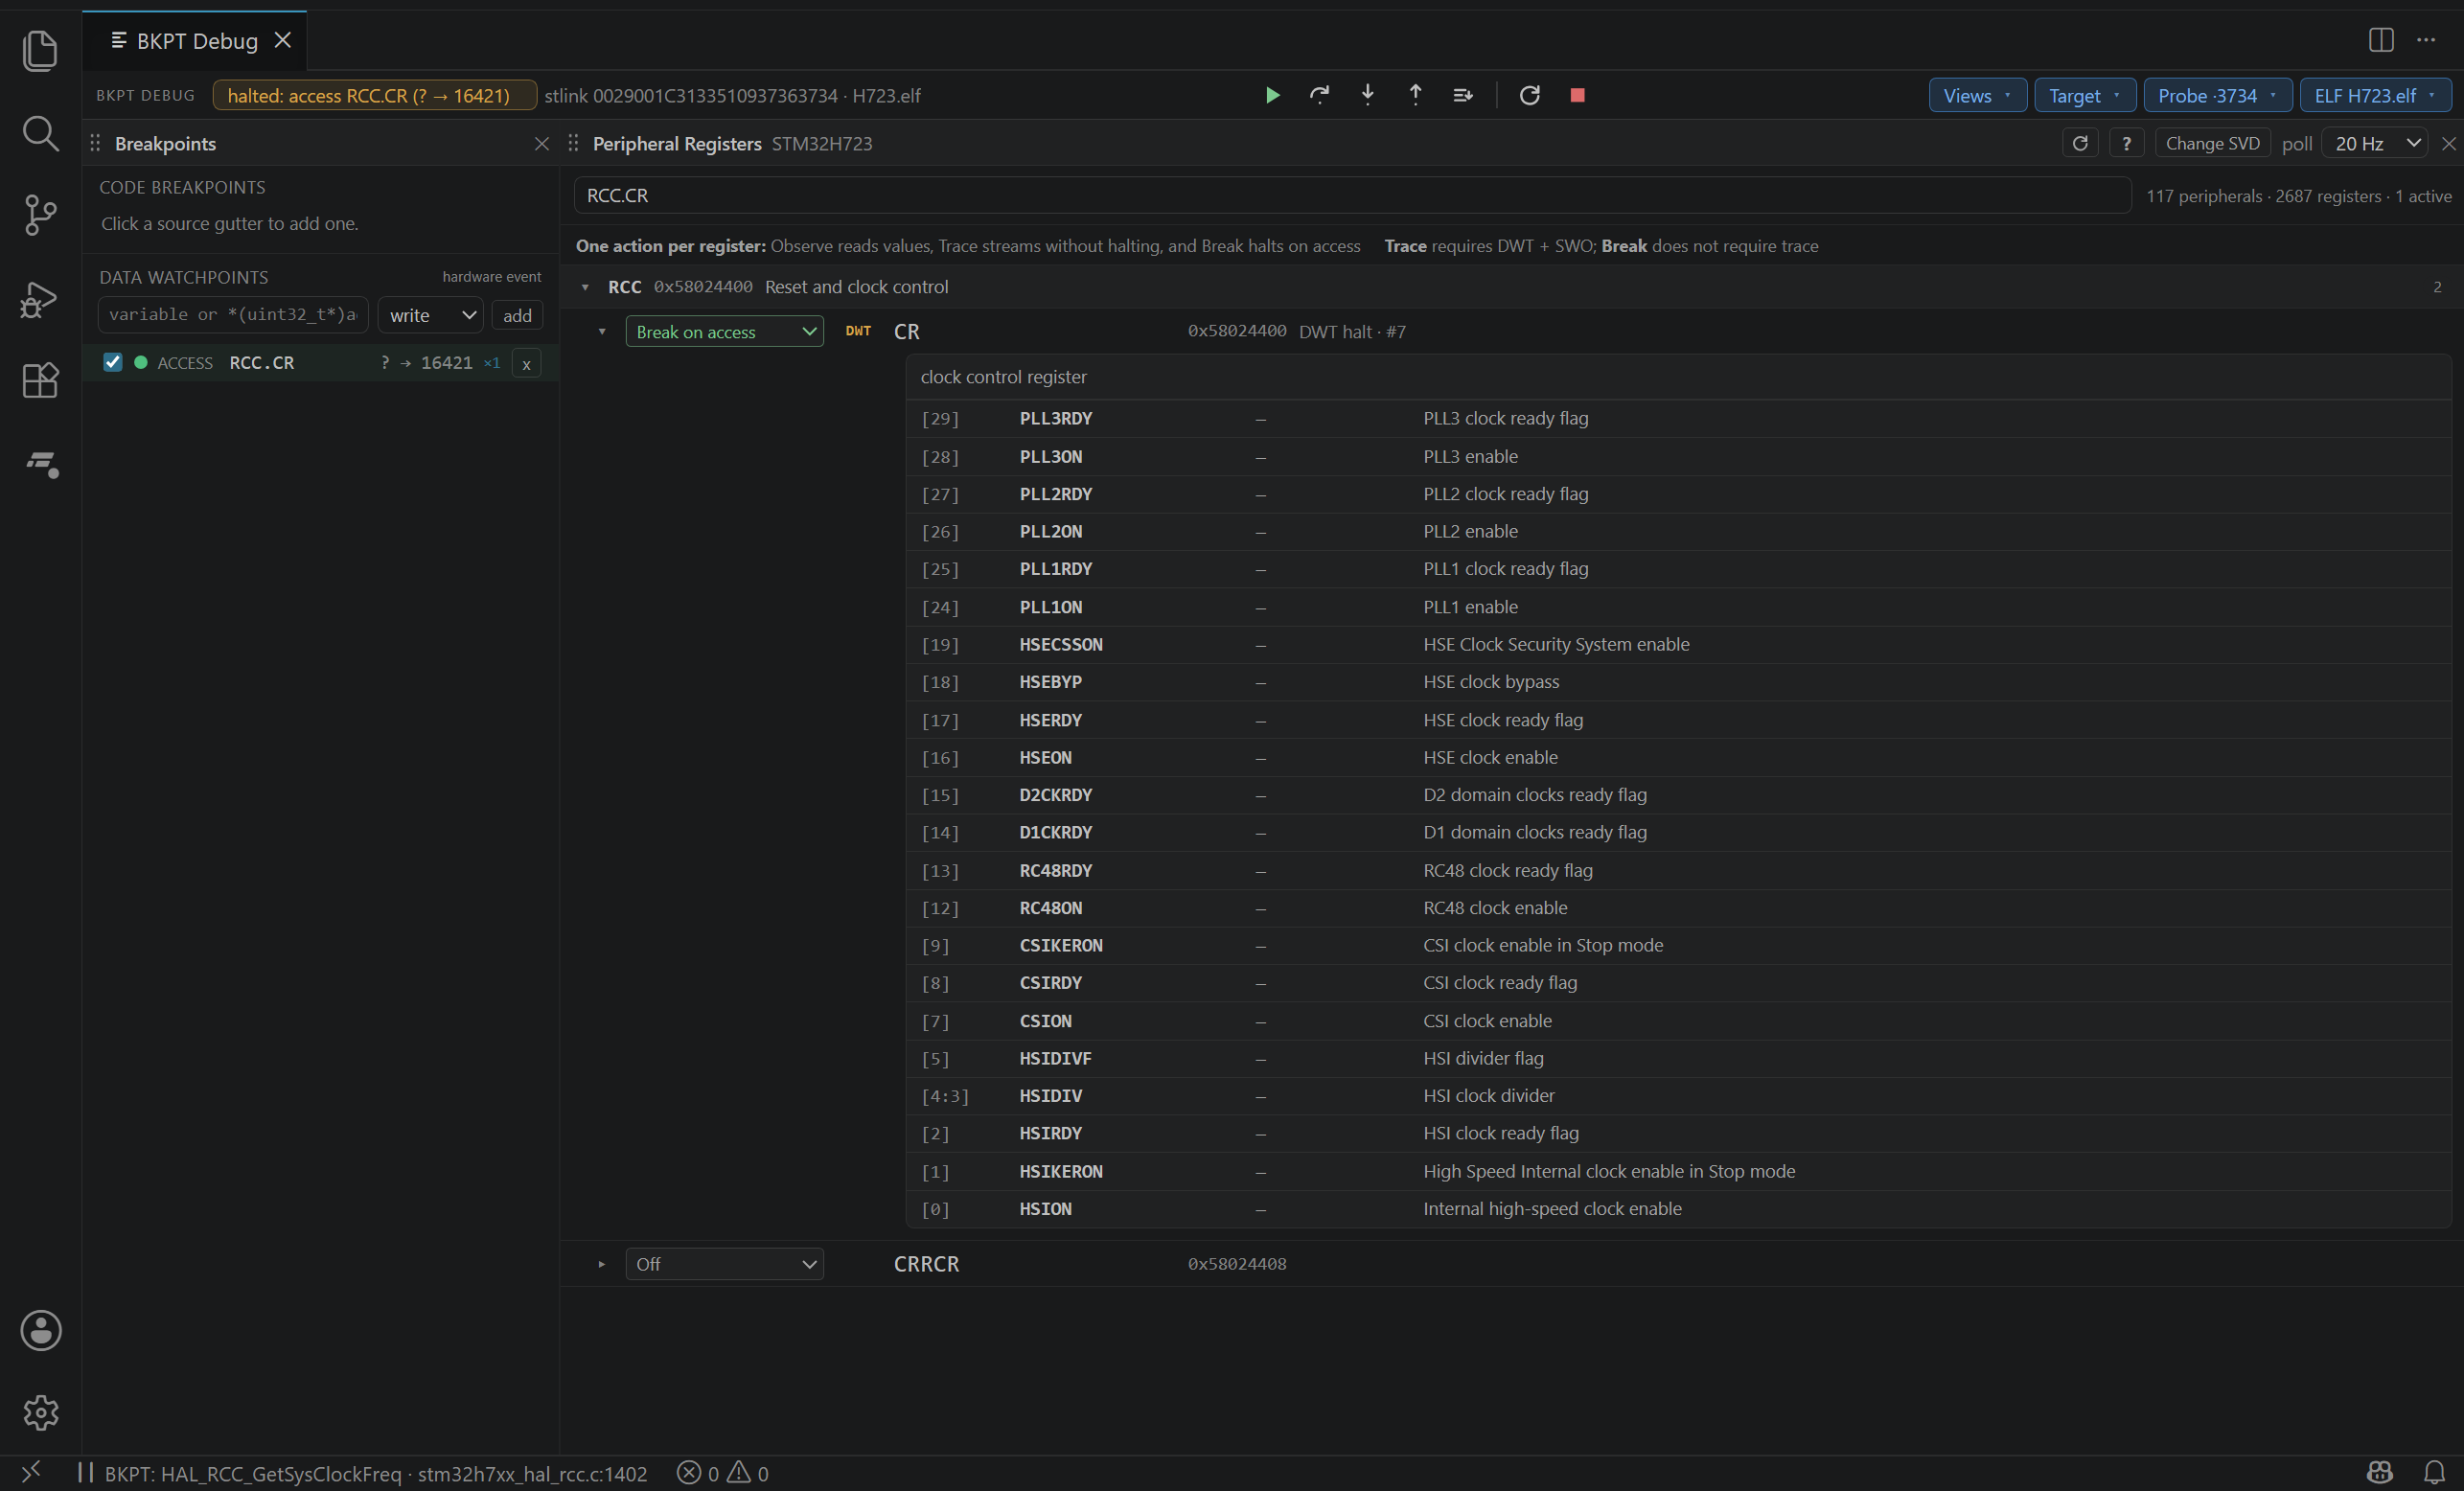
Break actions are hardware watchpoints. They work with profiling and on-chip trace off, and they appear in Data Watchpoints under the human-readable SVD name rather than only a raw address. Read and access matches depend on the access types implemented by that core's DWT; a rejected request stays visible with the target's reason.
Streamed trace and halt watchpoints share the physical DWT pool. BKPT plans them together, keeps halt watches in the target's higher available slots when possible, and never clears a slot owned by the other path while reconfiguring.
Session lifetime
Selections are project intent, but live acquisition belongs to the debug session. Continue starts or resumes the one shared polling pump and the on-chip decoder as needed; pause freezes polling and takes halt snapshots; Stop closes the live socket, cancels its timers, stops the decoder, and disarms session-owned DWT state. The saved SVD path and actions remain ready for the next session.