 DOCS/VIEWALYZER/COMMS
VIEWALYZER · GPUI EDITION
DOCS/VIEWALYZER/COMMS
VIEWALYZER · GPUI EDITION
Comms
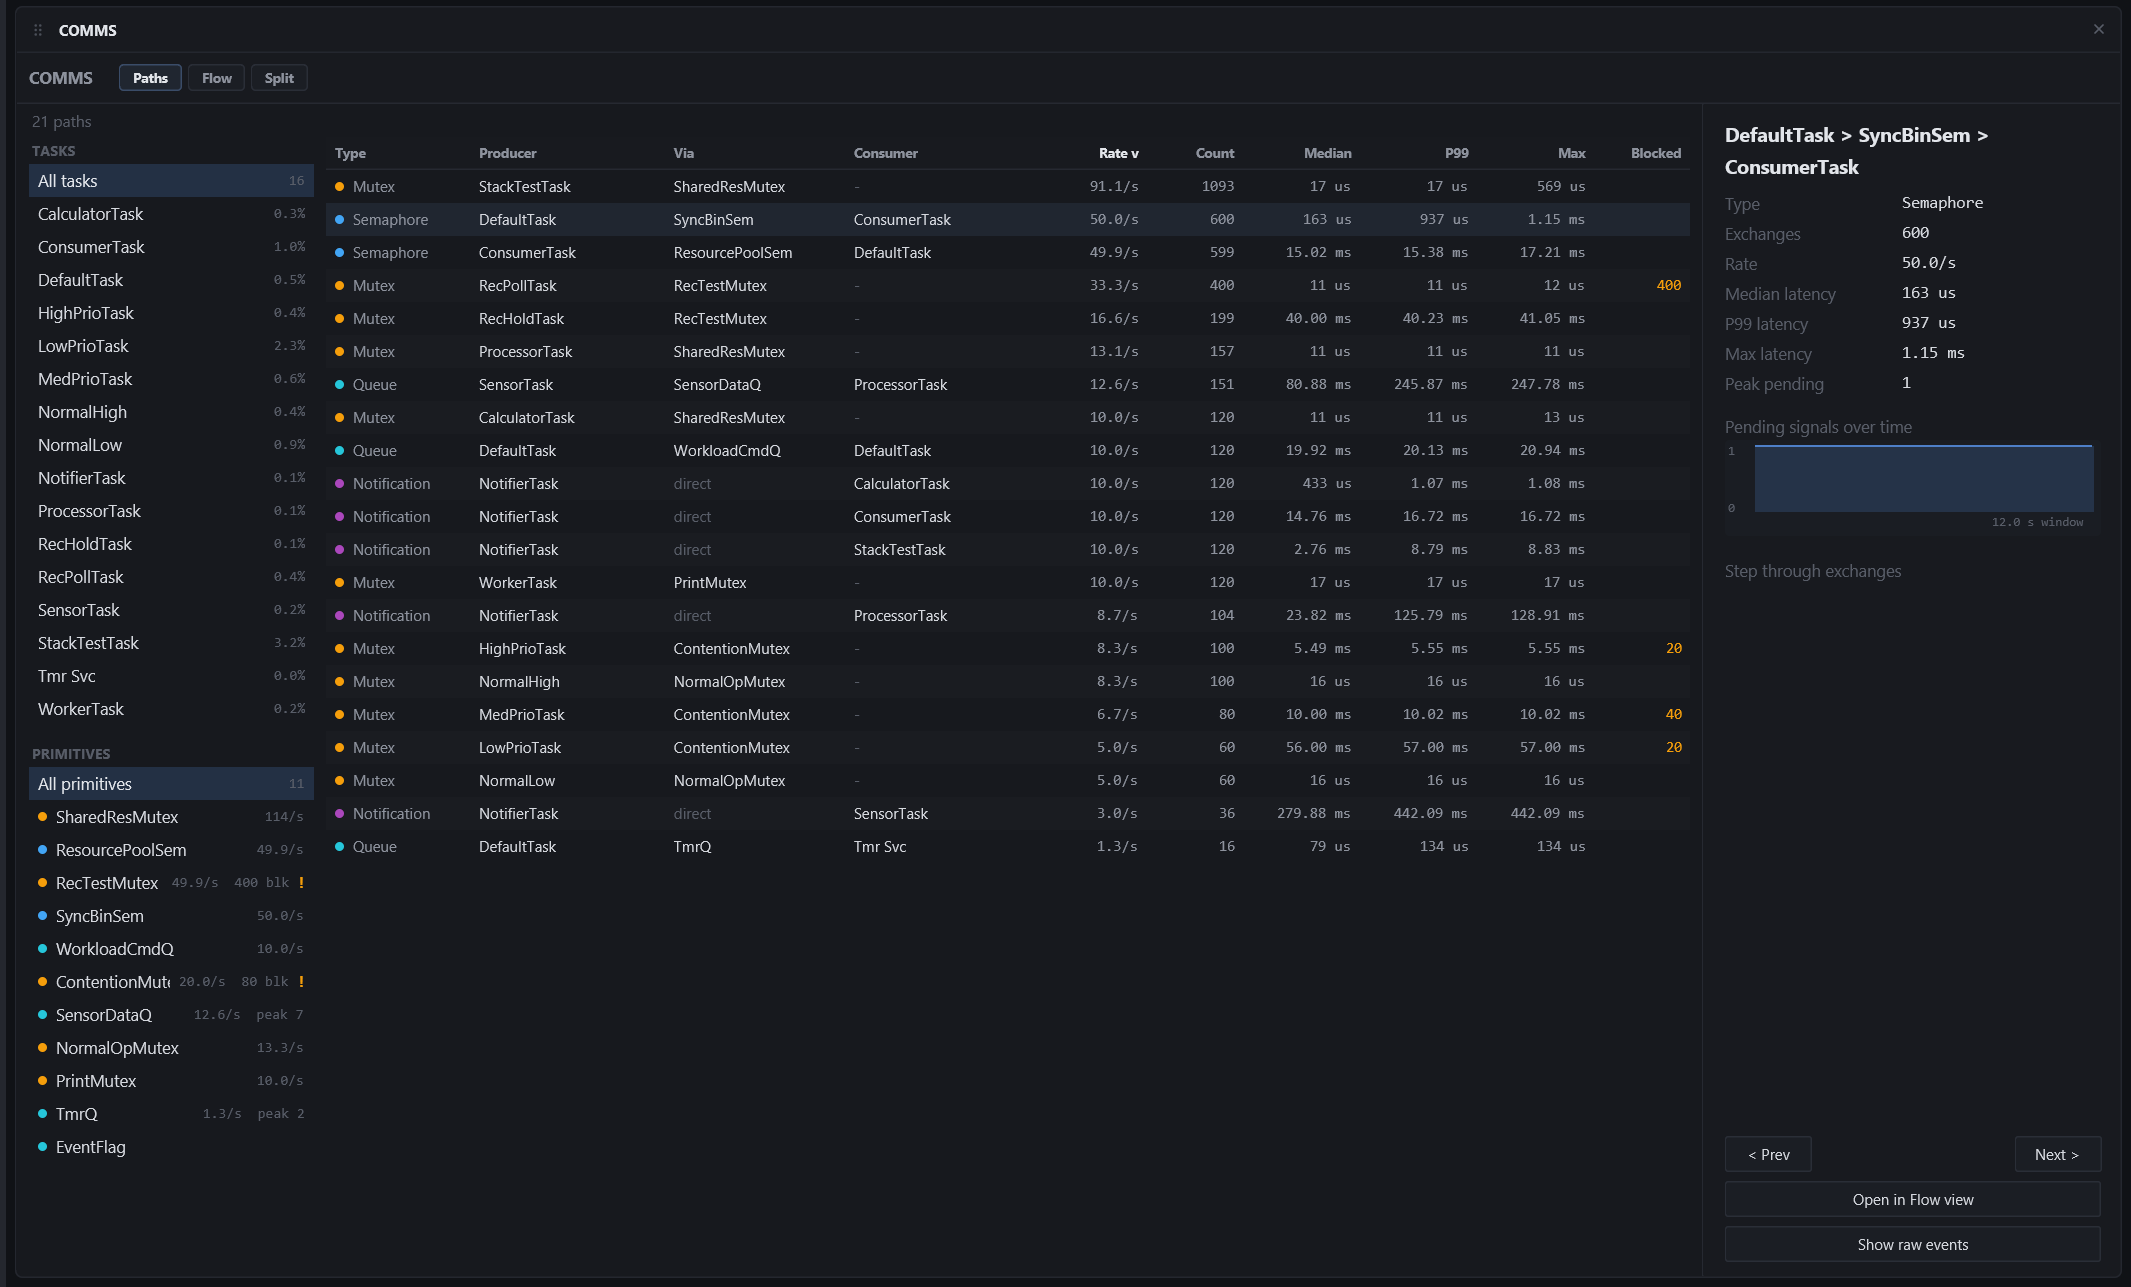
Task communication, mapped as paths: producer, the primitive in the middle, consumer. A queue send is paired with the receive that dequeued it, a semaphore give with the take it satisfied, a notification with the take on the destination task, and a mutex acquire with its release (a hold). Each pair is an exchange; a path's exchanges give it a rate, a count and a latency distribution.
Needs: a recording with queue, semaphore, mutex or notification events.
Ways to look
Resources
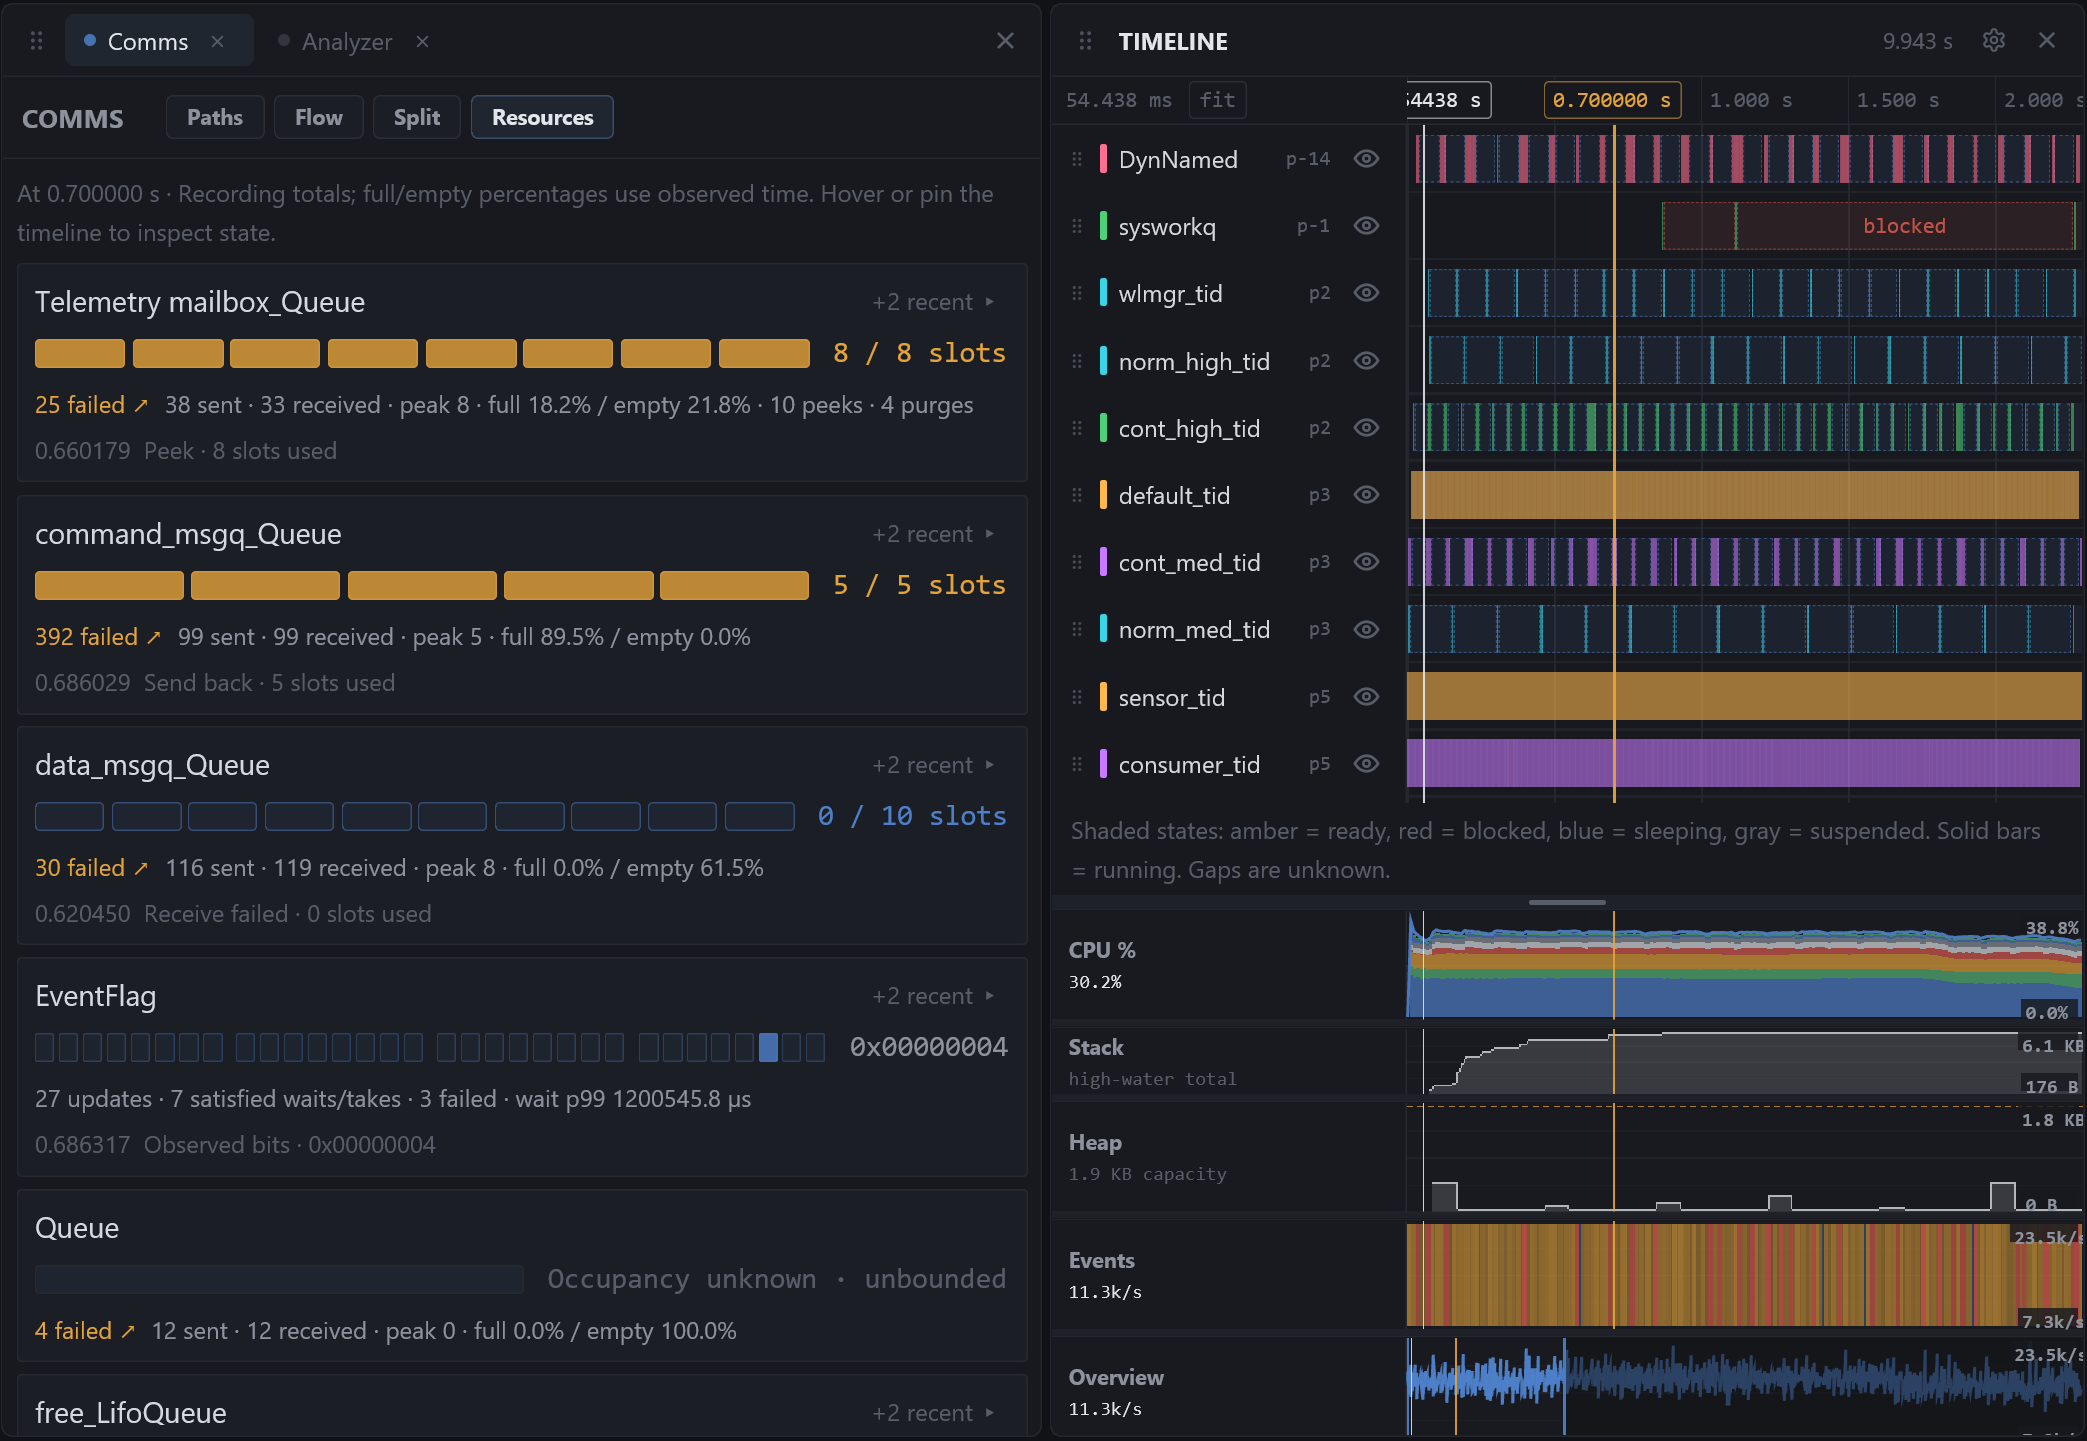
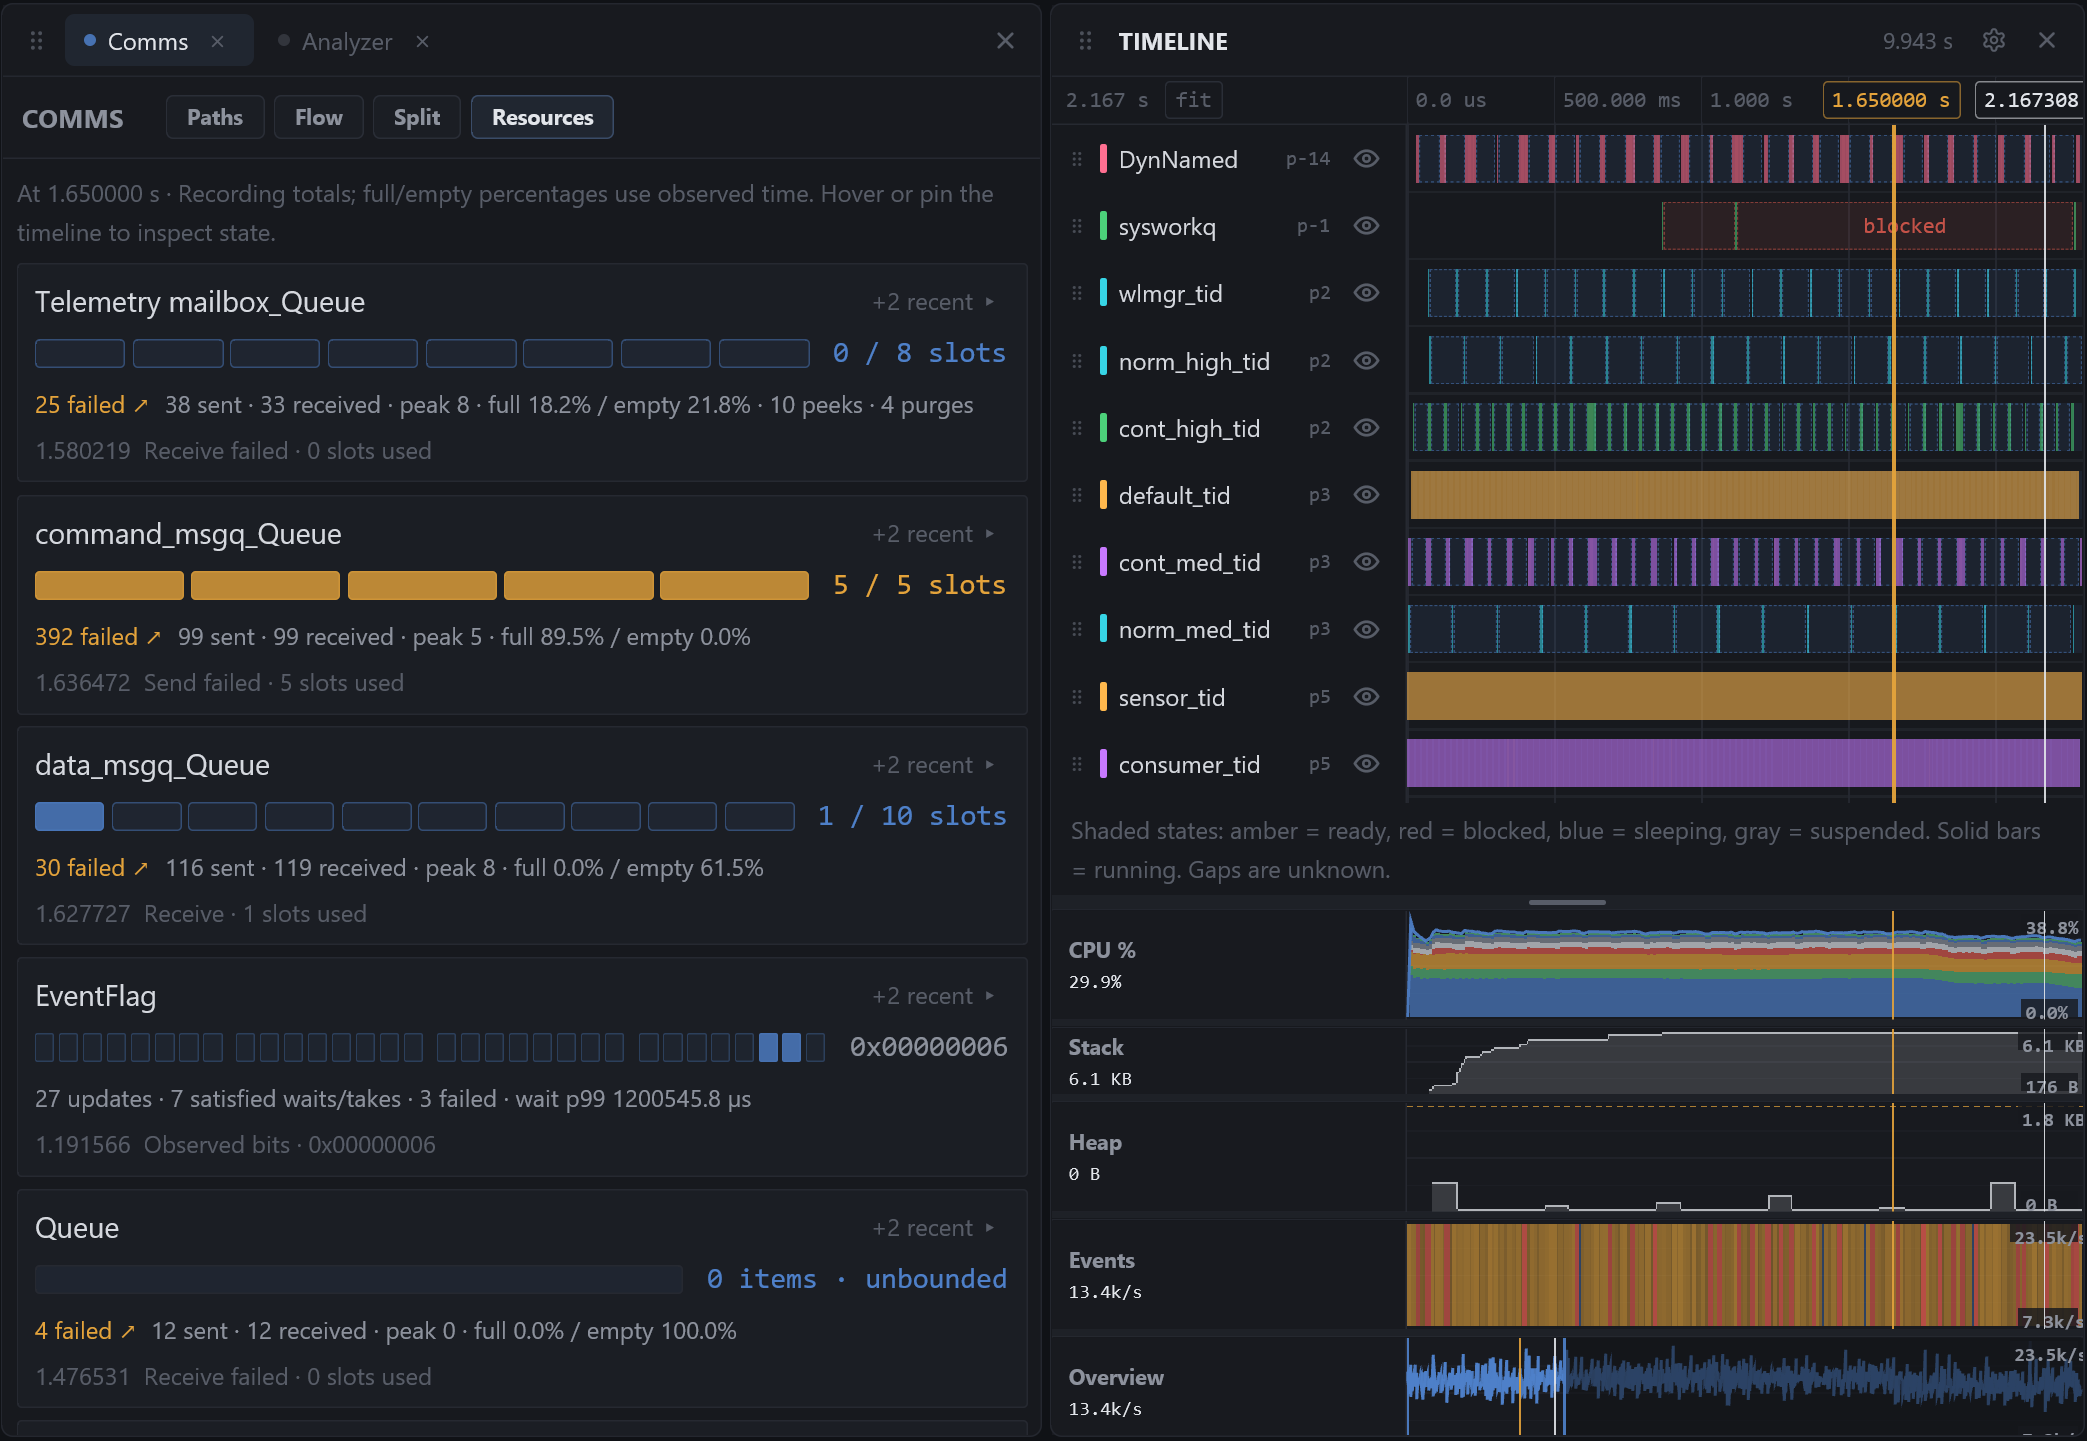
Scrub or pin the Timeline cursor to see queue occupancy, notification values, and event flags at that point in the recording. Queue meters show used slots against capacity; notification and flag cards show the observed bits. Large queues use a continuous meter, and unbounded queues show an item count. An unknown value stays unknown, including across a recorded event-loss boundary.
Queue cards include send, receive and failure counts, peak occupancy, and the percentage of observed time spent full or empty. Totals cover the whole recording; the meter and latest operation follow the cursor. Expand recent to see more operation history without making every card taller.
Click a nonzero failed count to open Analyzer with every recorded send, receive or peek failure for that queue. Select a finding to jump to its exact Timeline event and read its task or ISR context and observed occupancy. This queue-specific list covers the whole recording, even when the CPU view is scoped to a selection. Clear queue filter returns to the normal findings list.
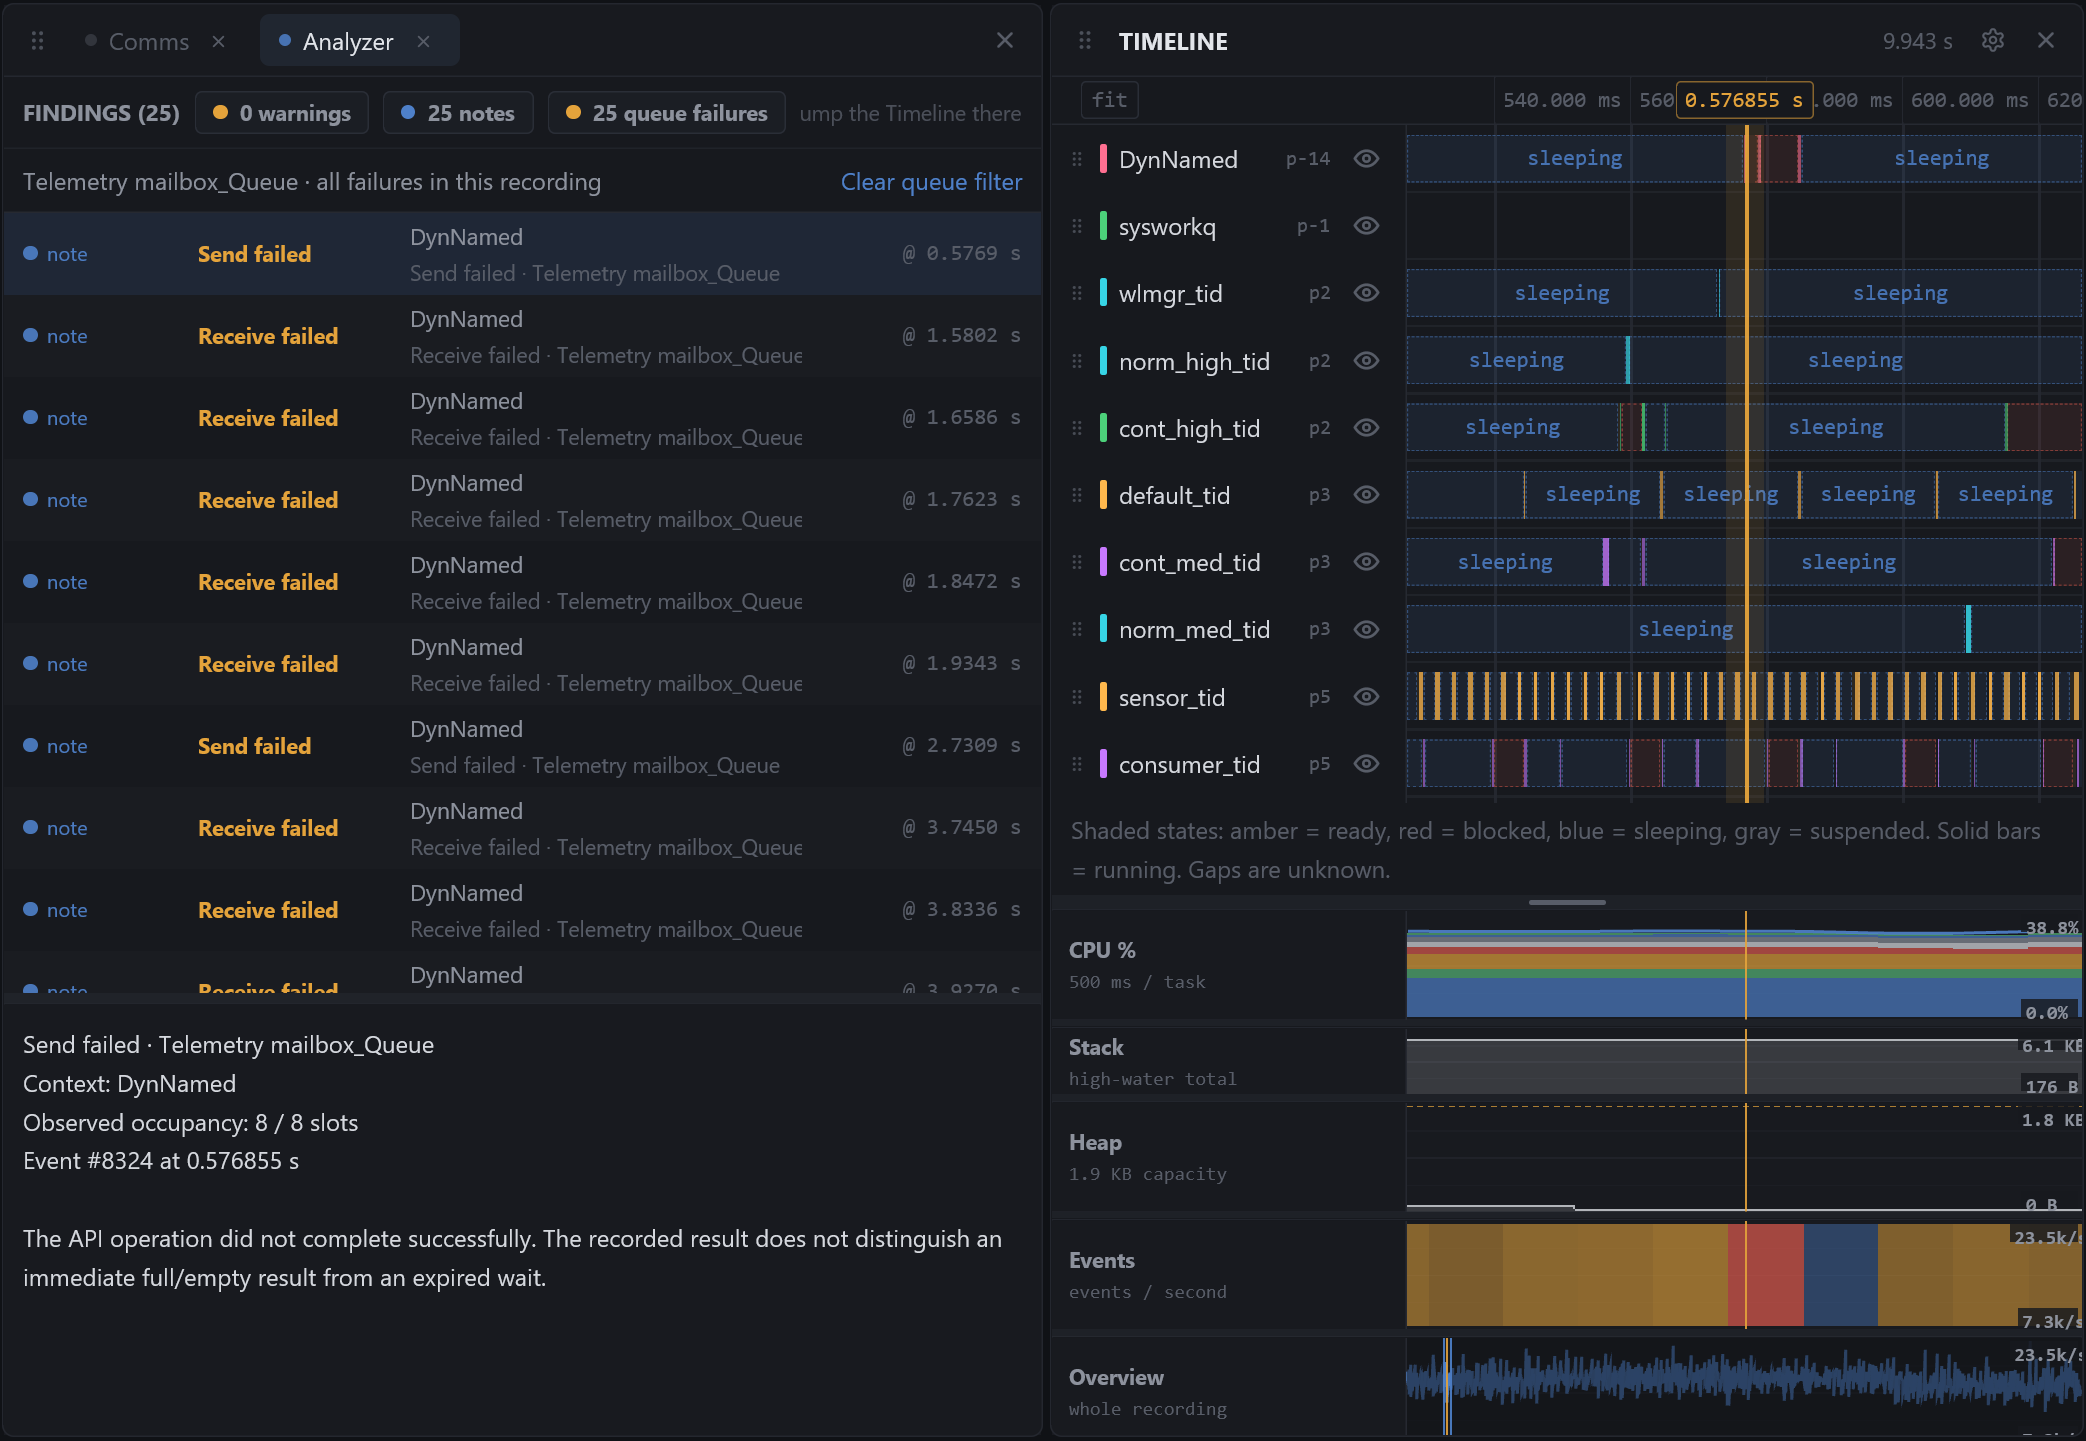
Failed operations are informational: an unsuccessful nonblocking poll can be expected. The recorded result does not distinguish an immediate full/empty result from an expired wait.
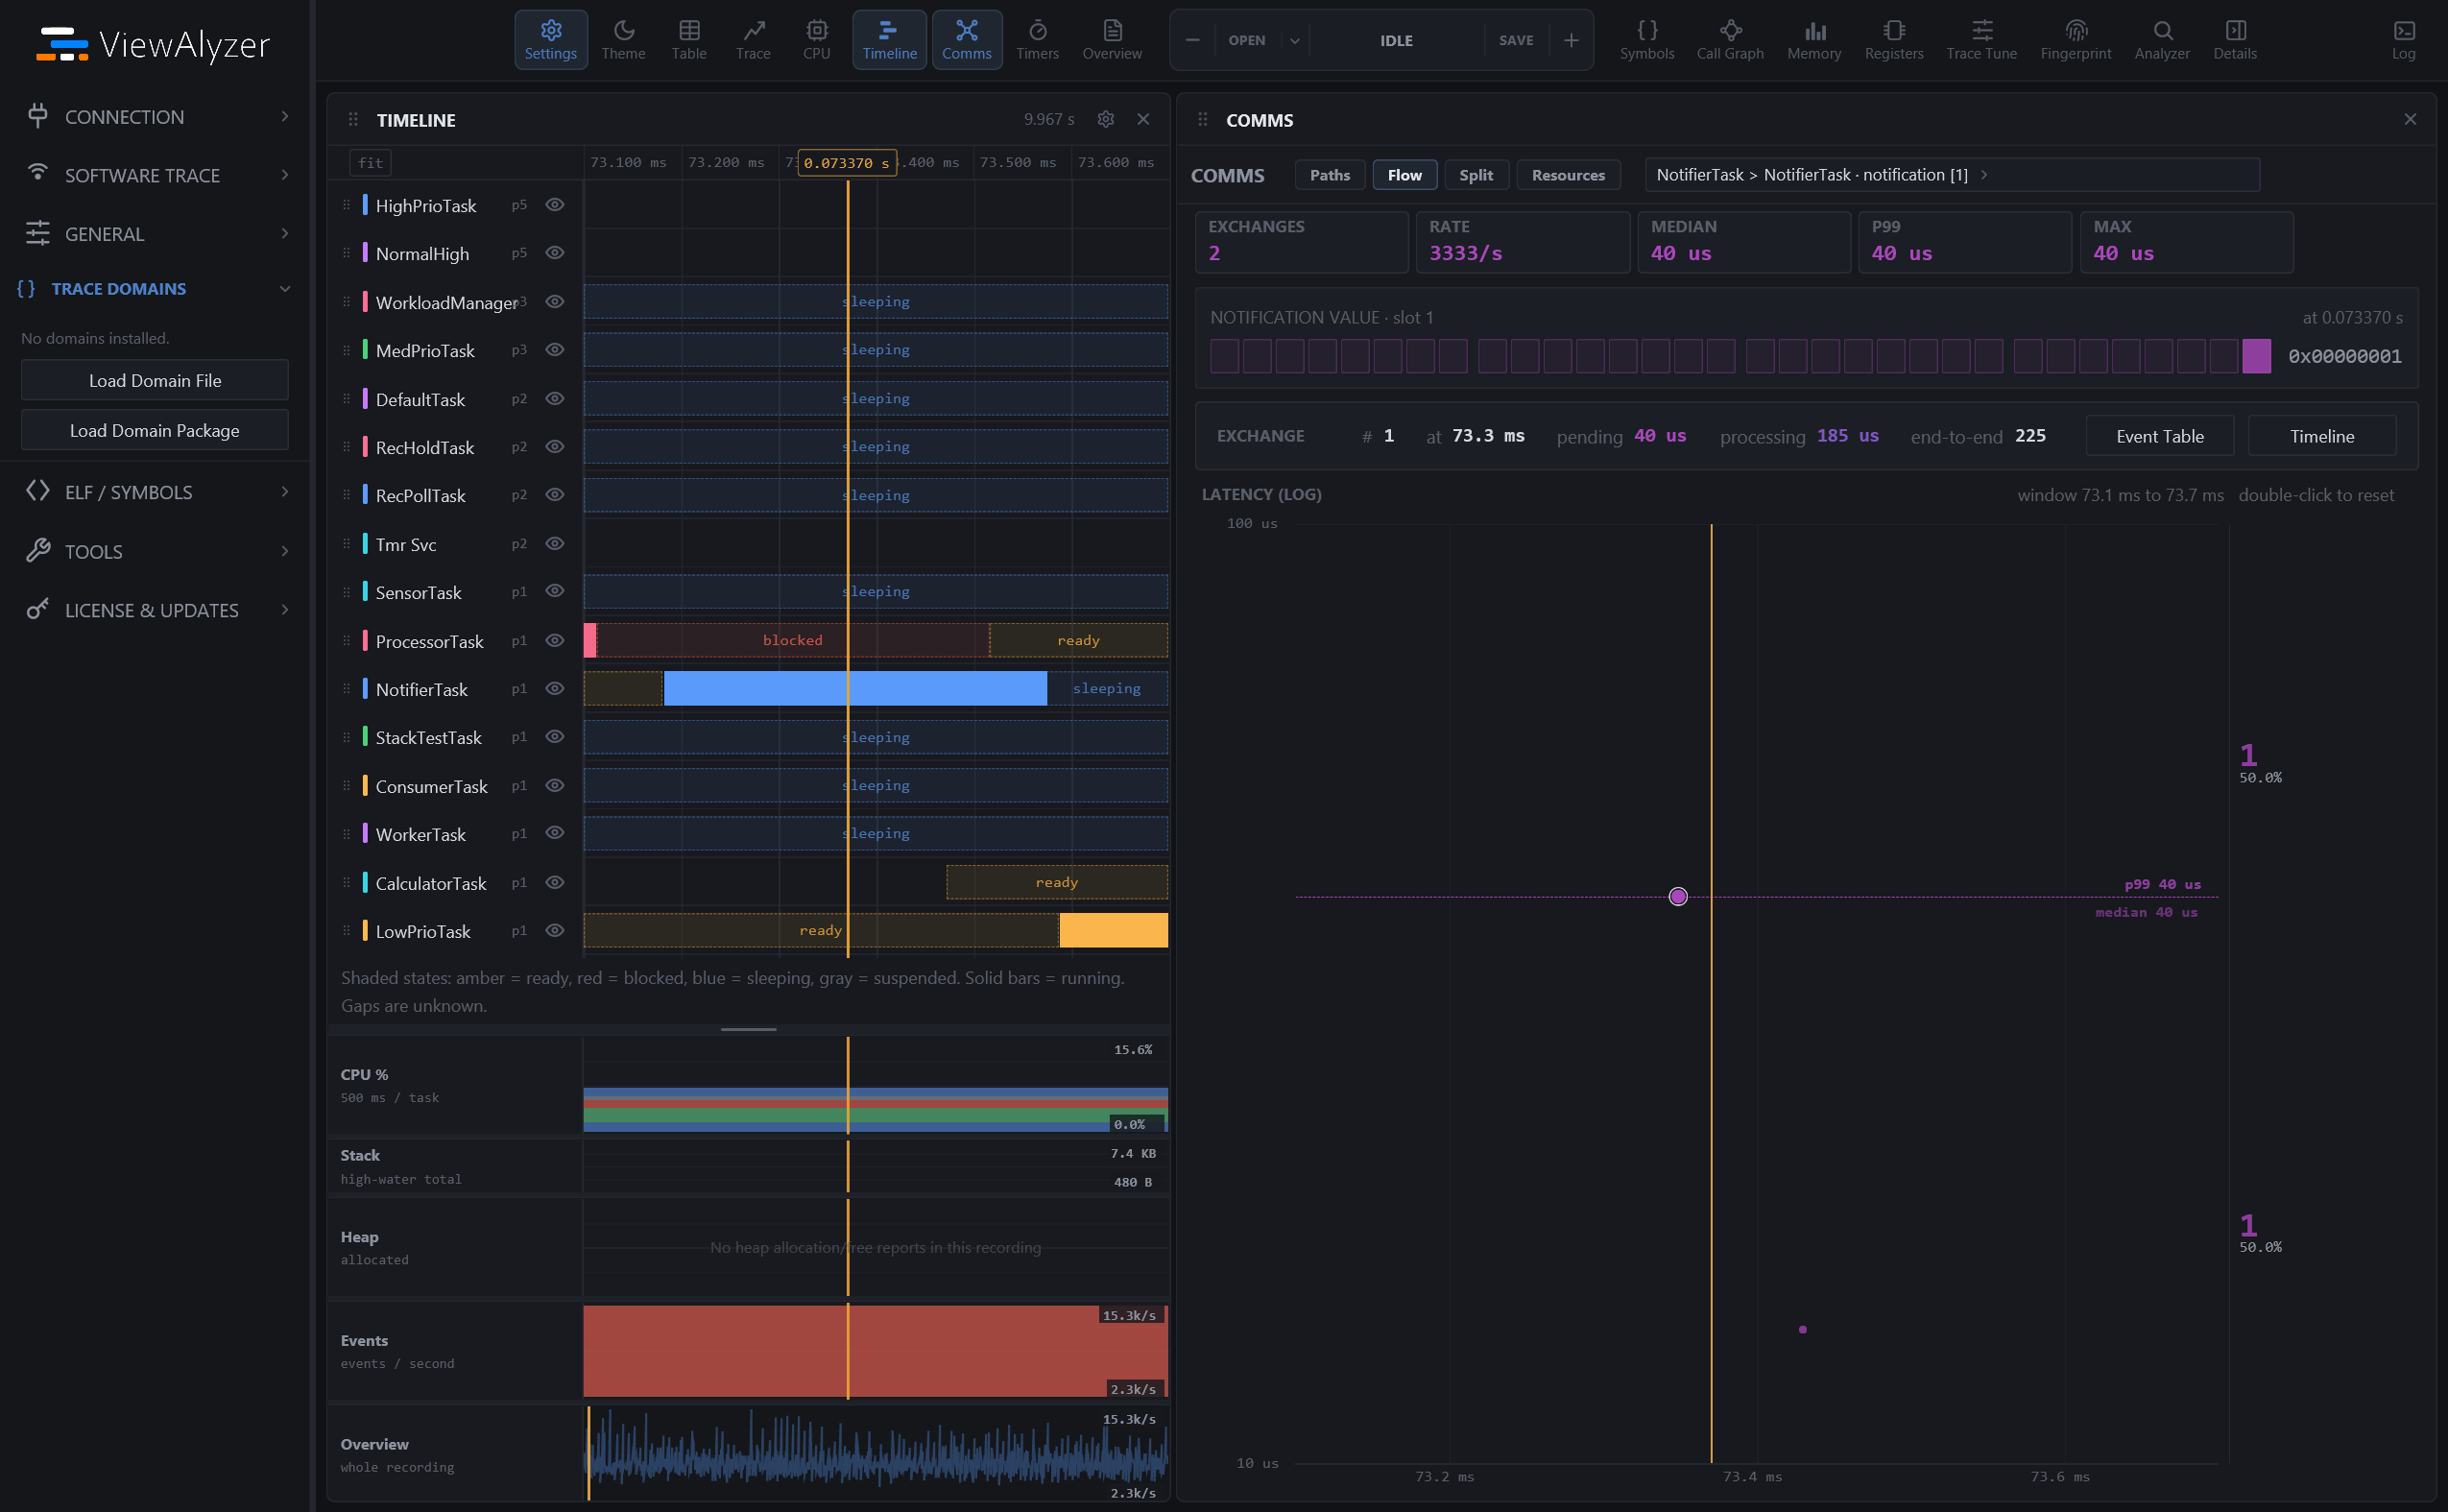
Indexed task notification slots retain separate values and counters. Event flags show which bits were observed, together with updates, satisfied waits and failures.
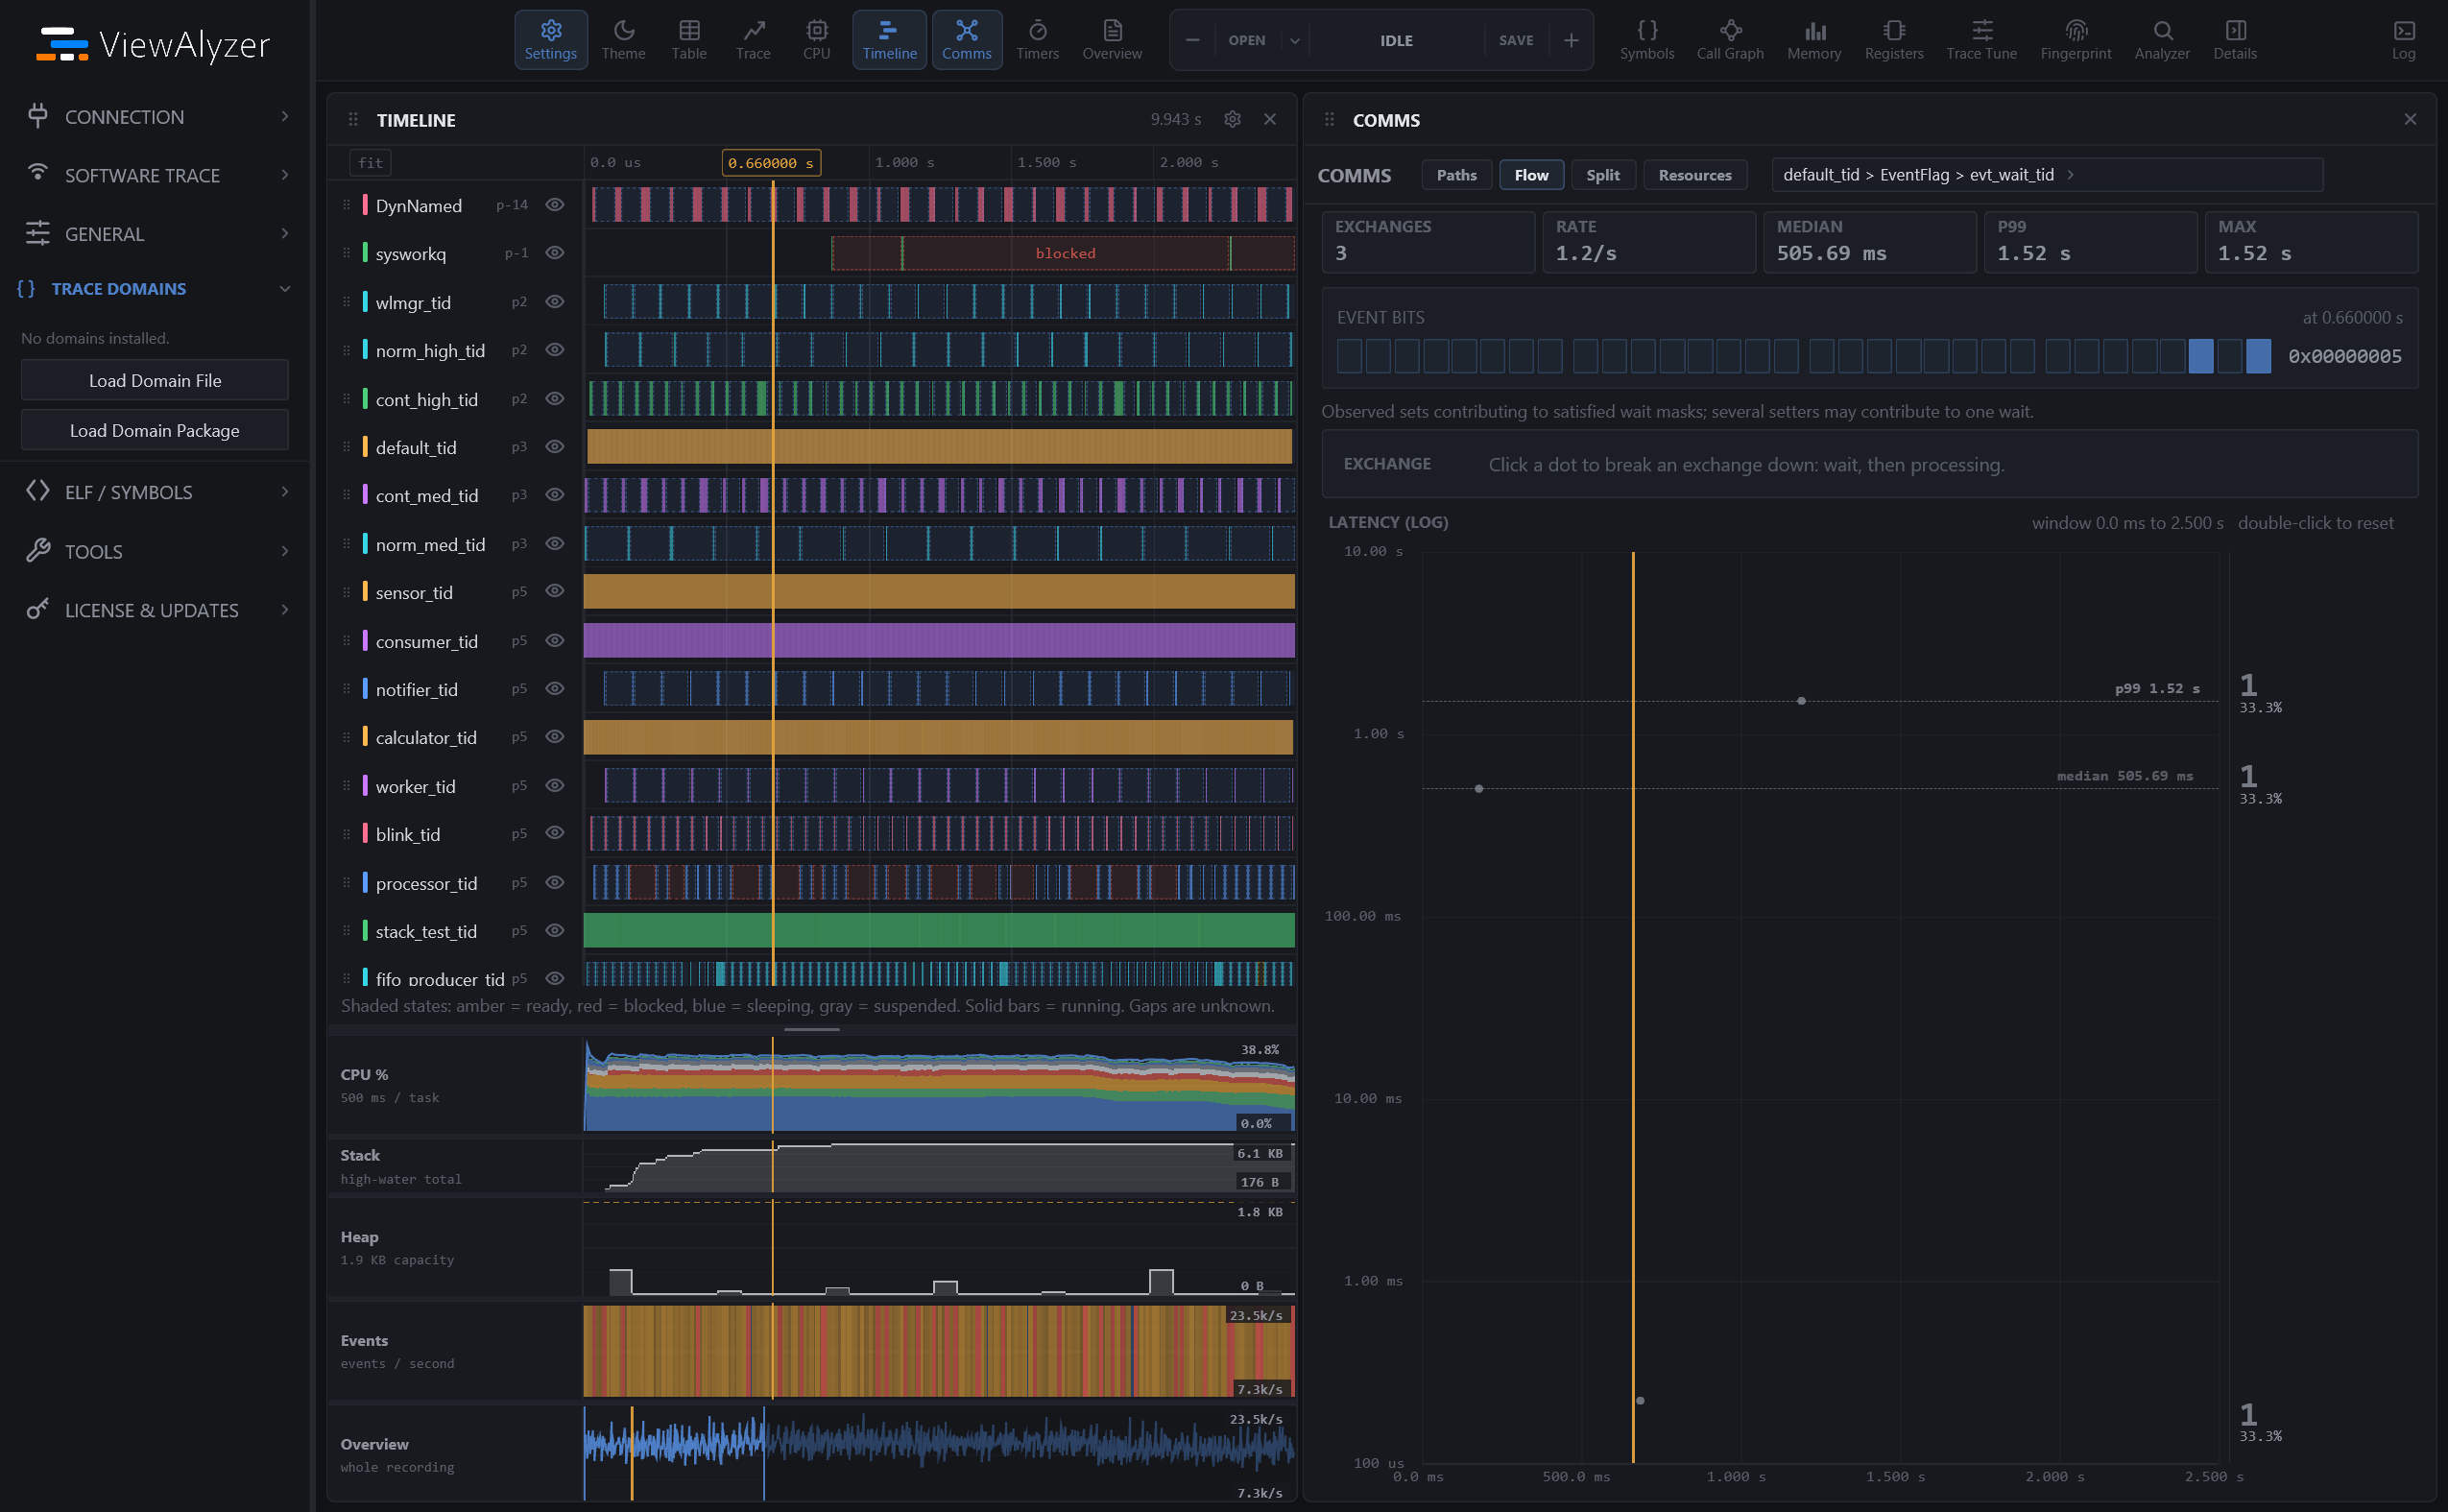
These cards require the matching optional detail hooks. Older recordings without them still support the available communication paths; no occupancy or bit values are invented.
The Resources tab summarizes FreeRTOS stream/message buffers and Zephyr memory slabs, condition variables and poll operations. It shows buffer byte counts and failures, slab block capacity and observed high water, and completed condition-variable/poll API wait durations. ISR operations retain their exception number. Click one of the recent operations to locate it in Timeline and the Event Table. These totals cover the recording, not the visible time window.
This view needs the matching recorder categories. A stream send need not match one receive, and a condition-variable signal need not wake a waiter, so Resources does not infer communication arrows or buffer occupancy. Slab usage comes from the kernel's absolute count; its chart shows peak observations in each time bin.
Paths
The map as linked tables.
- The rail on the left lists the tasks (with their CPU share) and the primitives (with their rate, and either the number of times a mutex blocked someone or a queue's peak depth; an amber
!marks a contended mutex). Click one to filter the table to it; the two filters combine. All tasks / All primitives clear them. - The paths table: type, producer, via, consumer, rate, count, median / P99 / max latency (hold time for a mutex), blocked. Notifications go direct and show
directin the Via column; mutex holds have no consumer. - The inspector on the right describes the selection:
- a task: its paths, busiest first, each clickable;
- a primitive: sends and receives (acquires and releases for a mutex), matched pairs, still pending at the end of the capture, empty receives (timeouts or pre-loaded counts), contentions or peak pending, and a chart of messages waiting over time;
- a path: its statistics, the primitive's pending figures, the same chart, and an exchange stepper (< Prev / Next >) that walks the exchanges one by one, pinning the Timeline cursor on each receive and selecting its row in the Event Table.
- Open in Flow view takes the path to the Flow view; Show raw events filters the Event Table to the primitive.
Flow
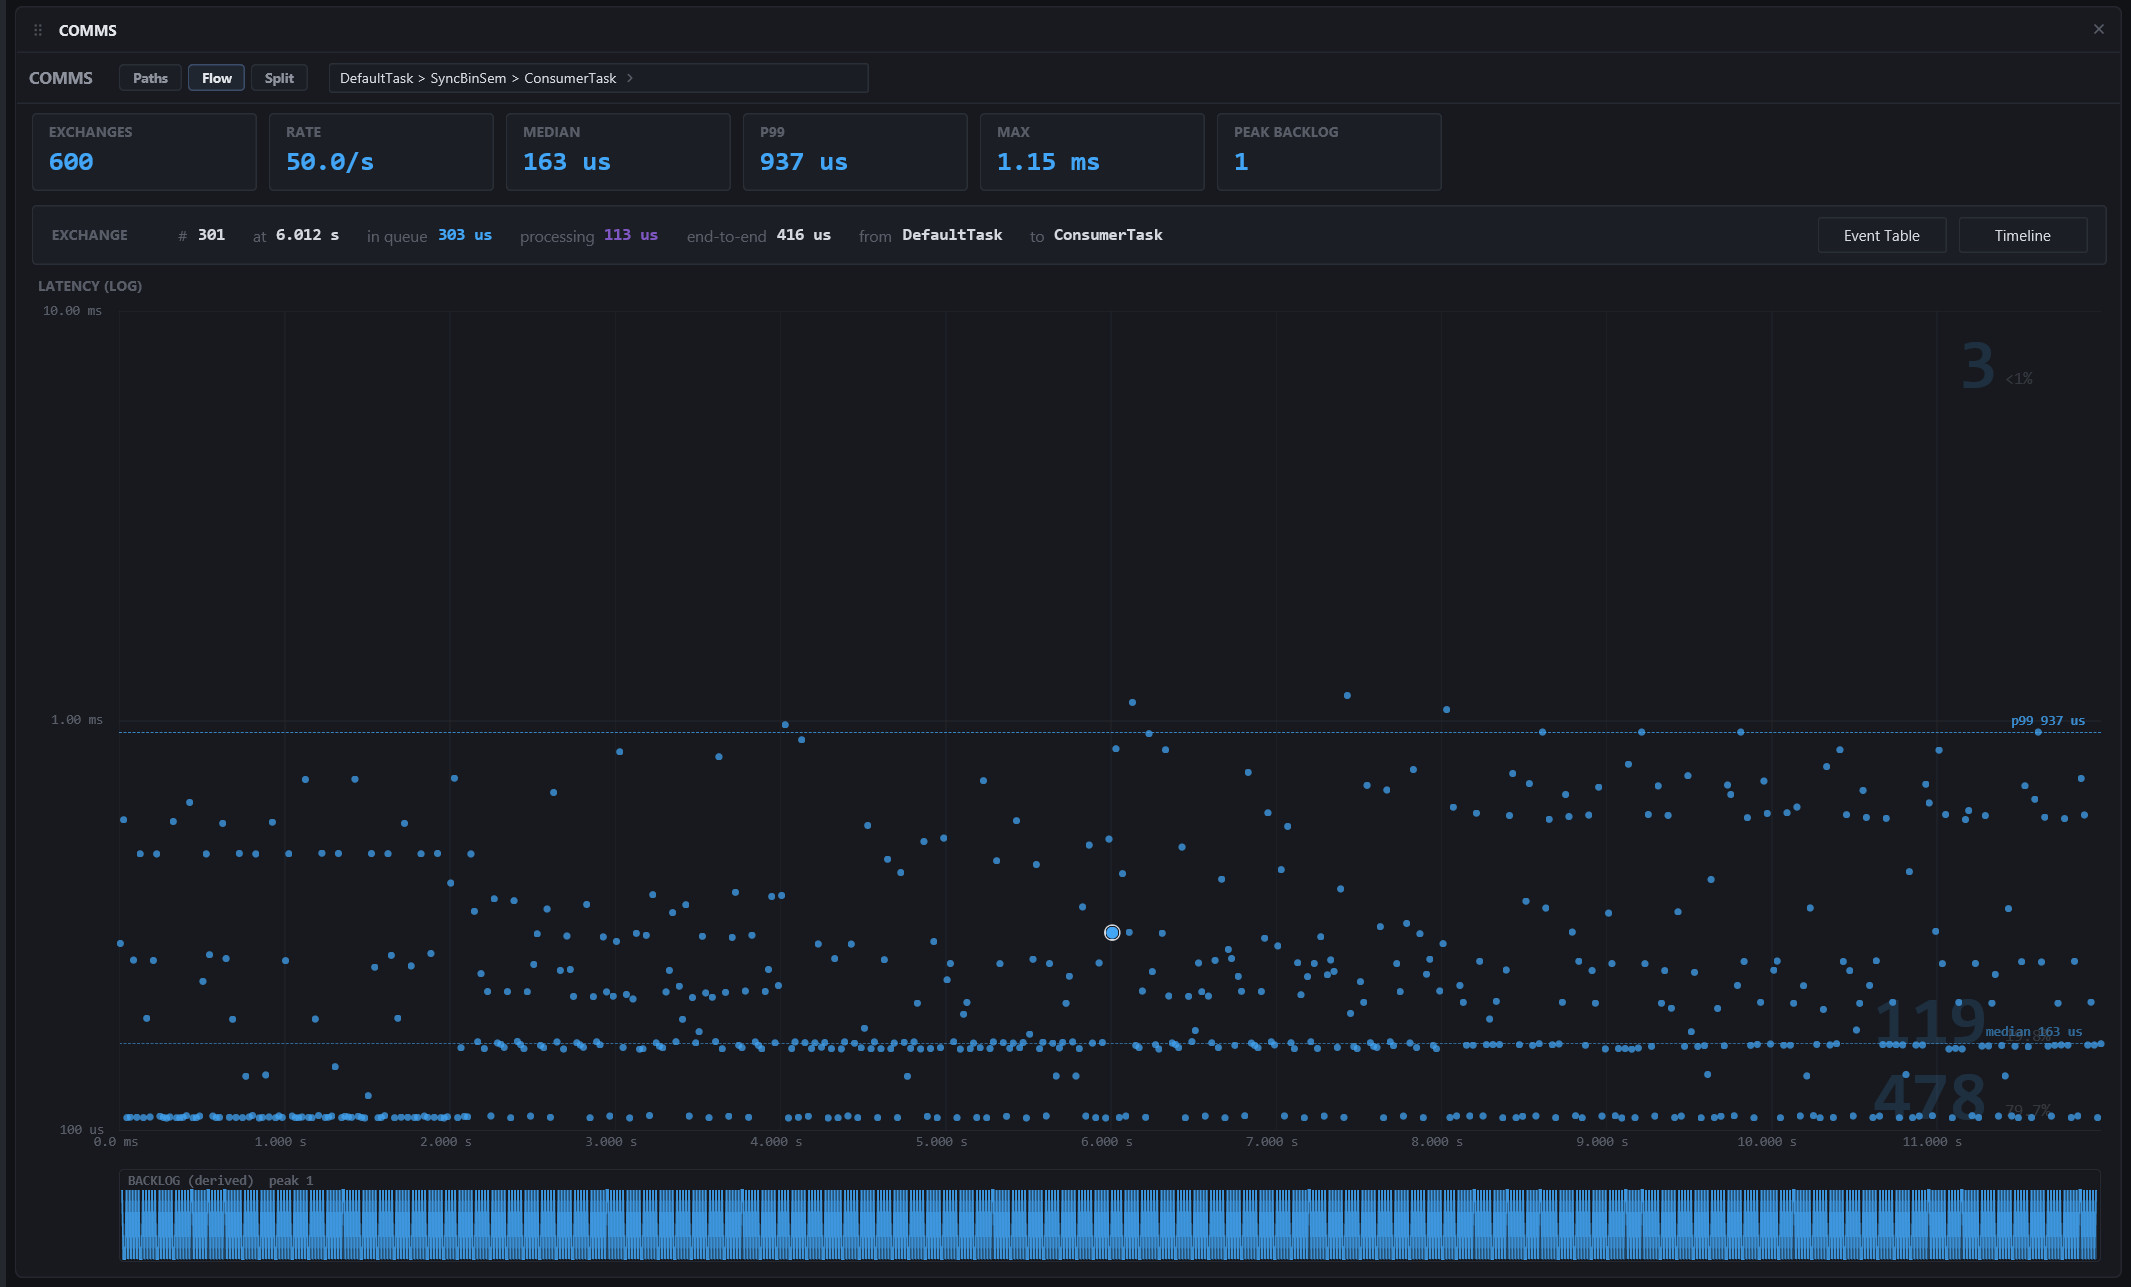
Analytics for one path over the whole capture. Pick the path in the selector next to the view pills, or arrive from the Paths inspector.
- Tiles: exchanges (holds for a mutex), rate, median, P99, max, and peak backlog, contentions for a mutex, or how many exchanges happened at the backlog peak. They are computed for the visible window, so zooming is region analysis.
- Latency scatter: every exchange as a dot at its send time and its latency on a log scale, so a 20 µs wait and a 1 s stall share one chart. Dashed guides mark the window's median and P99. Exchanges sent at the resource's peak backlog are amber.
- Distribution gutter: counts and percentages to the right of the chart, aligned with latency bands so the dots cannot cover them. Counts cover the visible time window; short panels combine adjacent bands to keep labels apart.
- Backlog strip: the derived pending count under the scatter (how many messages were waiting), on the same window. A mutex path shows its contention instants instead. Its heading shows counts for the visible window and the selected mutex's full recording; an empty strip explicitly says when none were recorded. Failed operations never form successful exchanges, and pairing stops at event-loss boundaries.
- Exchange strip: click a dot and the strip breaks it down: number, time, time in the queue (held, for a mutex; pending, for a notification), processing (the remainder of the consumer's run slice after the receive), end to end, from, to, queue depth at the send, and coalesced notifications. Event Table selects the receive's row; Timeline zooms the Timeline onto the exchange with breathing room and lights up the task that took it.
Wheel zooms the window around the pointer, drag pans, hover moves the shared cursor and highlights the nearest dot with a readout, double-click on empty chart resets to the full capture, double-click on a dot spotlights it in the Timeline and Event Table.
Split
Paths table on the left, flow on the right, correlated:
- clicking a row drives the flow pane;
- zooming the flow pane time-scopes the table: paths with no traffic in the window dim, the status strip says so, double-click the chart to reset;
- with In Flight on, selecting a dot highlights every path that had a message in flight (or a mutex held) during that exchange's wait, which is the question "what else was the system doing while this message waited".
Tips
- A path with a large max but a small median is one long stall, not a slow path; the scatter shows it as a single high dot, and its gutter count will read
1. (no task context)as a producer means the send happened from an interrupt or a scheduler gap; it is kept, not dropped.- Still-pending counts at the end of a capture are messages the capture ended before their receive, not losses.