 DOCS/BKPT DEBUG/DATA SOURCES, TIMESTAMPS, AND PERFORMANCE
BKPT DEBUG · VS CODE
DOCS/BKPT DEBUG/DATA SOURCES, TIMESTAMPS, AND PERFORMANCE
BKPT DEBUG · VS CODE
Data sources, timestamps, and performance
Before interpreting a graph or event, ask two questions: “who produced this value?” and “what does its time mean?” BKPT shows small source badges in the debugging and trace views. Hover a badge for the details the producer actually supplied.
Choose the right observation
| YOUR QUESTION | START HERE | WHAT THE RESULT MEANS |
|---|---|---|
| What is this variable at this breakpoint? | Variables, Registers, or a peripheral halt snapshot | A value read after the CPU stopped |
| How does this value change while running? | Symbols / Traces or peripheral polling | Samples at probe-read times; intermediate changes may be missed |
| Which CPU write changed it? | Data watchpoints, write | A hardware-assisted stop on the watched location |
| What CPU accesses happened without stopping? | DWT Trace in Symbols or Peripheral Registers | Matching access events delivered through SWO |
| What did firmware print? | ITM Console | Bytes firmware explicitly wrote to enabled stimulus ports |
| Where does the CPU spend time? | PC Sampling | A statistical profile, not a complete instruction trace |
| What path executed before a stop? | ETM History on a supported target and sink | Decoded execution history, with capture limits and gaps |
Read the source badges
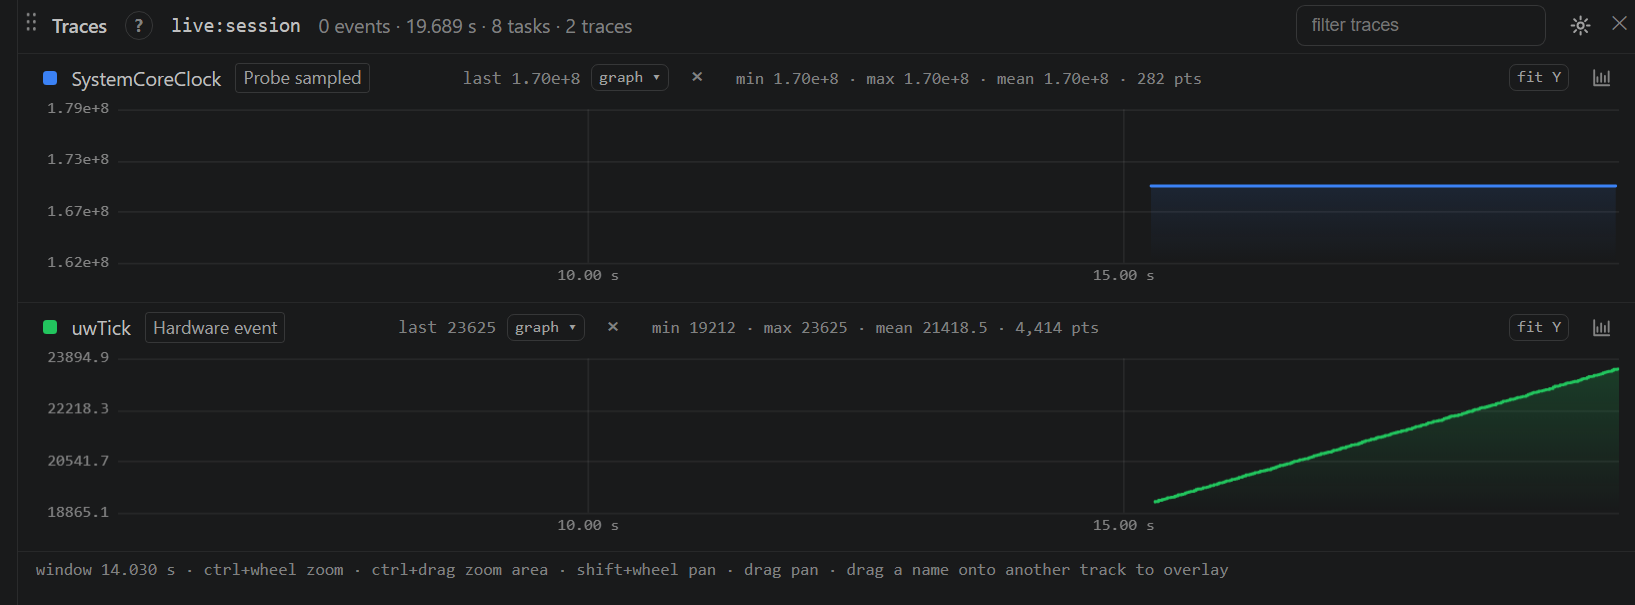
| BADGE | MEANING | IMPORTANT LIMIT |
|---|---|---|
| Hardware event | On-chip debug/trace hardware observed an event, such as a DWT access or exception | DWT watches CPU accesses; DMA and autonomous peripheral changes need not emit one |
| Probe sampled | The host/probe periodically read a value or sampled PC | Adds debug-bus traffic and can miss activity between samples |
| Halt snapshot | The debugger read after a genuine stop | The CPU is halted, but DMA/peripherals may still change unless separately frozen |
| Firmware generated | Firmware explicitly emitted data, such as ITM text or recorder events | Transporting it through hardware does not turn it into a hardware-generated event |
| Source unknown | The producer or older recording did not provide source metadata | Do not infer accuracy or a loss-free capture from missing metadata |
POLL and DWT are compact mechanism labels in peripheral/acquisition controls. Halt and Trace in Data watchpoints say what an address match will do. Saved / Pending / Armed / Error say whether the request was accepted. These labels answer different questions and can appear together.
Changing a watch from polling to DWT does not relabel its old points as hardware events. BKPT keeps observation provenance with the buffered data. A paused snapshot does not extend a running graph as if the firmware were still being sampled.
What a timestamp means
The hover may show these timestamp-source names:
| SOURCE | INTERPRETATION |
|---|---|
| host-reply | Host time when a read reply arrived, including transport delay |
| host-poll-sweep | Host timing for a polling sweep; values in a sweep are not necessarily simultaneous |
| host-bucket | Host-arrival activity grouped into time buckets, such as sampled function lanes |
| decoder | Time supplied by the trace decoder; read the accompanying detail and trace health |
| recording | Time supplied by a recording; accuracy depends on the capture's clock and metadata |
| unknown | No trustworthy timestamp-source detail was supplied |
Requested interval is the rate you asked for. Actual interval is the measured/delivered interval when available. Probe traffic, USB delivery, and host scheduling can make them differ. unknown means unreported, not zero or “exact.” DWT tracks aligned with host activity are approximate; do not subtract cross-source timestamps and call the result precise latency.
The ITM Timestamps dropdown controls generation of local timestamp packets on the target. It does not make all events in all views share a perfect clock. Local timestamps may be delayed, and the live console's numeric time alone does not establish precise per-character timing.
Loss, overflow, and health
Dropped samples and overflow refer to the named series or stream scope. A stream-wide overflow says the shared transport lost information; it cannot identify exactly how many values one graph lost. “None reported” describes the available counters; it is not proof that every physical event was captured. Missing counters remain unknown.
In Hardware Trace, inspect SWO load and the overflow, rejected, clipped, resync, and corrupt-byte counts. A degraded stream can still draw plausible graphs and event counts. Reduce the enabled sources, lengthen the PC sample interval, reduce firmware output, or adjust the supported SWO rate before using such a capture to compare counts or timing.
Events: retain first, display when opened
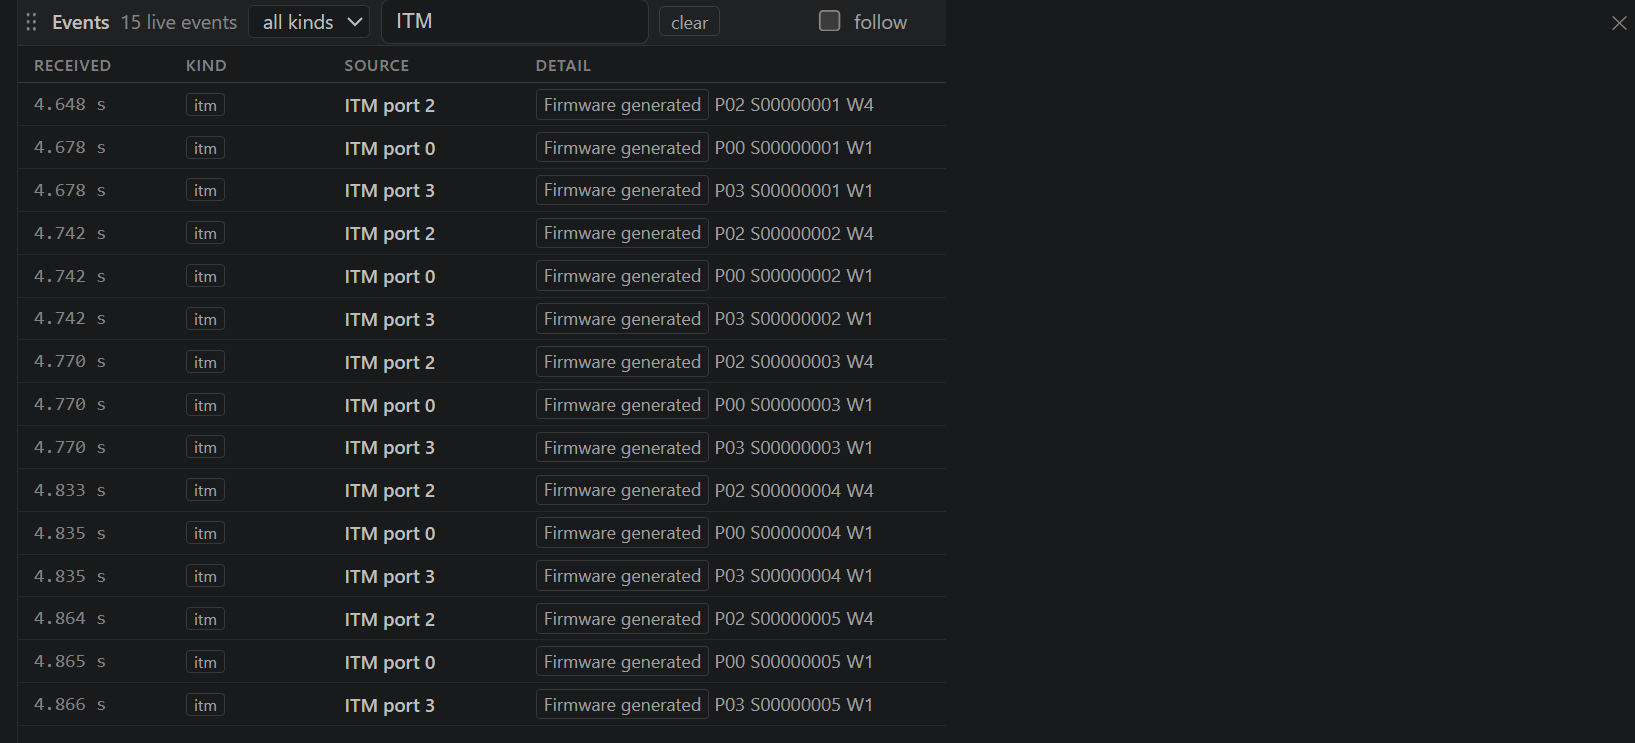
Open Views → Events to inspect collected debug events. Use its search and kind filter to narrow the list, and follow to track new rows. Selecting a navigable event reveals its relevant source/view. An ITM event opens the matching console port and selects its line, including when a different port was previously filtered.
| CONTROL OR COLUMN | HOW TO READ IT |
|---|---|
| all kinds | Show every kind, or choose a kind already present in the buffer: session, ITM, PC sampling, exception, trace, fault, or ETM activity |
| search… | Match text in the kind, source, detail, or event key; combines with the kind filter |
| received | Time since the journal reset, measured when the webview received the event. This is host arrival time, not target execution time. |
| source / detail | The source and event description; hover the row for producer timing and provenance when supplied |
| ×N in a detail | Repeated activity was coalesced into one row; the row count is not necessarily the number of underlying events |
| follow | Stay at the latest rows. Scrolling away from the bottom turns it off. |
| clear | Discard retained journal rows; active sources can immediately add new ones |
The live debug Events list retains the latest 20,000 rows in a bounded buffer. Closing and reopening it keeps retained data and its filter, selection, and position. Older rows roll off as the buffer fills; this is not unlimited archival storage. A recording has its own data and limits. Clearing the view is a local display/data-buffer action, not a command to erase target memory.
Keep VS Code responsive
- Hide tiles you are not using. Closed views do not draw their contents; hidden layouts suspend presentation frames. Timeline preparation and offscreen graph work are deferred until needed.
- Hiding is not disabling acquisition. An enabled poll watch still uses the probe, and an enabled hardware trace source still produces data. Turn off the source or remove/disable its watch to stop that work.
- Globals and variable children load on demand. Keep expression watches focused on the values you need; they are evaluated while the inspection is visible and halted.
- Lower polling rates when a value changes slowly. Requested rate is not a guarantee, especially over a busy or remote probe connection.
- Enable only the DWT/ITM sources needed for the question. PC samples, exceptions, data watches, counters, and text share SWO capacity.
Opening a tile should not require another hardware inventory scan. Run a new Target Scan when the board/probe or trace capability context changes, or when the recovery workflow asks for one.
While paused, unchanged polled values produce one halt snapshot instead of repeated Events rows. Explicit polling can still detect DMA or peripheral changes. Hardware packets buffered before Pause may finish decoding briefly afterward; their arrival does not mean the core resumed.