 DOCS/BKPT DEBUG/DEBUGGING
BKPT DEBUG · VS CODE
DOCS/BKPT DEBUG/DEBUGGING
BKPT DEBUG · VS CODE
Debugging
Run control, breakpoints, the call stack, registers and memory: the debugger's tiles, in the order you use them once the target is halted at main.
- Run control
- Breakpoints
- The Code tile
- Call Stack and locals
- Registers
- Memory
- Evaluate and edit variables
- Reset, restart and stop
- The Target menu
- Known limits
Run control
The strip's icons and the keys do the same things: continue, pause, step over, step into, step out, step one instruction, reset, stop. While the target runs the strip reads running; at a halt it names the reason (breakpoint-hit, end-stepping-range, a pause, a fault) and the status bar shows the frame.
Start and Reset check the selected ELF before automatically running to the configured entry function. A confirmed firmware mismatch cancels that run-to and leaves the target halted with a visible reason. Select the matching ELF, or flash your intended build with your programmer. Attach does not flash. Explicit Continue remains available, but source locations from a mismatched ELF cannot be trusted.
Stepping masks interrupts by default (bkptDebug.maskIsr = auto), so a step lands on the next line of your code instead of inside a handler that happened to fire. Set it to off to step into interrupts, or on to keep them masked across Continue as well.
Breakpoints
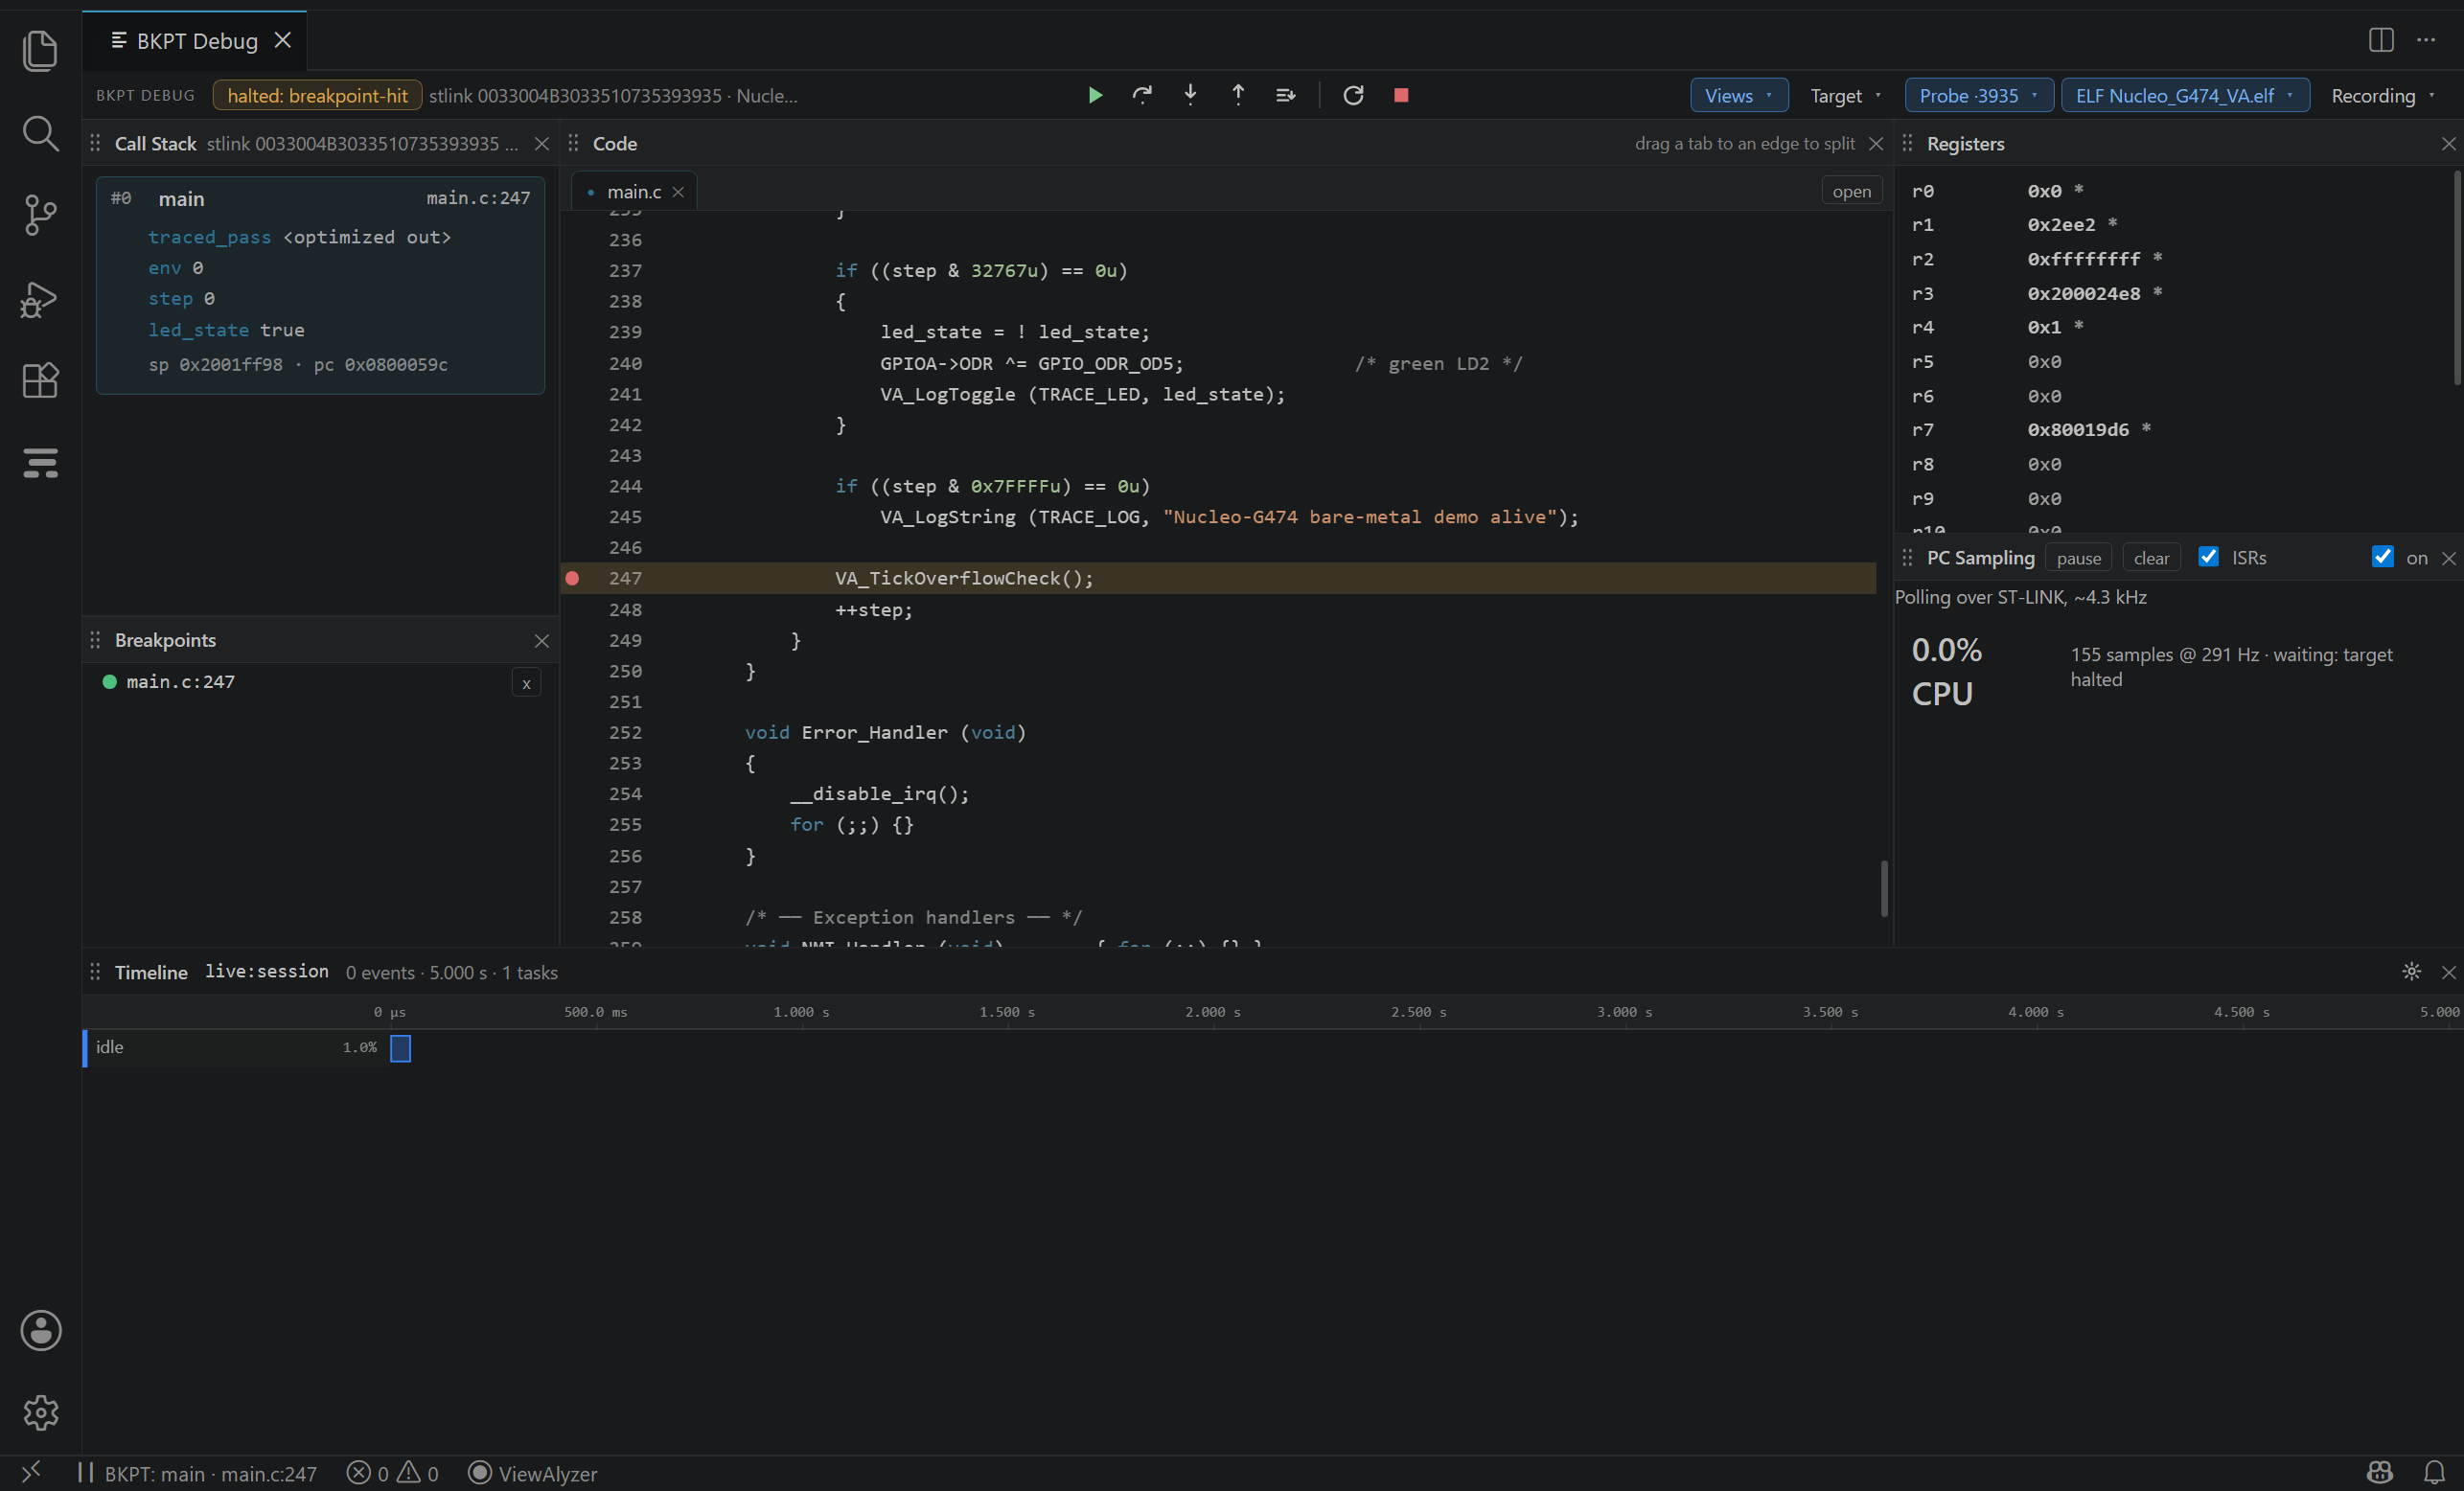
Click a line number in the Code tile (or in a normal editor) to set or clear a breakpoint. Breakpoints are VS Code's own, so they survive between sessions and show in its Breakpoints view too. The Breakpoints tile lists them with the debugger's verdict: bound at an address, pending, or refused (a line with no code). A breakpoint set while the target runs is armed at once; if the target could not be interrupted for it, it is bound at the next halt and says so.
The Code tile
The centre of the layout. It follows the halt: the current line is highlighted, a selected frame is marked in its own colour, and while PC sampling runs each line carries its sample count in the gutter (amber when the line executed within the last second). Click a line number to toggle a breakpoint. Files open as tabs; drag a tab to the tile's edge to split it into groups the way VS Code's editor does, and the arrangement is kept per workspace. Its background is slightly darker than the surrounding tiles.
Right-click a file in Explorer (or its editor tab) and choose Open in BKPT Debug to browse it in the Code tile. This updates the existing layout without opening an intermediate editor tab, including for files already open. It also opens the layout or restores a hidden Code tile without starting a debug session. Unsaved editor changes are mirrored.
Edit in VS Code in the Code tab row opens the file in a normal editor. Ordinary Explorer clicks and editor-tab clicks stay in the normal editor; BKPT Debug does not automatically redirect them or pull focus back.
While the layout is the visible tab, a halt updates the Code tile and does not open editors behind it; close the layout and halts open the file in the editor instead.
Call Stack and locals
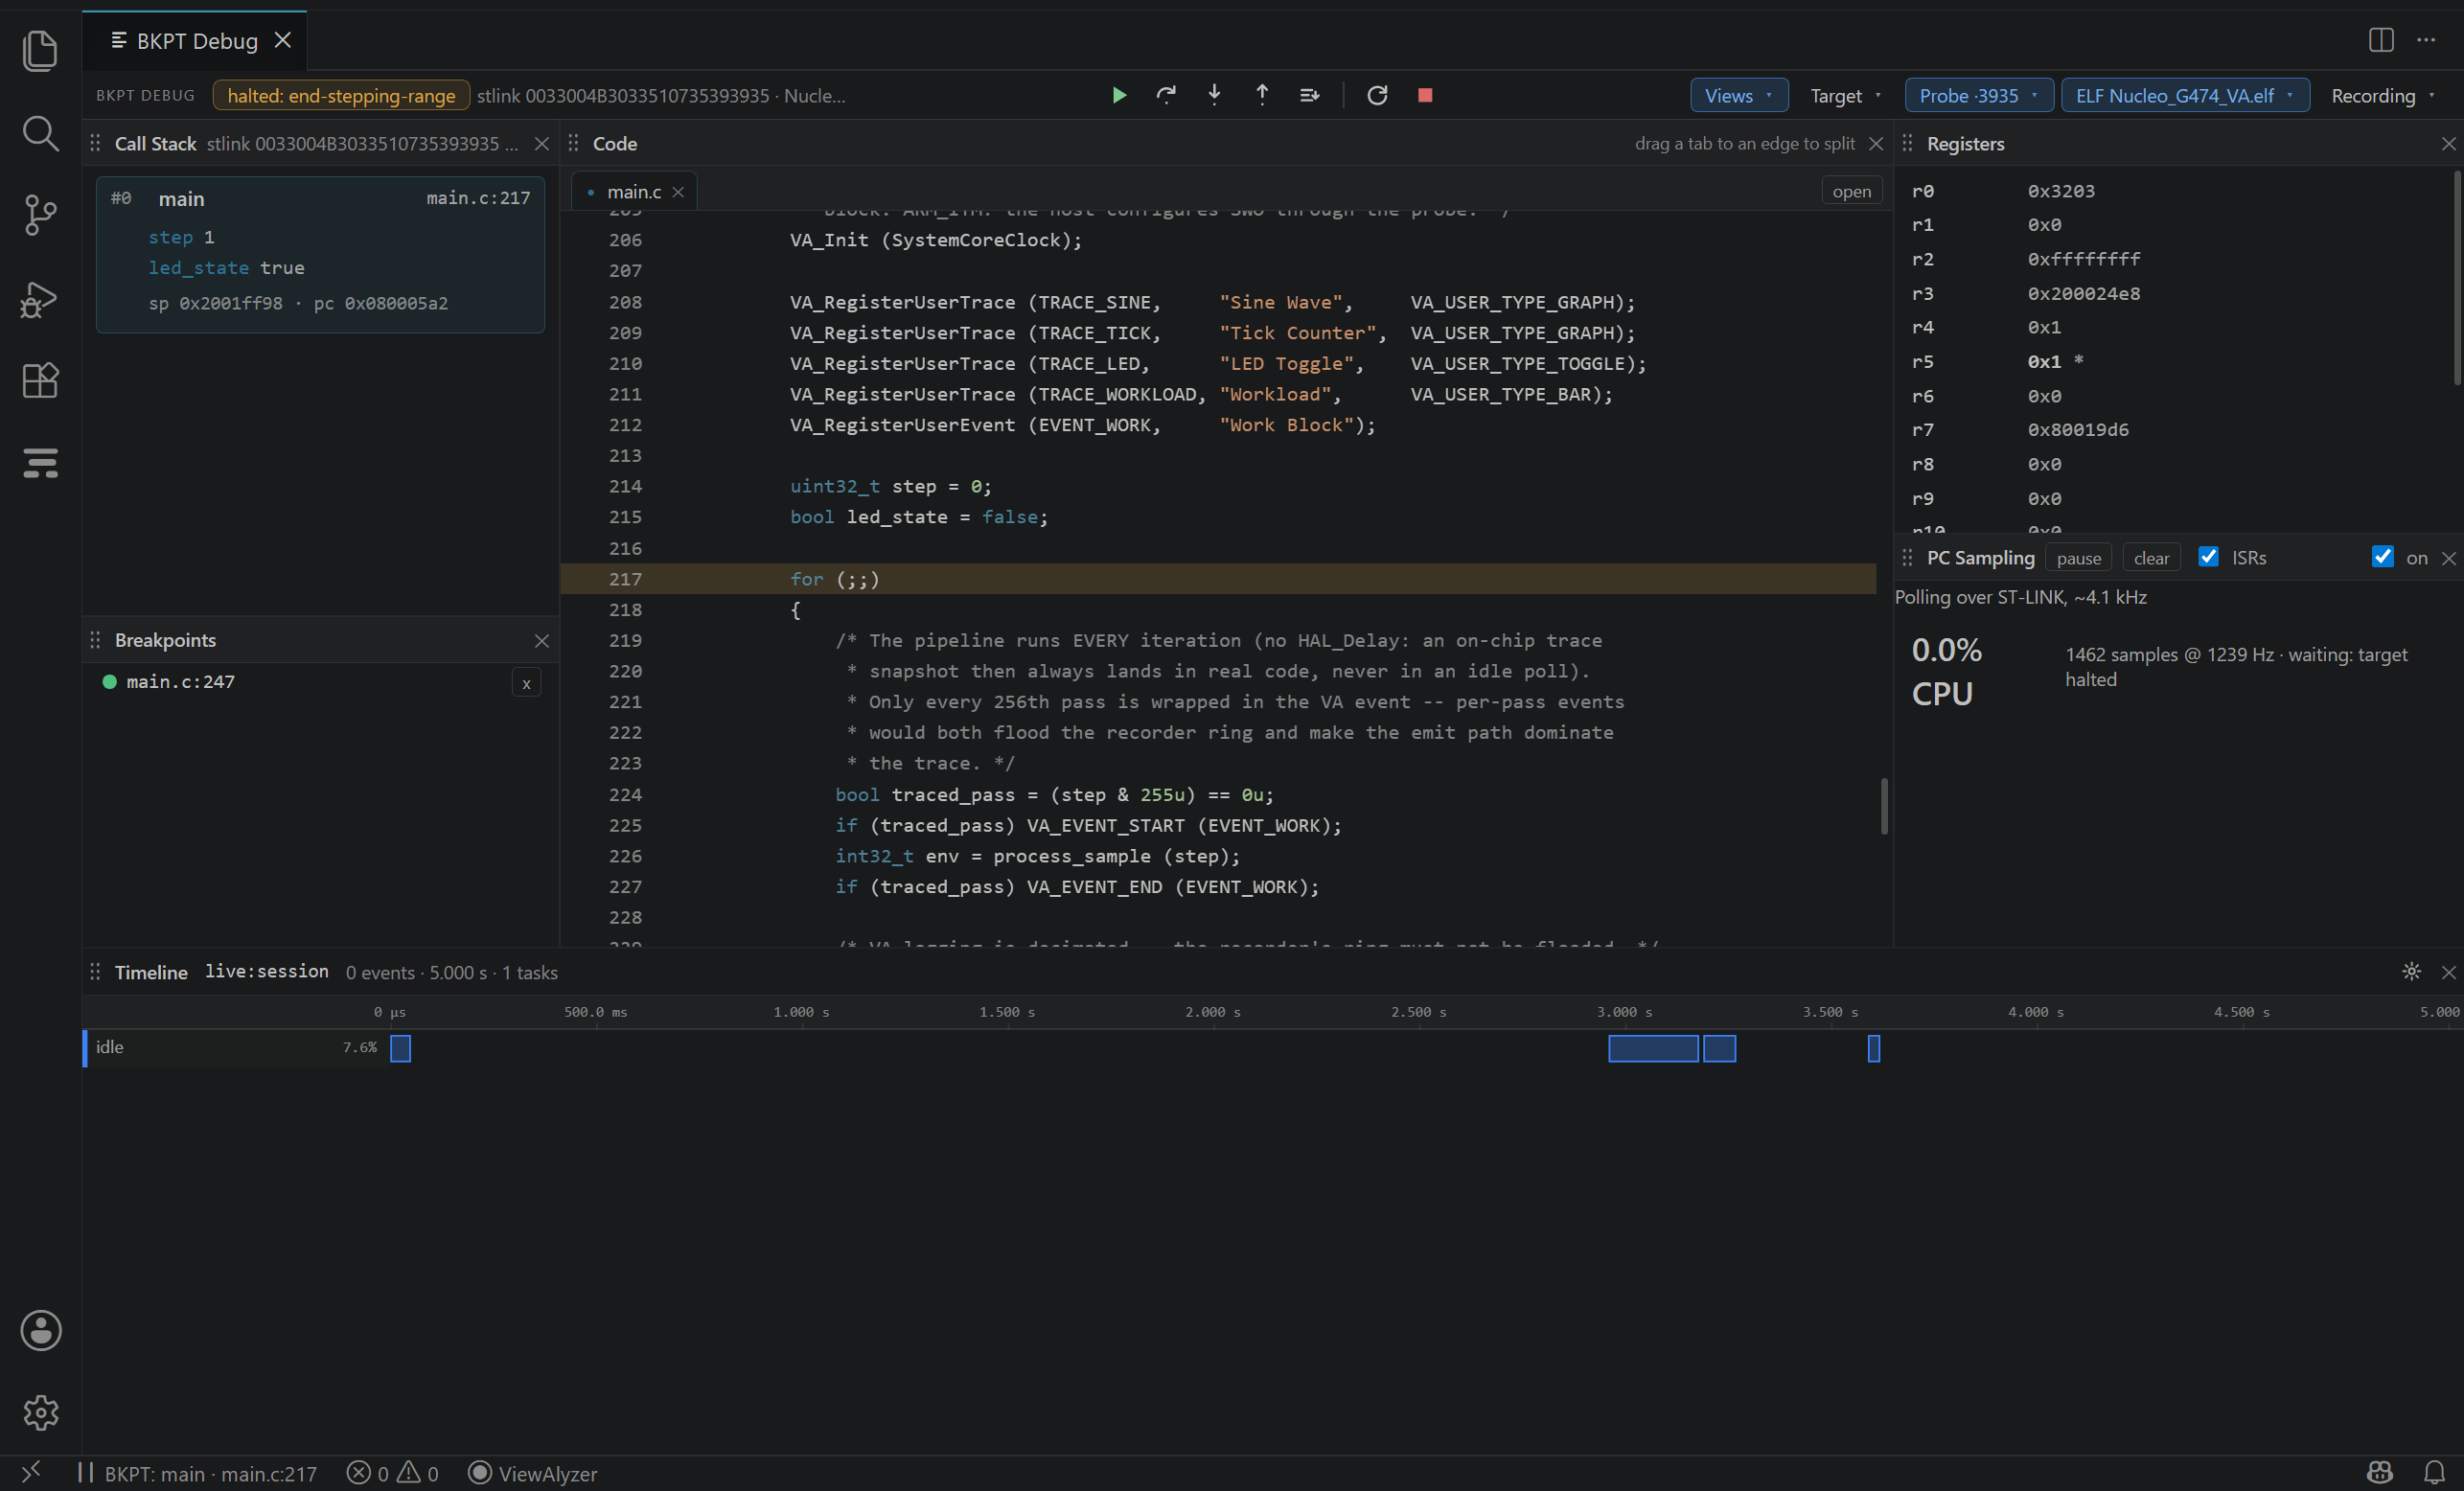
One card per frame (#0 at the top), with the function, file and line, the frame's Variables section, and its sp and pc. Click a frame to select it: the Code tile shows that frame's line and the locals are the frame's. Locals / Args, Globals / Statics, and Expressions cover different scopes. Expand composite values and choose display formats as described in Variables and expressions. <optimized out> means no recoverable value is available at this location; a value held in a register can still be inspected when debug information describes it.
Registers
The core registers as the halt left them, r0 to r12, sp, lr, pc and xpsr, with a mark on every register that changed since the previous halt. The FPU bank folds below on cores that have one, opened when a value in it changed.
Values are Halt snapshots, not a running register stream. Select frame #0 for confirmed physical-register edits; caller frames show unwound context. See variable/register editing.
Memory
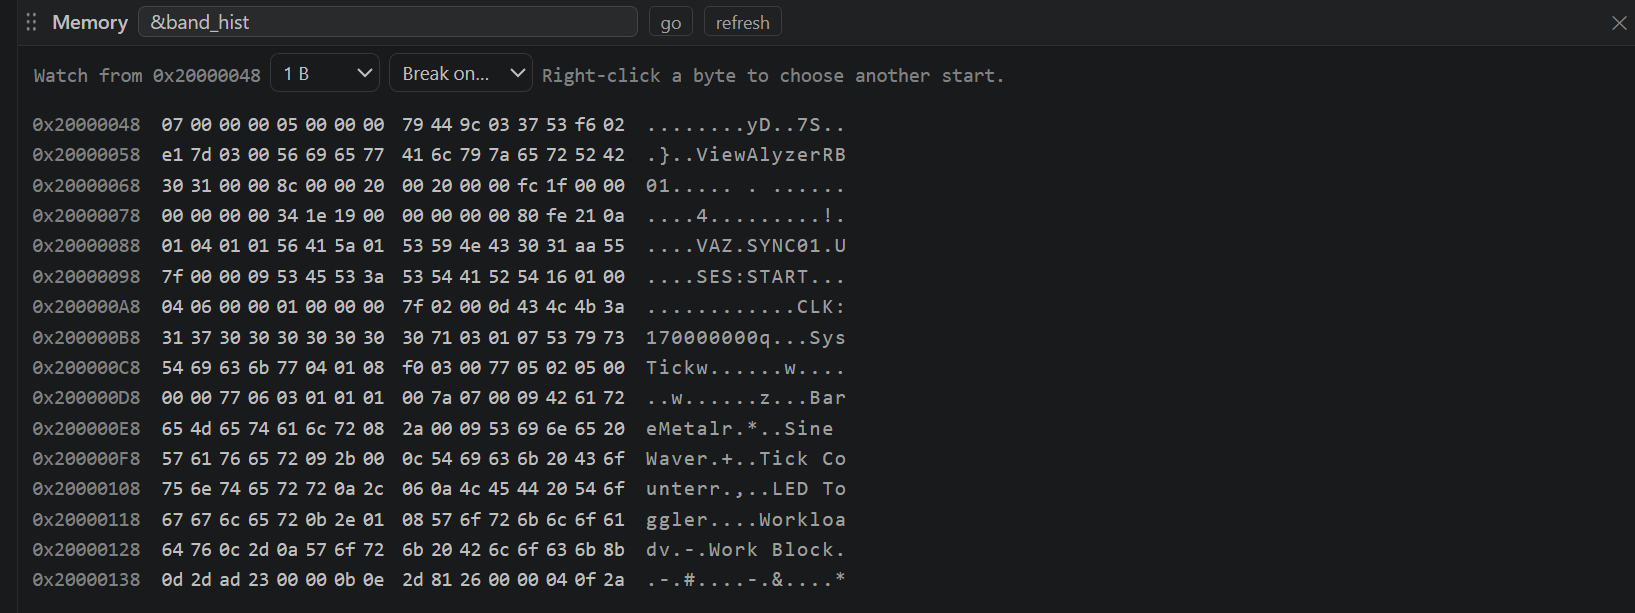
A 256-byte window at any address expression (0x20000000, &rms, $sp), hex and ASCII, re-read at every halt. While the target is halted the bytes are editable in place: click a byte, type the new value, and it is written through the probe.
The byte-count control and Break on… dropdown create a watch at the displayed window's starting address. This is separate from editing a byte. See Data watchpoints for sizes and access kinds.
Evaluate and edit variables
BKPT Debug: Evaluate Expression asks for a gdb expression and shows the value. In the Code tile, right-click a variable for its type and value and to set it in place (locals and globals alike); the Symbols tile does the same for any global in the ELF, with live values while the target runs (see Live watch).
Hover evaluation is also available while halted. Saved expressions, child trees, pointer guards, formats, and confirmed scalar edits are covered in Variables and expressions. Use Source and assembly for Mixed/Assembly mode, instruction breakpoints, and instruction navigation.
Reset, restart and stop
Reset resets the target and runs to main again (bkptDebug.runTo), keeping the session and its breakpoints. Restart ends the session and starts a new one: the live graphs, the sampled lanes and the ITM Console start from zero with it. Stop detaches and normally leaves the target running. It stops the session's polling/decoder and releases owned debug resources. Saved breakpoint/watch intent stays in the project. Cleanup can only be confirmed while the target is reachable; Stop is not a promise to restore every vendor trace/clock register or to undo firmware changes.
Connection loss and recovery
If the probe disappears or target state becomes uncertain, the debugger clears stale live registers, stack, and locals and shows a reason. It does not claim a successful halt or automatically reset/resume unknown hardware.
- Restore the cable/power connection and make sure another tool is not holding the probe.
- Choose Reconnect and Halt. The target is halted with trace off; RAM may have been lost if power disappeared.
- Check the target identity, programmed firmware, ELF, and current stop.
- Choose Restore Debug Setup to restore saved breakpoints and watches. This does not resume execution.
- For trace, Stop and run Scan Target before setting up a new trace session. Then Continue only when you are ready.
After a forcibly killed debugger process or unreachable target, hardware cleanup may be incomplete. Follow the visible recovery guidance rather than treating retained values or badges as current measurements.
The Target menu
For J-Link, enter the MCU's name from SEGGER's supported-device list in Target device. It is saved per workspace and cannot be changed during a session. ST-Link does not use this setting, so its field and SEGGER hint are hidden. A saved J-Link device name is retained when you switch probes.
Target in the strip scans the connected core with the bundled probe tool: the CoreSight components it finds (DWT, ITM, FPB, TPIU, ETM) and what they mean for you, as verdicts: PC sampling available, DWT data watch with N comparator slots, ETM trace and where its sink is. It also reports the probe's SWO receiver ceiling, shown next to the SWO clock field. The verdicts feed the Hardware Trace tile's decisions and the Symbols tile's DWT slots. The scan needs the probe to itself, so it runs between sessions.
Known limits
- The extension does not program the target. Flash with your vendor tool and select the matching ELF; unexpected source locations or unbound breakpoints can indicate a mismatch.
- Locals and hover require a halted target and usable debug information.
- The Target thread selector is GDB scope selection; RTOS task discovery and saved-task stack unwinding are not implemented here.
- One session at a time, one core: multi-core parts are debugged one core per window.