 DOCS/BKPT DEBUG/PC SAMPLING
BKPT DEBUG · VS CODE
DOCS/BKPT DEBUG/PC SAMPLING
BKPT DEBUG · VS CODE
PC sampling
Turn it on and the debugger samples the program counter over the probe while the target runs: a statistical profile with no firmware instrumentation. Probe polling adds debug-bus traffic; on-chip sampling uses trace bandwidth. It answers "what is the CPU doing right now" without stopping it.
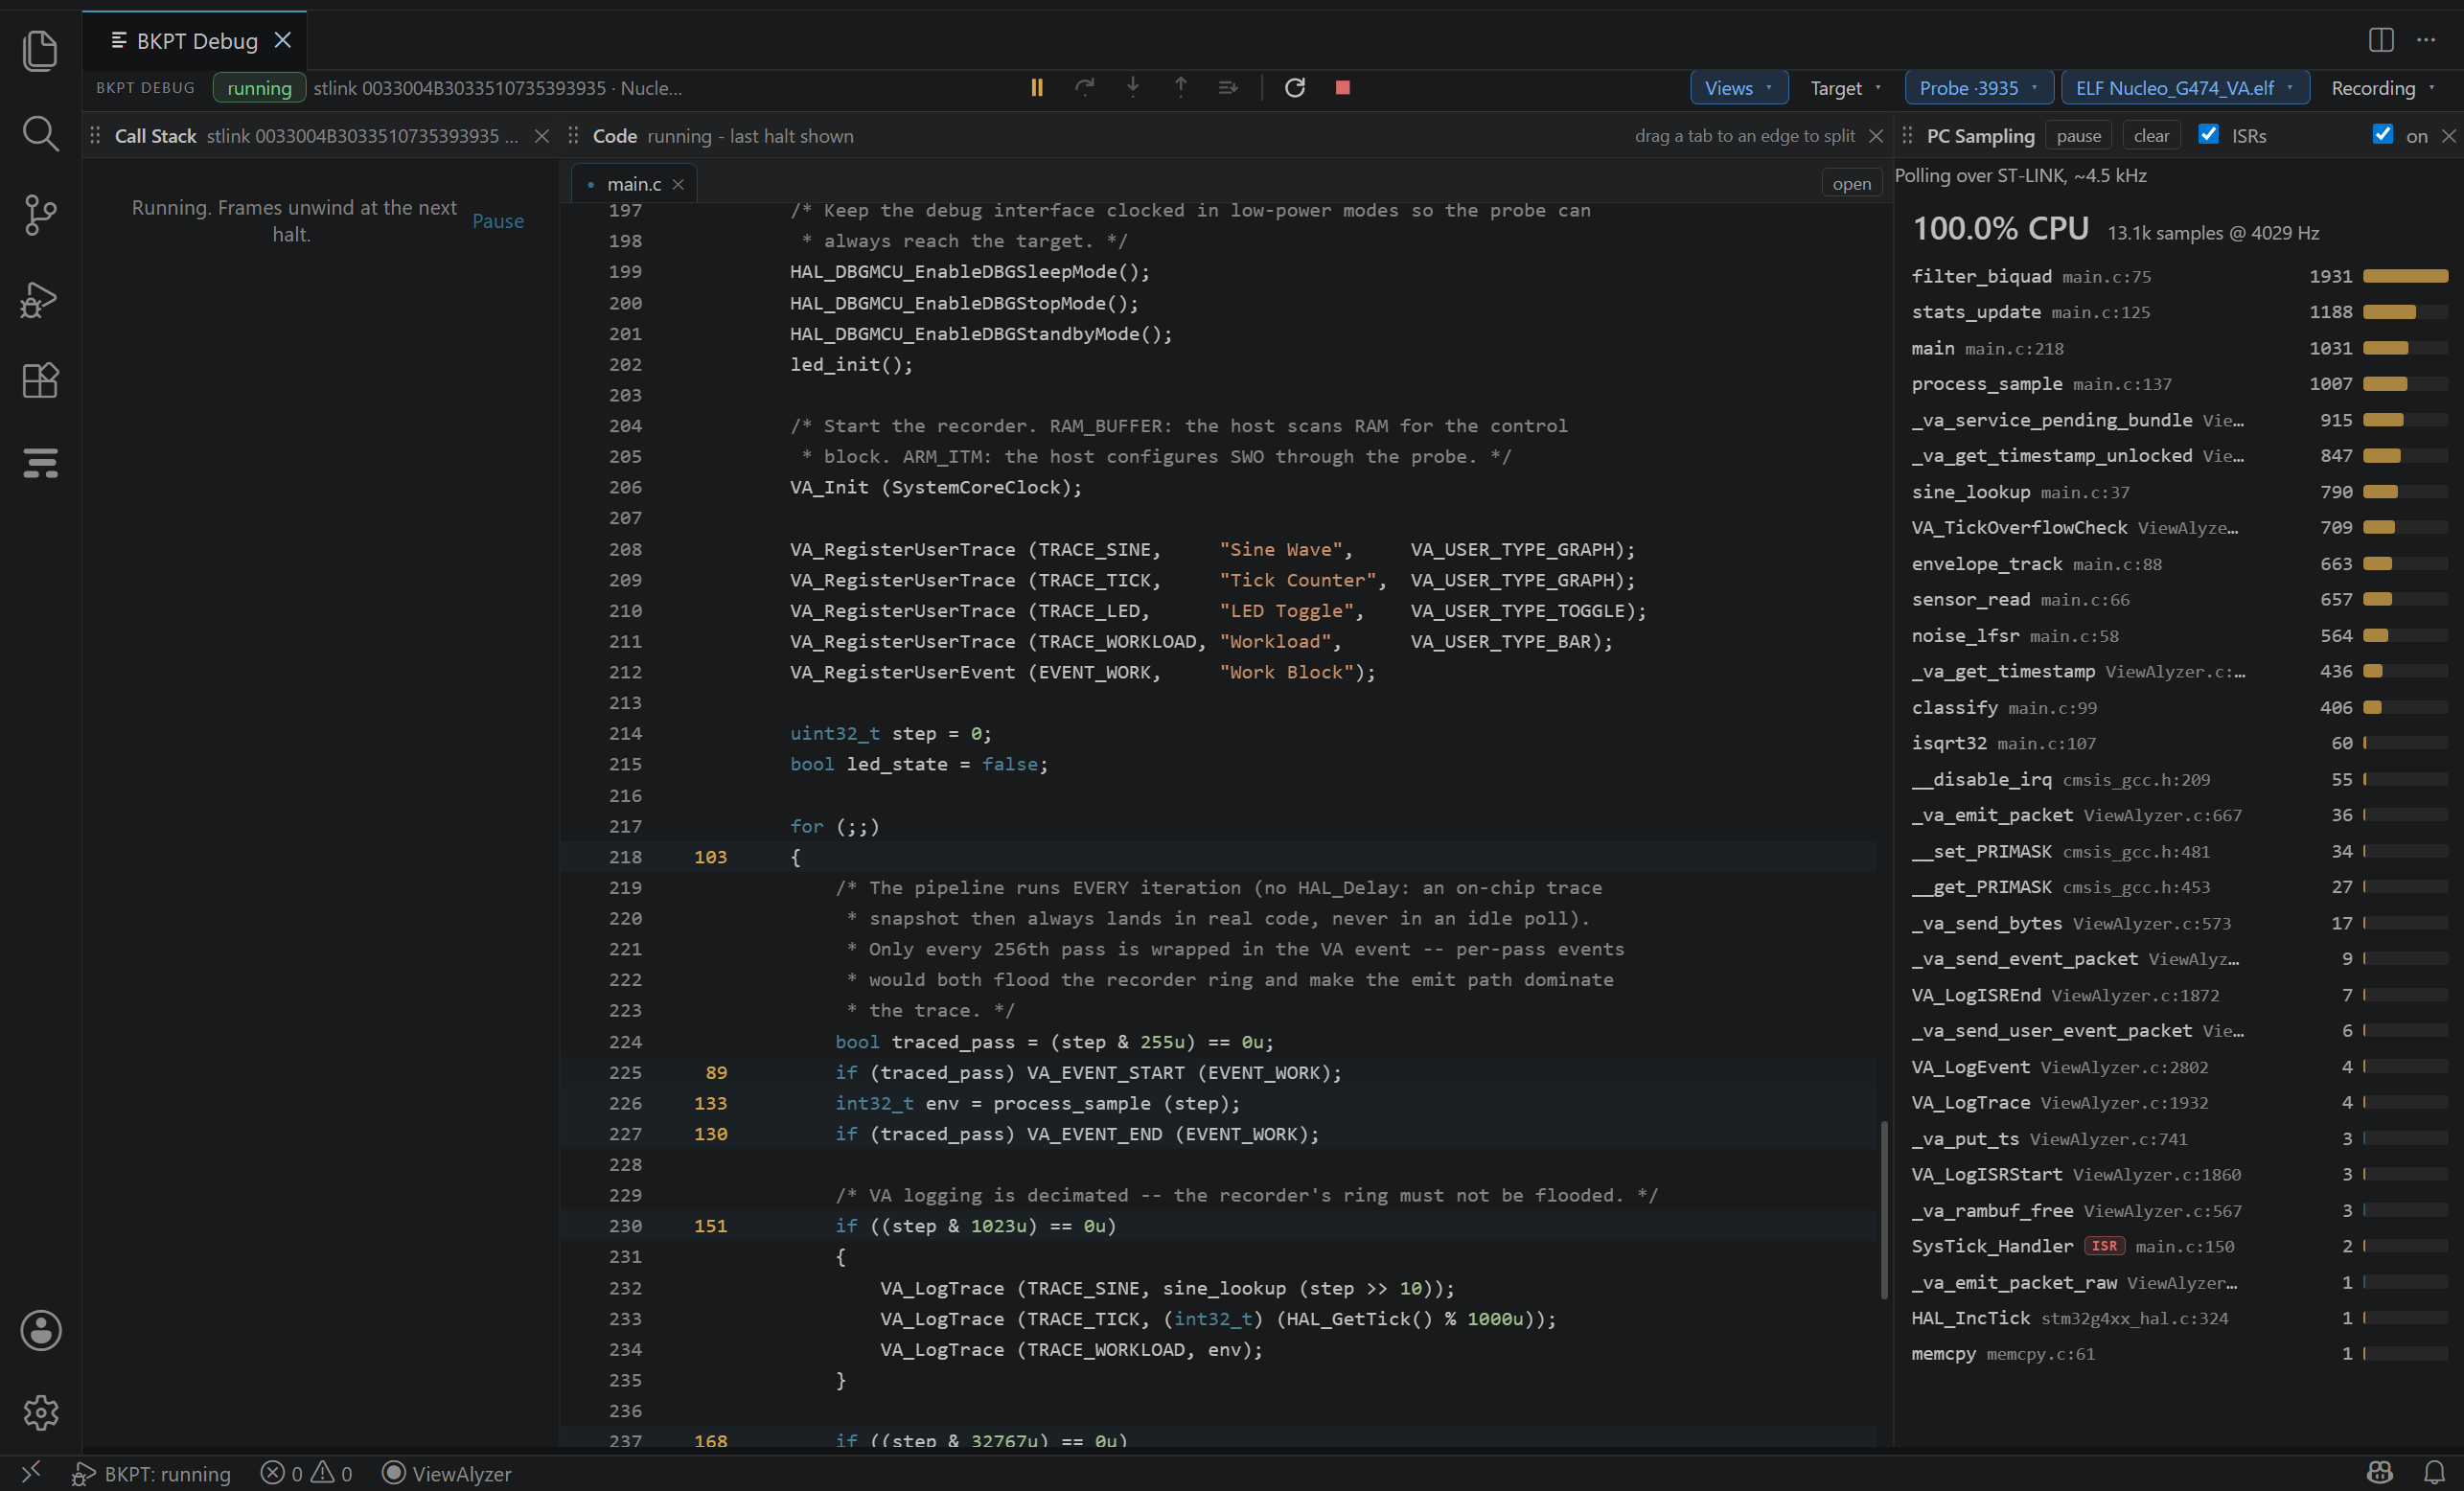
Needs: a running session. Open Hardware Trace → ITM & DWT and select Sampling, or select On-chip trace and enable its PC sampling checkbox. The PC Sampling tile's on switch / BKPT Debug: Toggle PC Sampling also controls sampling. Function names need a matching ELF. The default capture mode is Off, so an empty profile in a new workspace is expected until you enable it.
The PC Sampling tile
- The header line names the source and the rate:
Polling over ST-LINKat a few thousand samples per second, or on-chip sampling over the SWO pin when the Hardware Trace switch chose it. - CPU load: the share of samples that did not find the core asleep (WFI / WFE), over a rolling window. This is an estimate from samples, not a scheduler-accounted utilization measurement. The same figure the ViewAlyzer app computes.
- The function table: one row per function, its samples and share, with an ISR badge on interrupt handlers (found in the ELF's vector table) and a switch to include or exclude them. Click a row to open the function in the Code tile at its hottest line.
- pause freezes the profile counts to read them; it is distinct from the main run-control Pause, which halts the target. clear starts the profile counts over.
The gutter
Every line that was sampled carries its count in the Code tile's gutter (and in normal editors of the same file). A line that executed within the last second is amber, so a running firmware shows you where it is right now.
The timeline
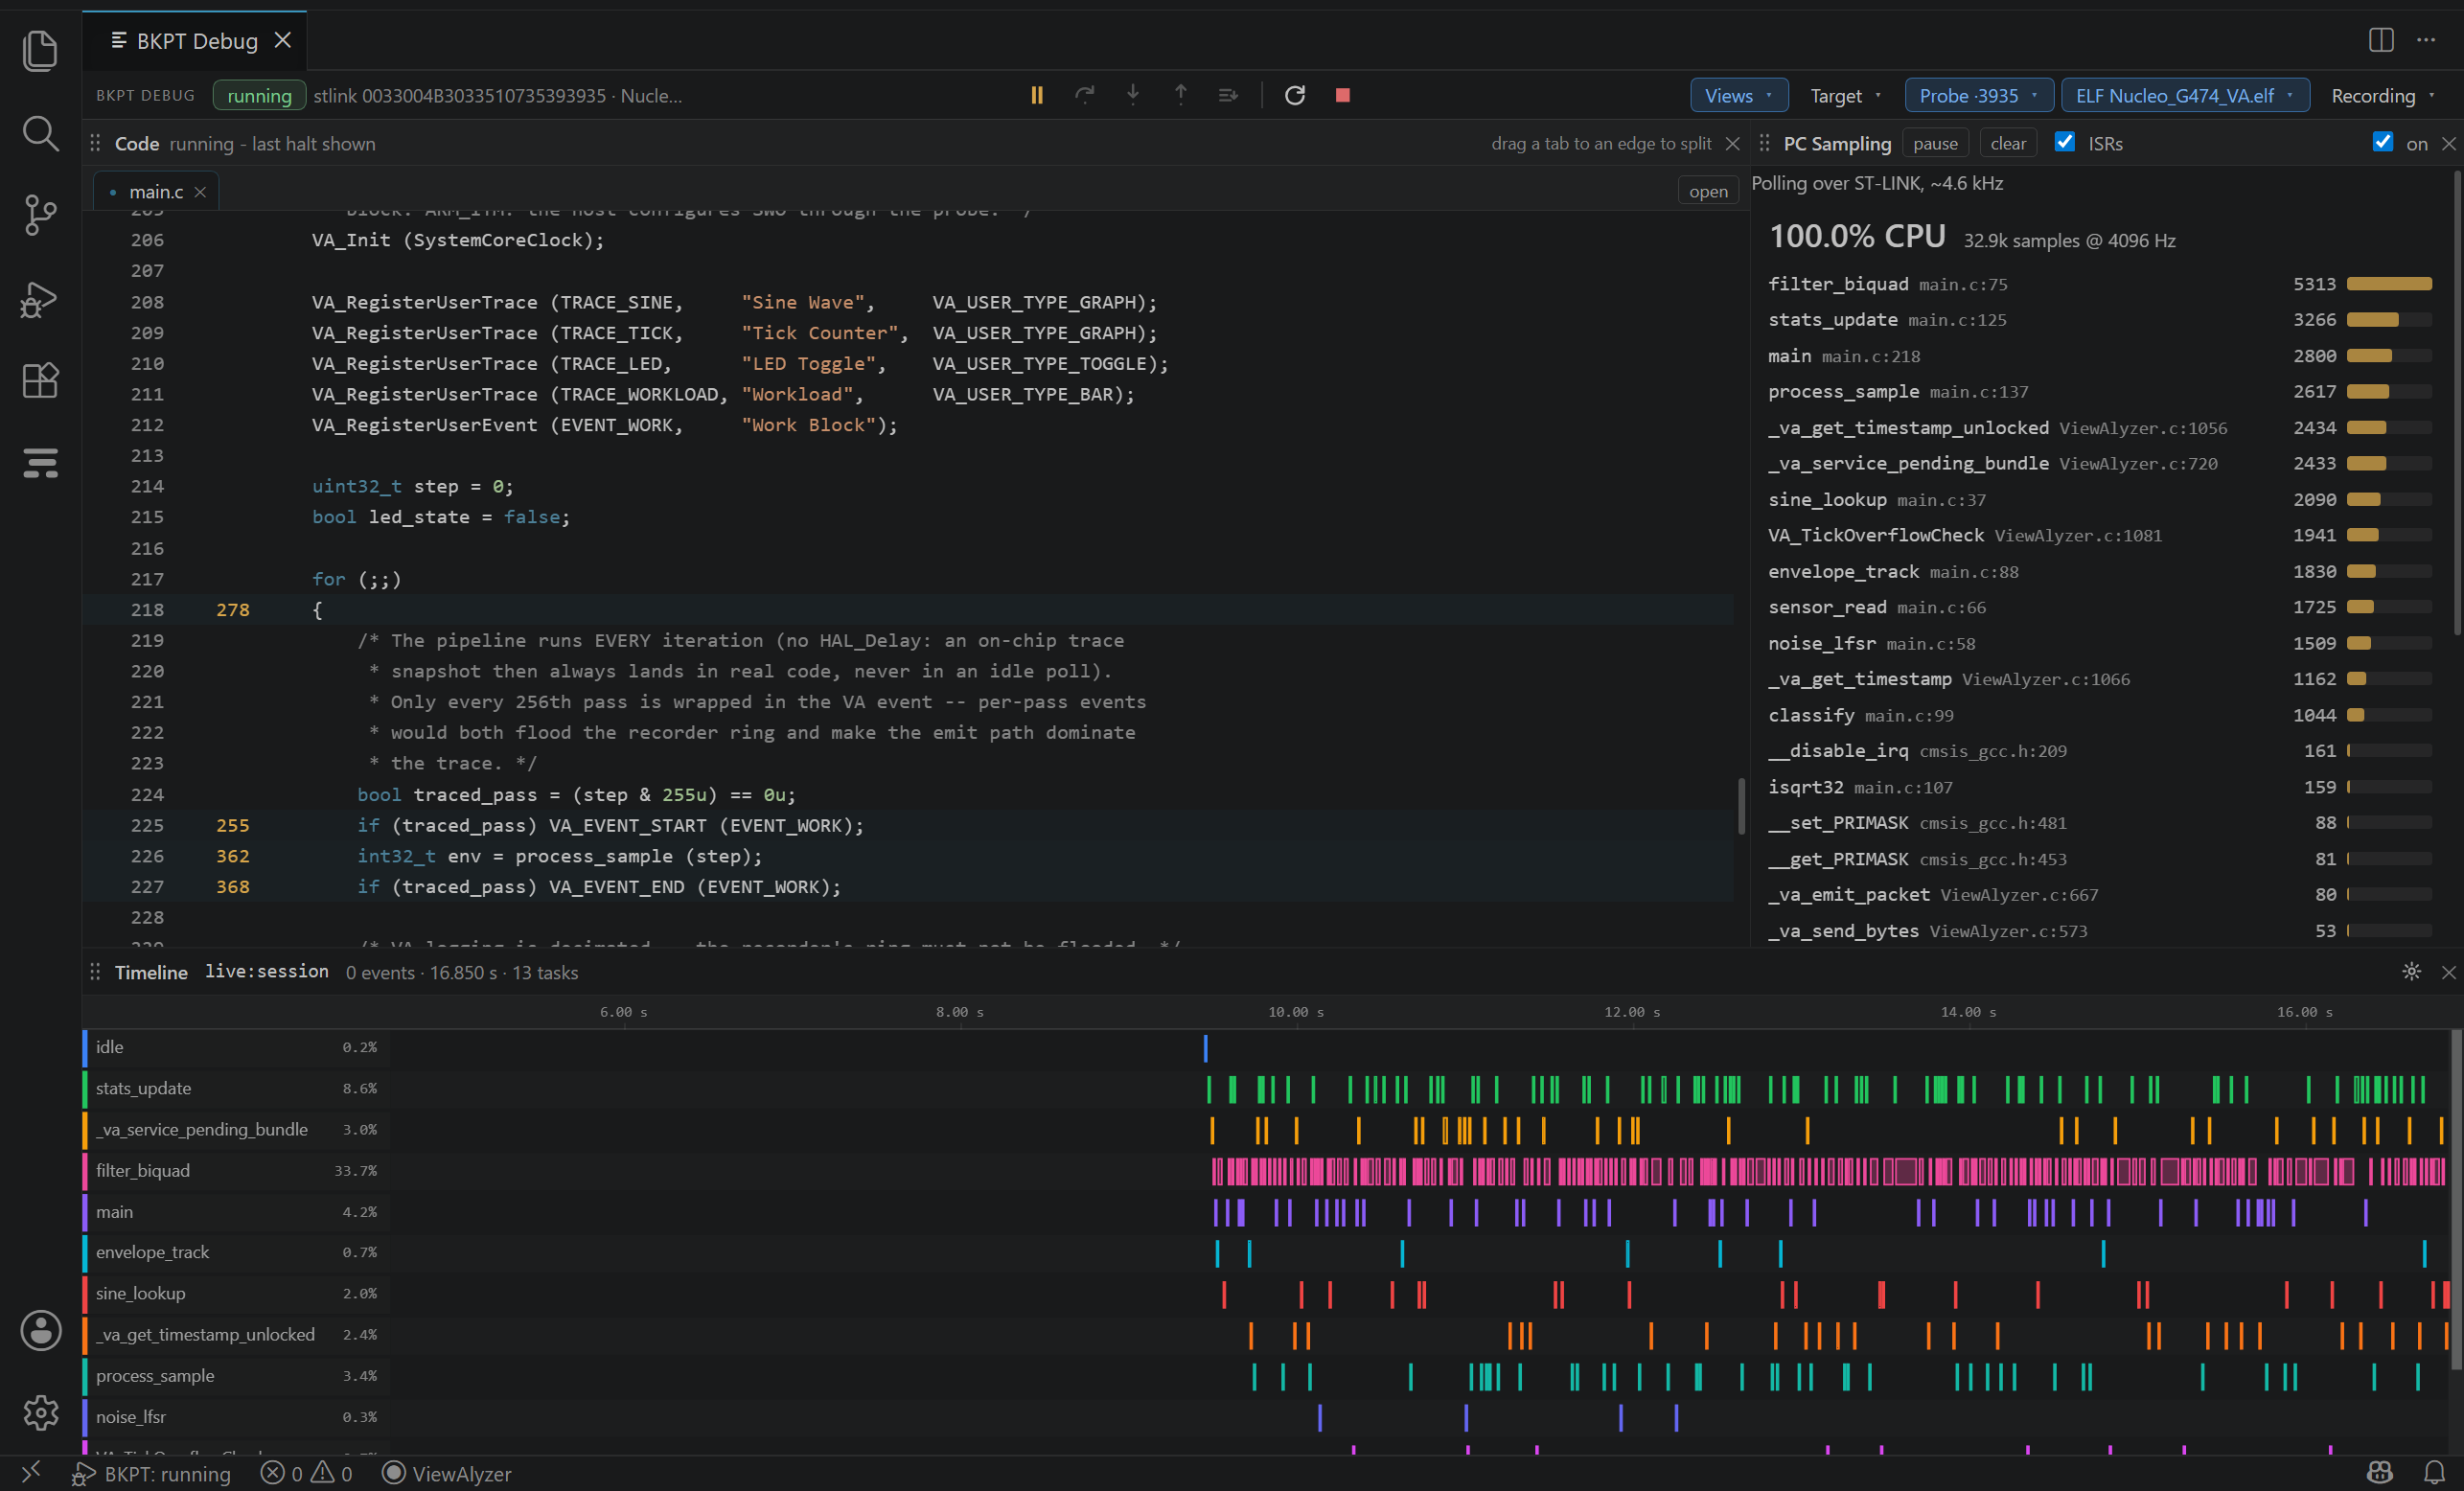
With the Timeline tile shown during a session, the samples are bucketed into 10 ms slices and drawn as lanes, one per function, idle when the core mostly slept. It reads like a task timeline, and it is statistical: a lane says which function dominated a slice, never that a switch happened at that instant.
The source badge identifies Probe sampled or Hardware event as appropriate, while timestamp details explain host-arrival bucketing. Even on-chip PC samples do not turn these lanes into exact task switches or continuous execution history. Closing Timeline defers its drawing; the enabled sampling source continues collecting.
Tips
- Polling rate depends on the probe and connection. For on-chip sampling, the selected cycle interval and clock set the nominal rate.
bkptDebug.pcSamplingUpdateMsonly sets how often aggregated counts reach the views. - A handler that runs for a few microseconds every second will rarely be sampled. For interrupt timing use the Exception Trace over SWO or a recording.
- A large share outside named functions can mean missing symbols, execution in boot ROM or another image, or an ELF/firmware mismatch. Verify the image before interpreting source-level percentages.