 DOCS/BKPT DEBUG
BKPT DEBUG · VS CODE
DOCS/BKPT DEBUG
BKPT DEBUG · VS CODE
BKPT Debug
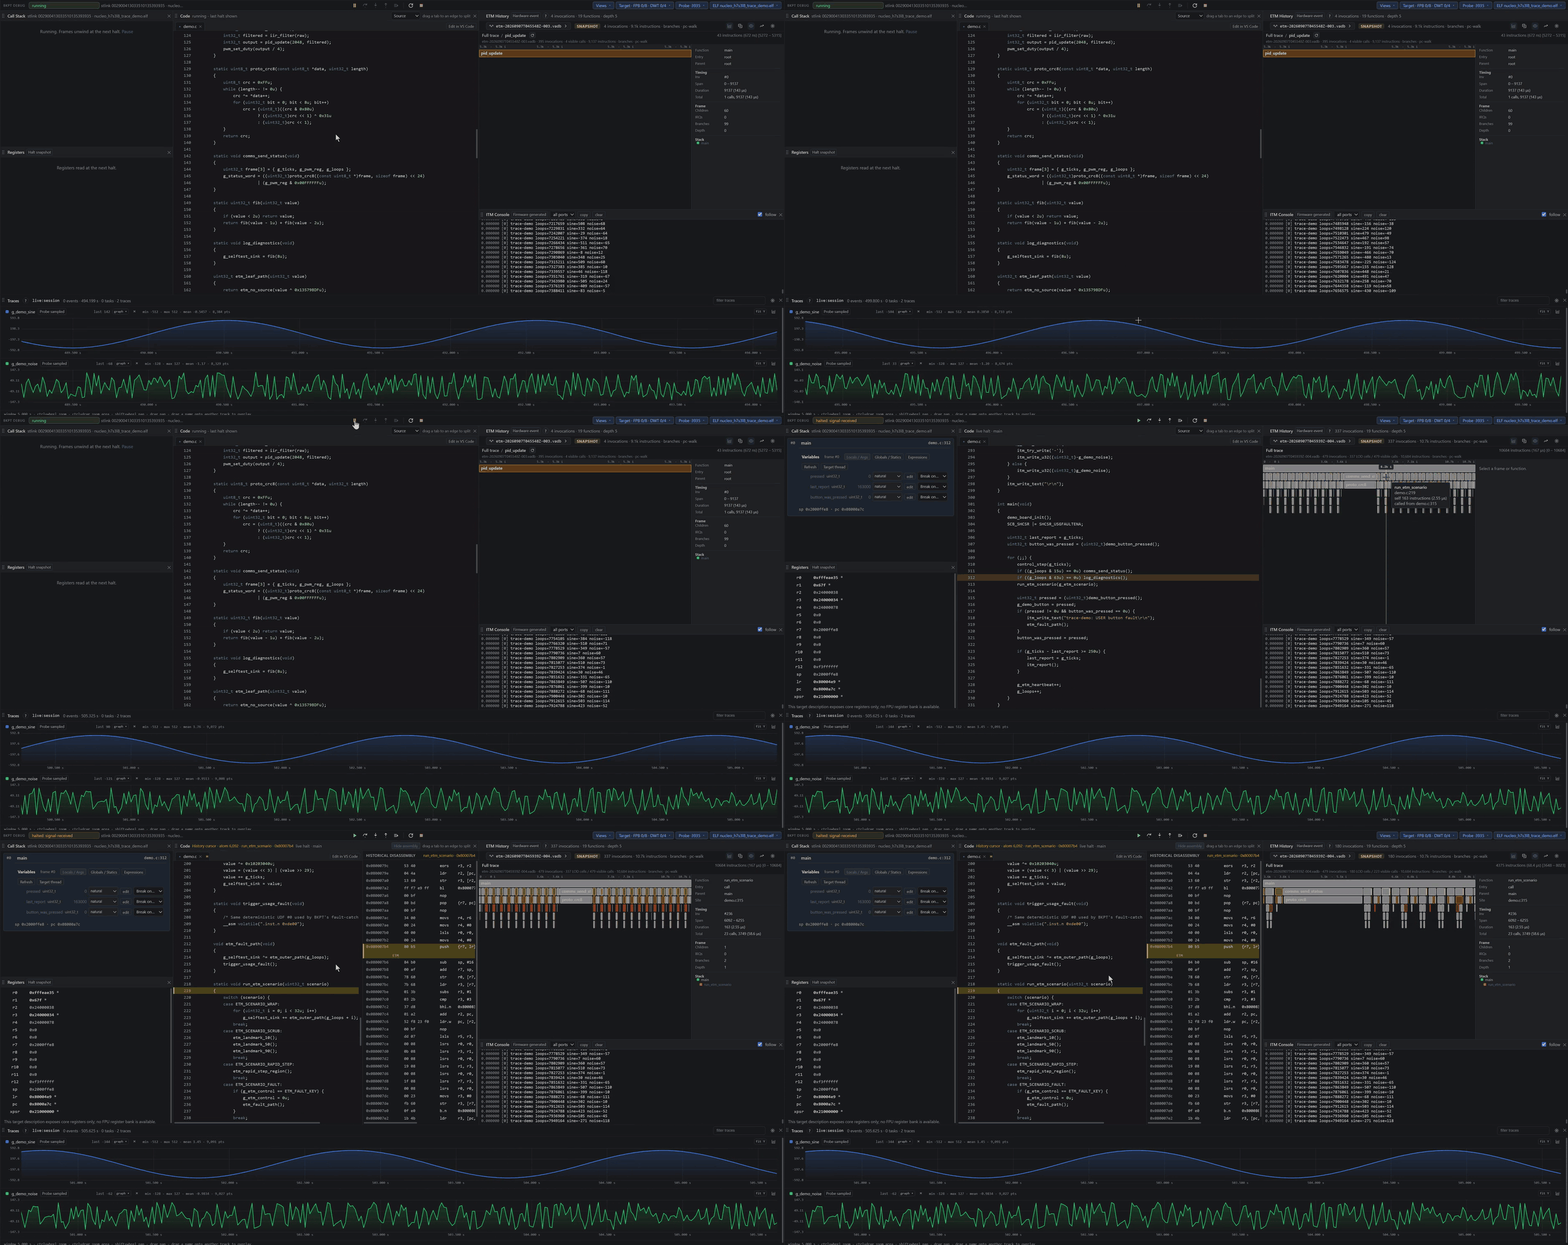
BKPT Debug is a VS Code extension for Cortex-M firmware over an ST-LINK or J-Link probe. Available features depend on the connected core, probe, and trace wiring. One panel, the Debug Layout, holds everything: step through your code, catch and explain faults, see where the CPU spends its time, inspect variables and instructions, watch CPU accesses, and record traces. BKPT's GDB server and trace tools are bundled. J-Link requires SEGGER's installed J-Link software/library, but not a separate vendor GDB server process. Programming the board is a separate step.
Start here
- Getting started: install, select the probe and ELF, then choose Start or Attach.
- Debugging: run control, breakpoints, the call stack, registers and memory, and how the layout's tiles work.
- Variables and expressions: locals, arguments, globals, expandable values, formats, source hover, and confirmed edits.
- Data watchpoints: catch a CPU read/write, choose an aligned range, and understand Saved, Pending, Armed, and Error.
- Source and assembly: Mixed/Assembly displays, instruction breakpoints, run to cursor, Set next, branch links, and missing symbols.
- Data sources and timestamps: interpret the badges, event times, health, and performance before trusting a graph.
- Peripheral registers: load a CMSIS-SVD, decode named register fields, poll values, stream CPU accesses, or break on them.
- PC sampling: live CPU load, hot functions and per-line heat while the target runs, with no instrumentation.
- Live watch: variables from your ELF as values and graphs, running, halted or stepping.
- RTOS task activity (Experimental): inspect FreeRTOS tasks and stacks, and follow sampled or DWT task activity in the Timeline.
- Fault Analyzer: a fault stops the target at the exception and the debugger tells you why.
- Hardware trace: each capture mode, DWT source, sampling dropdown, event counter, slot, and SWO health readout.
- ITM Console and ports: enable the print path, route multiple ports, and choose the local timestamp prescaler.
- ETM execution history: capture the path before a stop, explore calls and executed assembly, and understand bounded snapshots.
- Recording a trace: RTOS and event traces with the ViewAlyzer views inside VS Code.
- AI assistants: the bundled MCP server.
What needs firmware changes?
| FEATURE | FIRMWARE SUPPORT NEEDED? |
|---|---|
| Breakpoints, variables, memory, assembly, halt watchpoints | No recorder; debug symbols improve names, types, and source mapping |
| Live symbol/peripheral polling and PC sampling | No recorder; supported debug access required |
| DWT exception/access trace | No recorder; supported on-chip blocks and SWO route required |
| Experimental RTOS inspection and task activity | No recorder; matching FreeRTOS kernel symbols/types; stack scanning needs the configuration described in the RTOS guide |
| ETM execution history | No recorder or print calls; supported ETM/sink route and matching ELF required; ETR additionally needs reserved RAM |
| ITM Console | Firmware must explicitly write text to the selected ITM port |
| RTOS scheduling/events in a recorder capture | ViewAlyzer recorder integration in the firmware |
You do not need to configure every trace source before your first debug session. Start with a breakpoint and one variable; add the observation needed for your question. The experimental RTOS view discovers FreeRTOS tasks and saved stack details. Selecting a task there leaves Call Stack and Variables on the halted core.
One panel, tiled
Everything is a tile in the Debug Layout. The default arrangement is the call stack and breakpoints on the left, your code in the centre, registers and PC sampling on the right. Drag a tile by the dotted grip beside its title onto the left, right, top, or bottom half of another tile to split; the arrangement is remembered per workspace. The Views menu in the strip shows or hides tiles:
| TILE | WHAT IT SHOWS | NEEDS |
|---|---|---|
| Call Stack | Frames plus Variables tabs for locals/arguments, globals/statics, and expressions | a session, halted |
| Breakpoints | Code breakpoints and Data watchpoints, including saved Halt/Trace intent and acceptance status | hardware for arming; saved intent can be shown offline |
| Code | Source, Mixed, or Assembly; selected frame PC, source gutter, instruction controls, and available sampling heat | a halted session for live instructions |
| Registers | Core registers, changed ones marked, the FPU bank folded below | a session, halted |
| Peripheral Registers | SVD register tree, decoded fields, halt snapshots, polling, and DWT trace/break actions | a CMSIS-SVD; DWT/SWO only for the matching actions |
| PC Sampling | Live CPU load, the hottest functions, the source line | PC sampling on |
| RTOS (Experimental) | FreeRTOS task snapshots, stack estimates, and opt-in live activity | matching kernel debug information; DWT mode also needs SWO and two comparators |
| Fault Analyzer | The caught fault explained, register by register | a session |
| Memory | 256 bytes at an address expression, hex and ASCII, editable while halted | a session, halted |
| Hardware Trace | Capture mode and on-chip trace controls | matching Target Scan for capabilities; a session for acquisition |
| ETM History | Decoded execution before a stop, with a separate history cursor | a supported ETM and trace-sink route |
| ITM Console | Text the firmware prints on selected ITM stimulus ports | On-chip trace, enabled ports, SWO, firmware writes |
| Exceptions | Traced exception counts | SWV over SWO |
| Record, Symbols | The trace recorder's form and the ELF symbol picker | |
| Events | A bounded journal of received debug activity, with source filtering and navigation | enabled session event sources |
| Traces, Timeline, CPU, Task Details, Health | Graphs, activity and available recorder analysis | a compatible recording or enabled session stream; RTOS information needs matching data |
Close a tile with × and reopen it through Views. Hidden tiles avoid drawing work; most enabled acquisition continues. RTOS Samples pause when the RTOS view is hidden, while armed RTOS DWT capture continues. Disable a poll watch or trace source to stop its probe/target traffic. See performance.
What you need
- An ST-LINK or J-Link probe with working OS access/drivers. For J-Link, install SEGGER J-Link software and set the MCU's SEGGER device name. Use
bkptDebug.jlinkPathif the library is in a nonstandard location. - arm-none-eabi-gdb: the Arm GNU toolchain or STM32CubeCLT on your machine. Found automatically; a setting is there for unusual places. Standalone capture workflows have their own prerequisites; a GDB debug session requires it.
- The board programmed with your firmware, by your usual tool. BKPT Debug does not flash; its initial code-byte spot check warns about detected ELF mismatches but does not replace full firmware verification.
Not sure what is missing? Run BKPT Debug: Check Setup Health from the Command Palette.
Free version
The extension shows the recording limits currently in effect. Experimental RTOS activity allows 5 seconds per task recording across Samples and DWT, with unlimited task and stack inspection. Reaching the limit retains captured history. Viewing recordings and debugging are unlimited. Already own ViewAlyzer? Use Activate License Key… or Install License File… in the BKPT Debug sidebar to apply your license.