 DOCS/BKPT DEBUG/ITM CONSOLE AND STIMULUS PORTS
BKPT DEBUG · VS CODE
DOCS/BKPT DEBUG/ITM CONSOLE AND STIMULUS PORTS
BKPT DEBUG · VS CODE
ITM Console and stimulus ports
The ITM Console displays text that firmware writes to the processor's Instrumentation Trace Macrocell, or ITM. The text leaves the target on the SWO pin and reaches VS Code through the probe. It is a receive-only console: typing into it does not send commands to the firmware.
Needs: a target with ITM, a probe that receives SWO, the board's SWO connection, the correct clocks, and firmware that actually writes text to an enabled stimulus port. A normal printf() directed to UART or semihosting will not appear here automatically.
Get your first line
- Check the board's SWO wiring. SWDIO/SWCLK provide debugging, but SWO is a separate trace signal. Consult the board's jumper/solder-bridge diagram if its onboard probe receives no trace.
- Between sessions, open Target and run Scan Target. Confirm ITM and the SWO path are available. Enter the firmware's actual Core clock; leave SWO clock automatic initially.
- Open Views → Hardware Trace, select its ITM & DWT tab, and choose On-chip trace under Capture mode.
- In ITM stimulus, enable ITM Console and tick the port your firmware writes. Port 0 is conventional for debug text, but the firmware decides which port it uses.
- Leave Timestamps (TSPrescale) at Off · preserve bursts for a first text-only check. PC sampling, exception trace, counters, and data watches can remain off.
- Attach/start, Continue, and execute the firmware's print path. Open Views → ITM Console, choose all ports, and look for a complete line.
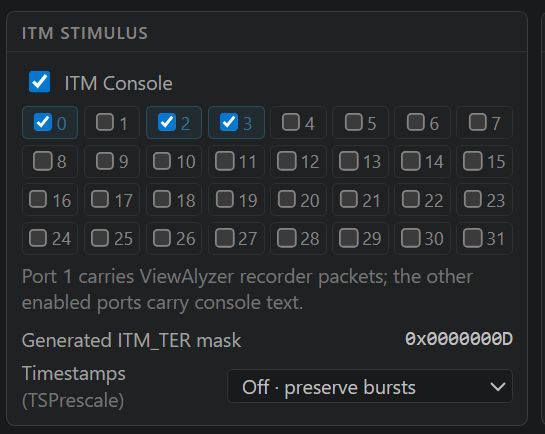
Check: Hardware Trace reports an active on-chip stream, the expected port is selected, and real text appears under that port number. Merely opening the Console tile does not enable ITM transmission. Sampling capture mode configures a PC profile, not your advanced console-port mask.
Firmware: printing is an explicit operation
Firmware must route its output to ITM. A CMSIS ITM_SendChar() integration typically uses port 0; your C library's printf needs a suitable _write or fputc retarget if you want it to use that path. A UART retarget remains a UART retarget even when the debugger has ITM enabled.
For a simple best-effort text path on an ITM-capable target, this CMSIS-style helper avoids waiting forever when the debugger is absent or the FIFO is full. Include your device's CMSIS header first:
#include <stdbool.h>
#include <stdint.h>

static bool debug_text_try_char(uint32_t port, char c)
{
    if (port >= 32u) return false;
    if ((CoreDebug->DEMCR & CoreDebug_DEMCR_TRCENA_Msk) == 0u ||
        (ITM->TCR & ITM_TCR_ITMENA_Msk) == 0u ||
        (ITM->TER & (1UL << port)) == 0u ||
        ITM->PORT[port].u32 == 0u)
        return false;

    ITM->PORT[port].u8 = (uint8_t)c;
    return true;
}

/* Call from an appropriate firmware context after clocks are configured. */
static void debug_text_example(void)
{
    const char *message = "Sensor ready\n";
    while (*message) {
        if (!debug_text_try_char(0u, *message++)) break;
    }
}
This helper can drop output and returns failure instead of blocking. Handle that result if complete logs matter. Serialize writers in your firmware if multiple contexts share a port. A blocking print routine can affect firmware timing; text output is not zero-cost instrumentation. Do not call ITM code on a target that lacks the block or where the current privilege/security context cannot access it.
BKPT configures the trace hardware through the probe. Firmware should not continually overwrite that configuration while the session is using it. End text with \n so it appears as a completed console line.
Use multiple ports
There are 32 numbered stimulus ports, 0–31. Treat them as channels: for example port 0 for general logs, port 2 for sensors, and port 3 for a protocol parser. Enable each required port in ITM stimulus.
The Generated ITM_TER mask is a readout of those choices, not another address to enter. Bit N enables port N: ports 0 and 2 produce 0x00000005. The top ITM Console switch turns all software stimulus ports off. Turning it back on selects port 0 and the configured recorder port; reselect any additional text ports in the numbered checkboxes.
Note: one port is reserved for ViewAlyzer recorder packets, normally port 1. The card states the current recorder port. Those bytes are decoded as recorder data rather than console text. Keep ordinary text on another port. Recorder port selection must agree with the firmware's transport configuration.
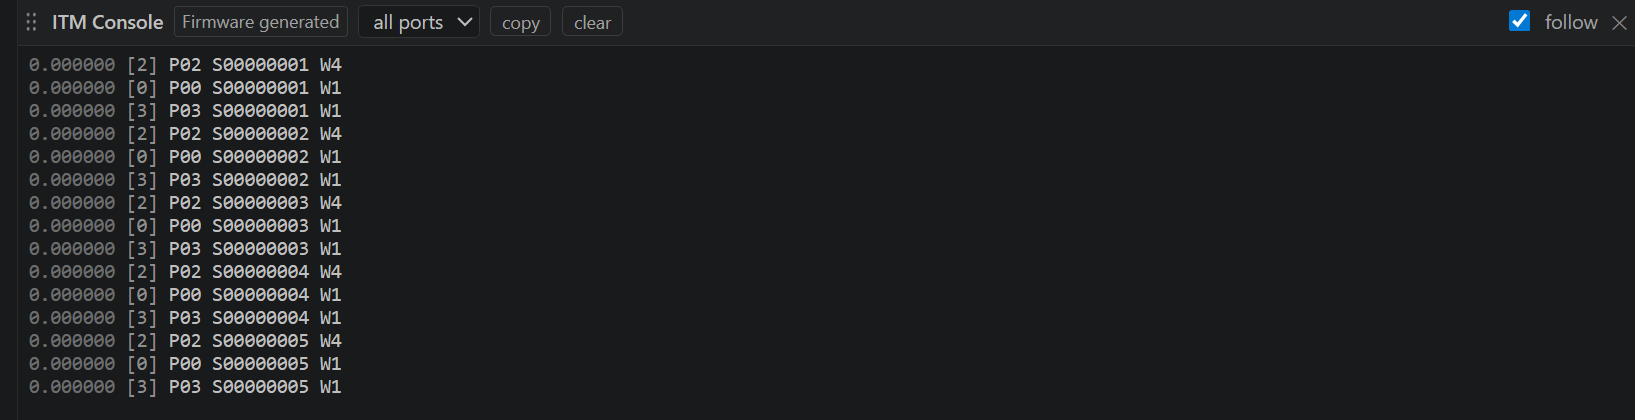
| CONSOLE CONTROL | EFFECT |
|---|---|
| all ports / port N | Filter retained text. This does not change which ports the target emits. A port appears in the menu after data is available for it. |
| copy | Copy the displayed lines, including times and port numbers |
| clear | Clear the retained console text and partial-line buffers; future output continues |
| follow | Scroll to new lines automatically; turn it off to read earlier output |
Port filtering does not discard other ports' lines. Lines are assembled per port, so interleaved 8-, 16-, and 32-bit stimulus writes do not merge one channel's text into another. The visible buffer is bounded; use a recording when you need to retain a longer run. A new debug session starts a new console buffer. Closing the tile does not disable the producer.
Timestamps (TSPrescale)
This dropdown controls ITM local timestamp packets. Those packets help the decoder relate ITM and DWT packets to target trace time. They consume the same limited transport capacity as your text and hardware events. They are not wall-clock timestamps and do not change the firmware's CPU clock, the SWO baud rate, or the PC-sampling interval.
| CHOICE | WHAT CHANGES | WHEN TO USE IT |
|---|---|---|
| Off · preserve bursts | Do not request local timestamp packets | A good starting point for readable logs and reducing trace overhead |
| On | Enable local timestamps without prescaling | Finest timestamp-counter granularity when the stream has room |
| On · /4 | Divide the local timestamp-counter clock by 4 | Coarser granularity; smaller timestamp deltas for a given interval |
| On · /16 | Divide it by 16 | A further granularity/bandwidth tradeoff |
| On · /64 | Divide it by 64 | Coarsest setting offered here |
The divisors are timestamp-counter prescalers, not “one timestamp every 4/16/64 text lines.” A larger divisor does not guarantee the stream uses that fraction of the bandwidth. Packet size and burst behavior matter. Arm documents these prescaler encodings in the ITM Trace Control Register.
Start with Off for a console check. If your investigation needs relative trace timing, enable timestamps, capture again, and check SWO load and health. If events disappear or overflows rise, reduce other sources or return to Off. Local timestamp packets can be delayed relative to data; they do not promise exact per-event timing under all conditions. See Arm's local timestamp protocol.
Turning timestamps off does not hide the console's numeric time column. That column is supplied by the decoder, and missing local timing or approximate alignment cannot be diagnosed from a number alone. Read timestamp provenance and health before using differences between rows as a timing measurement. With timestamps off, several or all console lines can have the same time, including zero as in the text-only example. That does not mean the firmware printed them simultaneously.
The Console switch controls software stimulus ports. DWT hardware packets can use the ITM/SWO transport without that switch being on. Consequently, the timestamp dropdown may remain usable when console text is disabled but another hardware source is active.
Nothing appears, or output is damaged
| SYMPTOM | CHECK IN THIS ORDER |
|---|---|
| Console stays empty | Target is running; firmware reaches an ITM write; On-chip trace is selected; ITM Console and the correct port are enabled; filter is all ports |
| UART output exists but ITM is empty | Retarget the firmware output to ITM. The debugger does not redirect an existing UART or semihosting printf. |
| One port is missing | Enable that port in the stimulus grid, verify the firmware's port number, and avoid the configured recorder port for plain text |
| On-chip trace is disabled or inactive | Read its specific reason; check Target Scan, the real core clock, target capabilities, SWO wiring, and probe support |
| Garbled or missing lines | Check clocks and SWO rate, then overflow/rejected/clipped/resync counts. Reduce output and other trace sources; test with timestamps off. |
| A short message never completes | Emit a newline and verify the rest of the line was not dropped |
| Target stalls in printing | Inspect the firmware's ITM routine for an unbounded wait on a full or disabled trace port |
The Firmware generated badge is intentional. ITM carries the bytes in hardware, but your firmware created the message.