 DOCS/VIEWALYZER/ANALYZER
VIEWALYZER · GPUI EDITION
DOCS/VIEWALYZER/ANALYZER
VIEWALYZER · GPUI EDITION
Analyzer
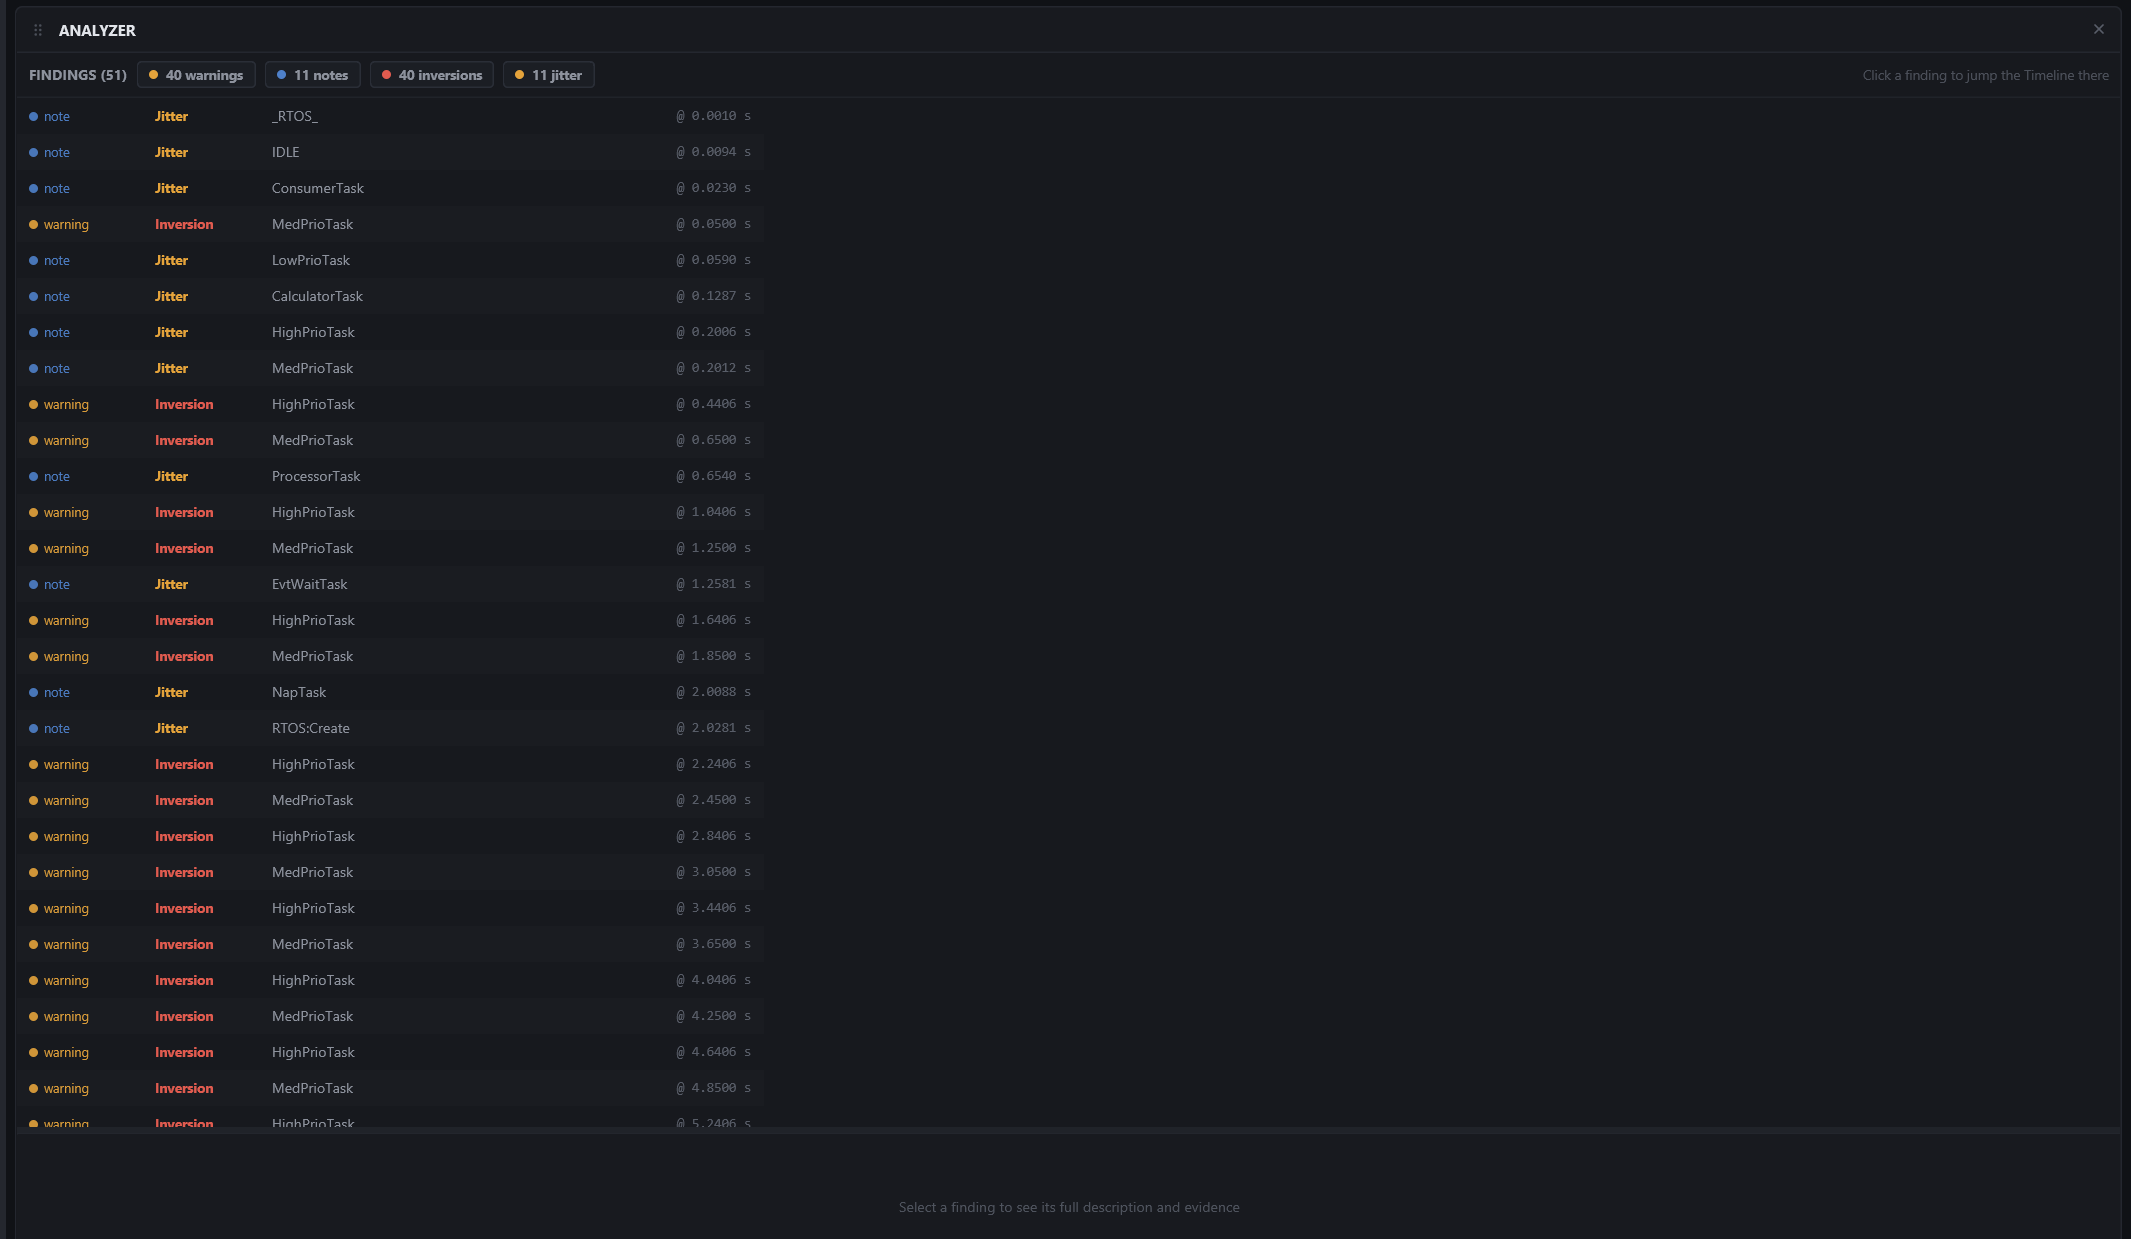
The findings report. The recording is analysed for the things that usually explain a misbehaving system, and each finding is one row you can click to be taken there.
Needs: a recording.
What it finds
| KIND | MEANING |
|---|---|
| Inversion | A priority inversion: a high-priority task waited on a mutex held by a lower-priority task while something in between ran |
| Jitter | An activation of a periodic task far off its median period |
| Failed op | A kernel operation that failed: a receive that timed out, a send to a full queue, a take that gave up |
| Queue failure | An individual send, receive or peek failure, with the queue, task or ISR, observed occupancy and exact event |
| Semaphore | Give/take counts, failed operations, completed blocking-time statistics and relative wait outliers |
| Verdict | A diagnosis raised by an installed Trace Domain: the domain's rules, evaluated over the recording, with the evidence listed |
Each finding has a severity (error, warning, suspicious, flag, note), always shown as a coloured dot and a word, never colour alone.
Using it
- The pills in the header are counts and filters at once: click inversions to see only inversions, click it again to see everything.
- Click a row: the Timeline jumps to that moment with the cursor pinned and a flash, and the footer shows the full description and, for verdicts, the evidence from onset to end. Drag the footer's top edge to give it more room.
- The findings are computed for the same scope as the CPU view: with Selection on there, the header carries a chip saying the report covers only that region.
Finding a queue failure
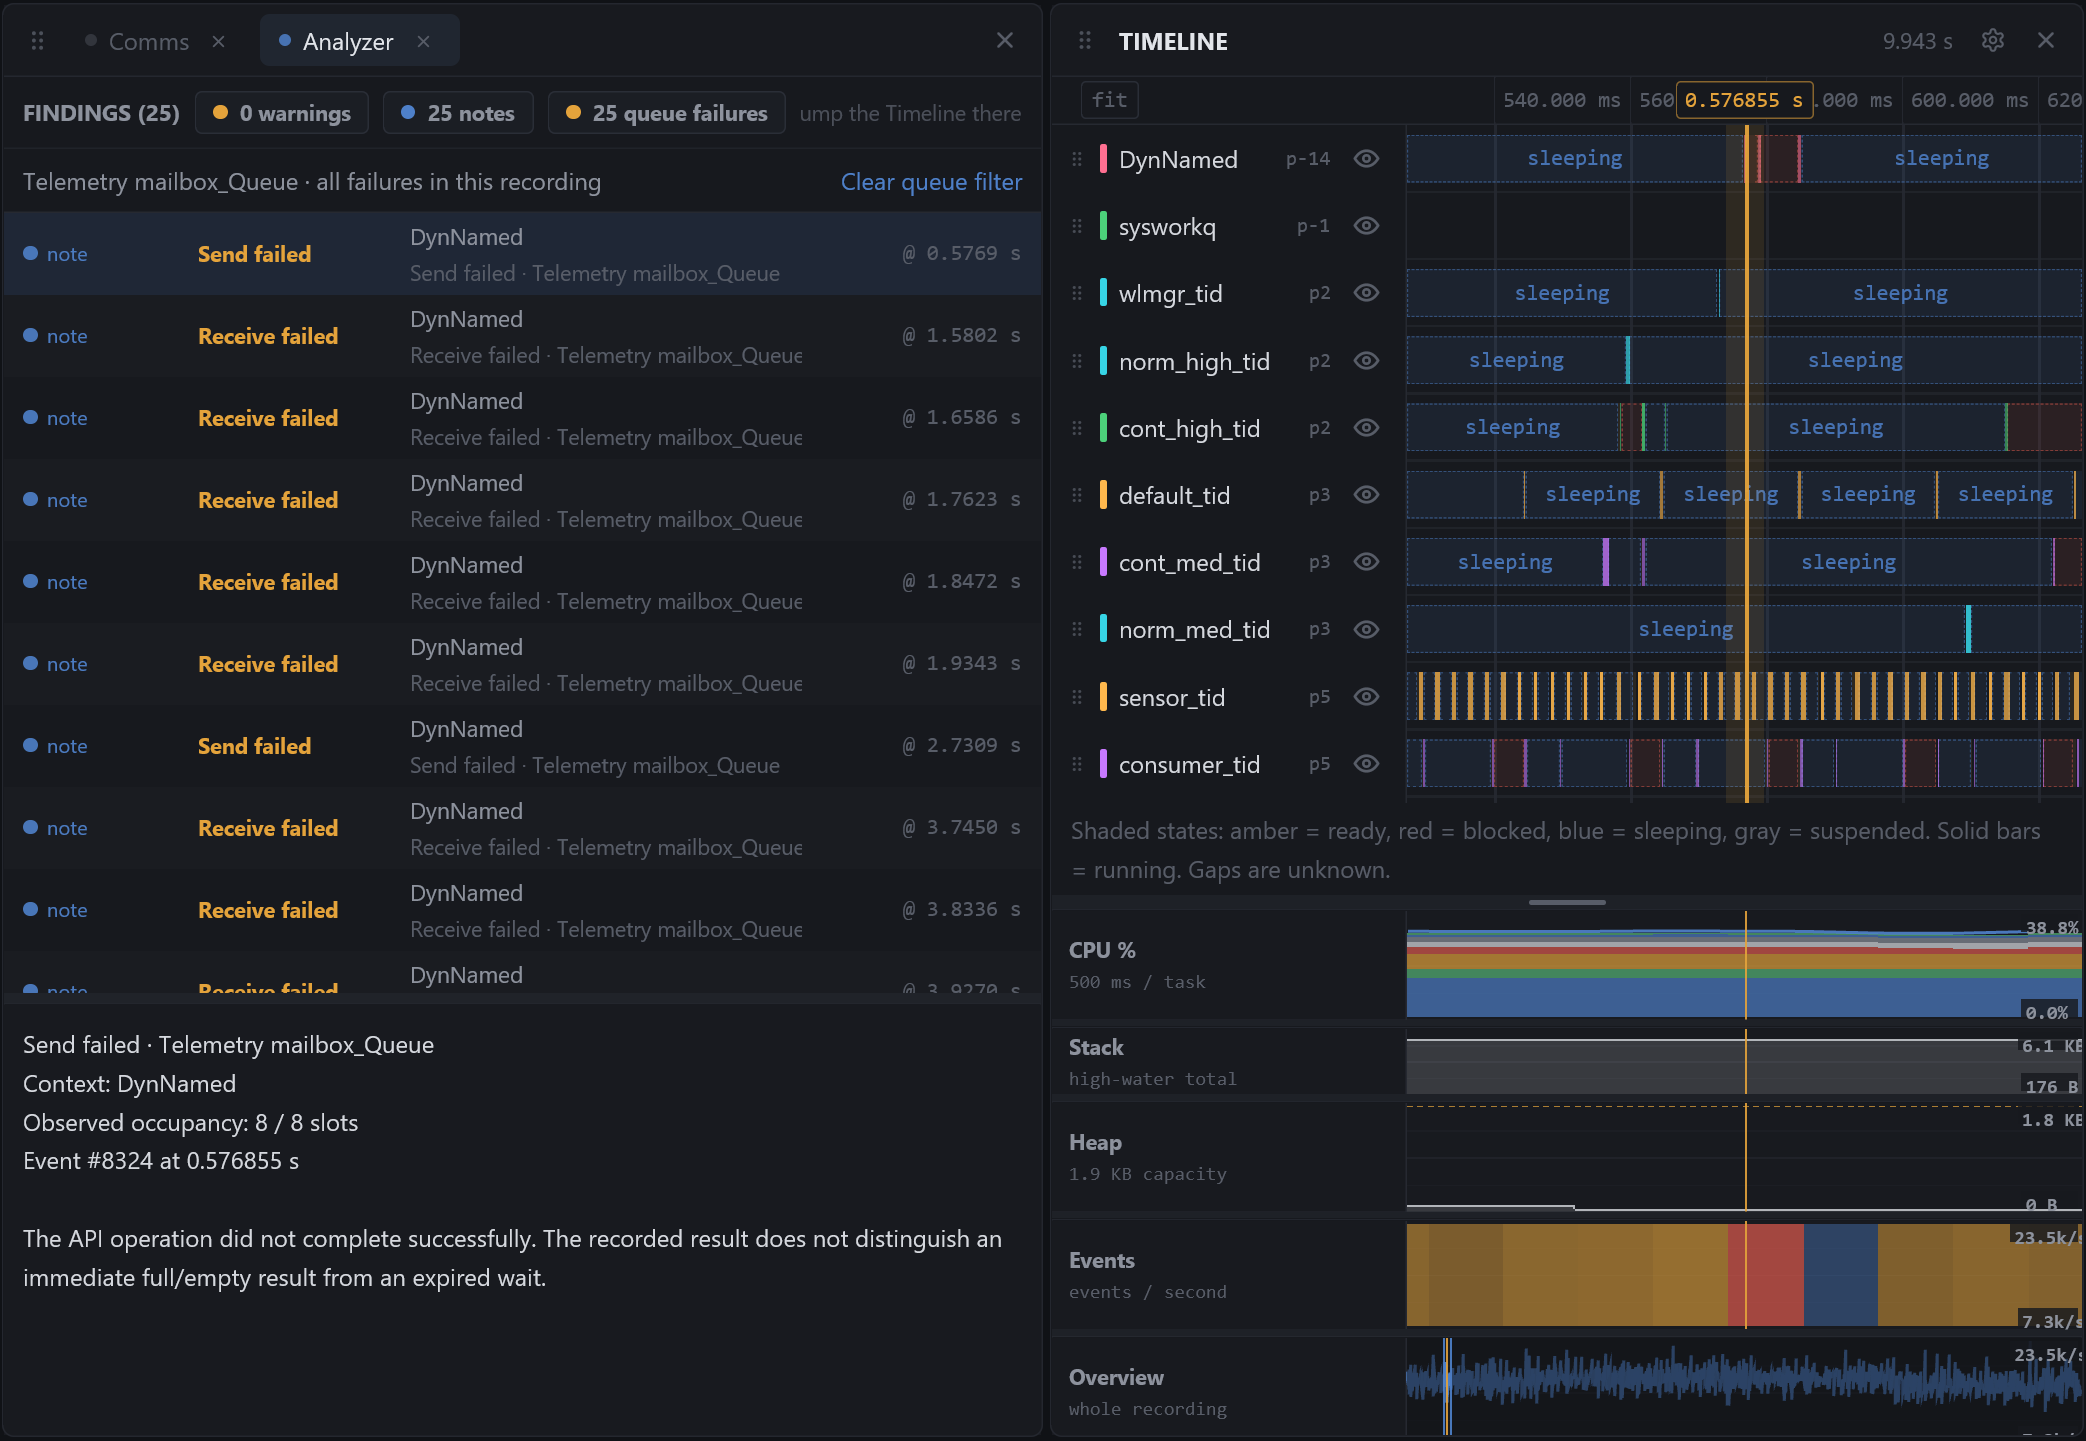
In Comms > Resources, click a queue's nonzero failed count. Analyzer opens with all failures for that queue across the recording, so the list matches the card's count even when a CPU time selection is active. The queue name and scope appear above the list. Use Clear queue filter to return to the normal report.
Each failure shows the operation and task or ISR. Select it to pin its exact Timeline event; the footer includes observed occupancy, event ID and time. The queue failures filter in the normal report follows the CPU selection scope. Clear filter removes an active kind or severity filter.
Queue failures are notes, not automatic warnings: a nonblocking poll can fail during normal application behavior. The recorded result does not identify whether the operation returned immediately or its wait expired. These entries require queue detail events; generic failure packets are not duplicated as additional detailed queue findings.
Tips
- The semaphore filter includes an activity note for each observed semaphore and warnings for failed operations or unusually long blocking waits. Blocking time runs from blocked to ready/running, excluding later scheduling delay. Wait statistics require the recorder's task-state hooks. Partial waits at capture, selection or event-loss boundaries are excluded from percentiles.
- A semaphore wait outlier exceeds four times its median, with a 1 ms floor and at least ten complete samples. It is a timing observation, not a deadline violation or proof of starvation. Failed takes may be expected nonblocking checks; token counts and ownership cannot be inferred from these events alone.
- Start here on an unfamiliar recording; the Timeline is much easier to read when you already know which task to watch.
- A verdict's evidence lines are the domain's sampled channels at the moments that mattered, so a "queue starved" finding tells you what the queue depth and the consumer were doing, not just when.