 DOCS/BKPT DEBUG/GETTING STARTED
BKPT DEBUG · VS CODE
DOCS/BKPT DEBUG/GETTING STARTED
BKPT DEBUG · VS CODE
Getting started
From a programmed board to your code halted at main.
Install BKPT Debug in VS Code. If you were given a .vsix, run Extensions: Install from VSIX…, select it, and reload when VS Code asks. Open the firmware's project folder so ELF paths, watches, and layout choices can be saved with the workspace. No launch.json is required for the integrated Debug Layout workflow.
Install an Arm GNU GDB toolchain or STM32CubeCLT. For J-Link, also install SEGGER's J-Link software/library. Open BKPT Debug: Check Setup Health before troubleshooting the target; it reports the tools the extension found.
- 1. Program the board
- 2. Open the Debug Layout
- 3. Press F5
- Keys
- Attach instead of reset
- Settings
- Troubleshooting
1. Program the board
Connect the board through its ST-LINK or a J-Link and program it with the tool you already use (STM32CubeProgrammer, J-Flash, your IDE). BKPT Debug is debug-only: use your programmer to install the firmware. At the first halt, the debugger spot-checks selected code bytes against the ELF and warns about a confirmed mismatch. This is an early diagnostic, not a full-image verify; keep the programmed image and the selected ELF from the same build.
Check: the board runs your firmware, and nothing else holds the probe (close the IDE's debug session, stop ST-LINK server).
2. Open the Debug Layout
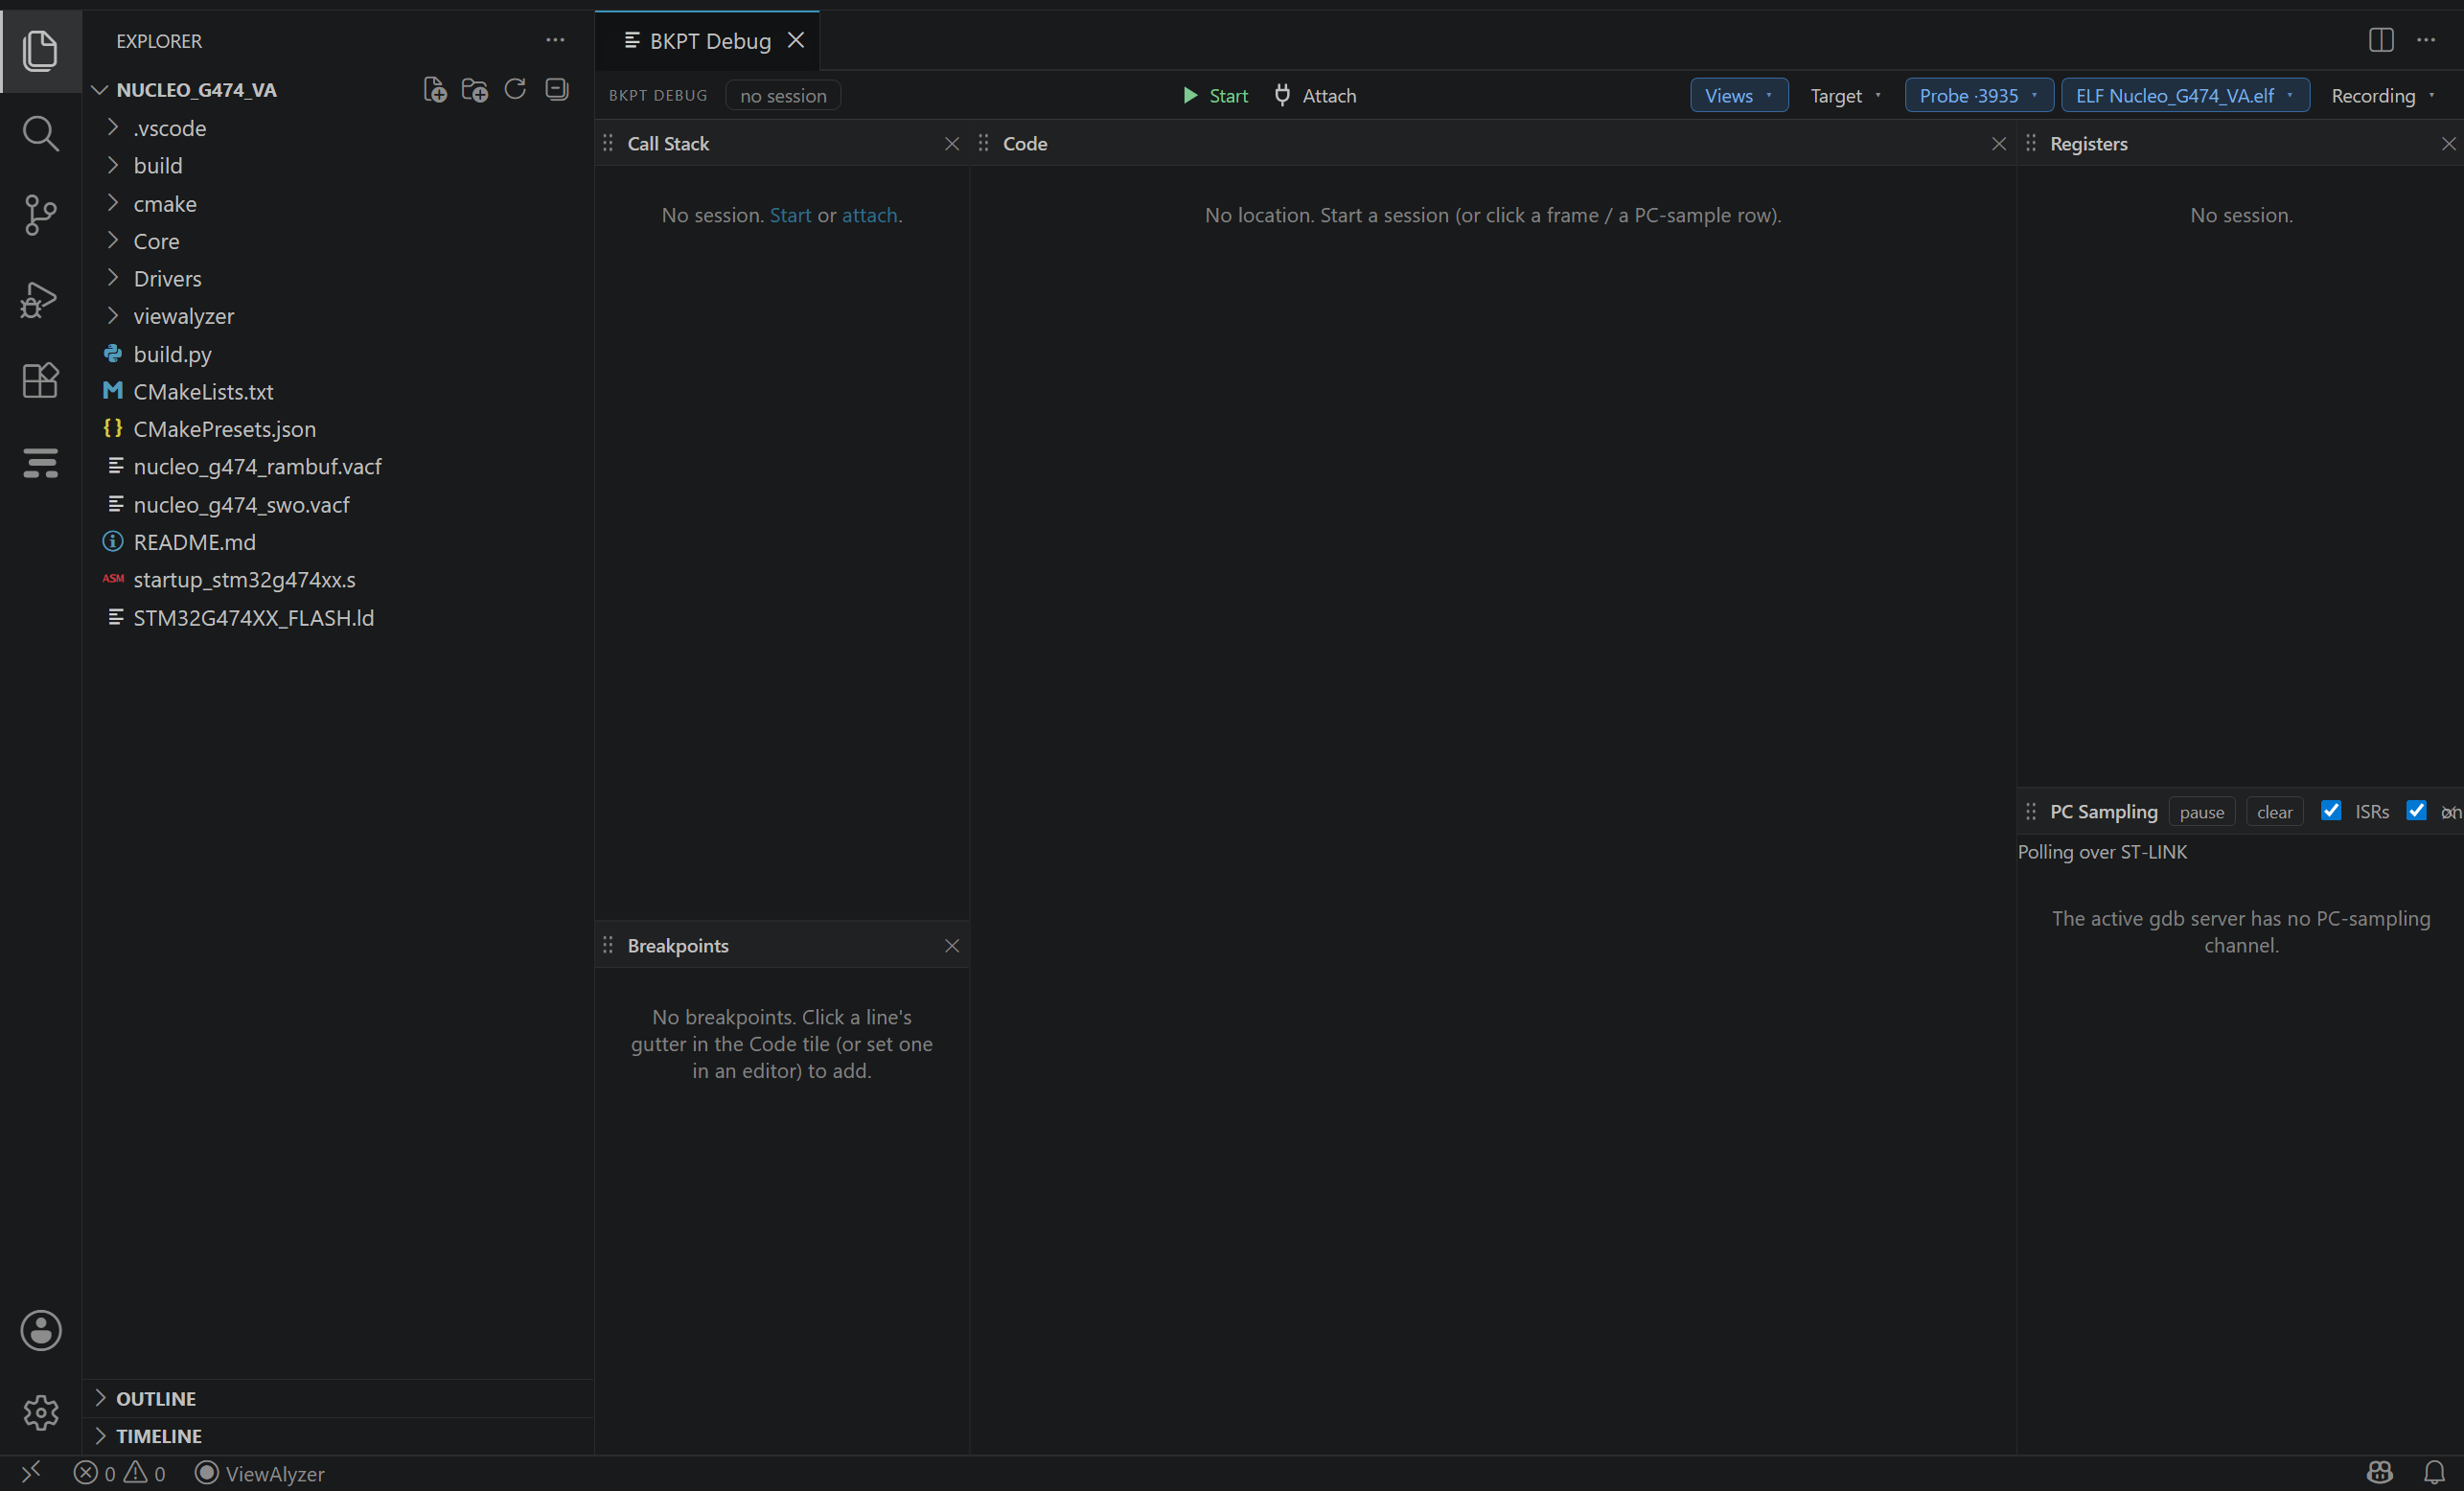
Click BKPT Debug in the activity bar and choose Open Debug Layout. The strip along the top is the whole control surface:
| CONTROL | WHAT IT DOES |
|---|---|
| Start / Attach | Reset and run to main, or join the running firmware (see below) |
| Run controls | Continue, pause, step over, step into, step out, step one instruction, reset, stop, while a session runs |
| Views | Show or hide tiles; the ViewAlyzer views are listed under their own heading |
| Target | The core clock, and the target scan (what the core offers: PC sampling, data watch, ETM, trace sink) |
| Probe | Which probe, by serial, when several are attached |
| ELF | The firmware image, shared by the session, the Symbols tile and PC sampling |
| Recording | Open a recording in the ViewAlyzer tiles |
Pick your ELF in the strip (or set bkptDebug.elf). It is remembered per workspace.
The ELF must be the image programmed onto this board, including its debug information. An ELF from another build can resolve convincing but wrong source lines and addresses. Pin the probe in Probe when more than one board is connected. For J-Link, enter the exact Target device name.
Check: the strip reads no session and the ELF name shows in the strip.
3. Press F5
The target resets, runs to main and halts with your code centre stage: the halted line in the Code tile, the frames and their locals in the Call Stack, the registers on the right.
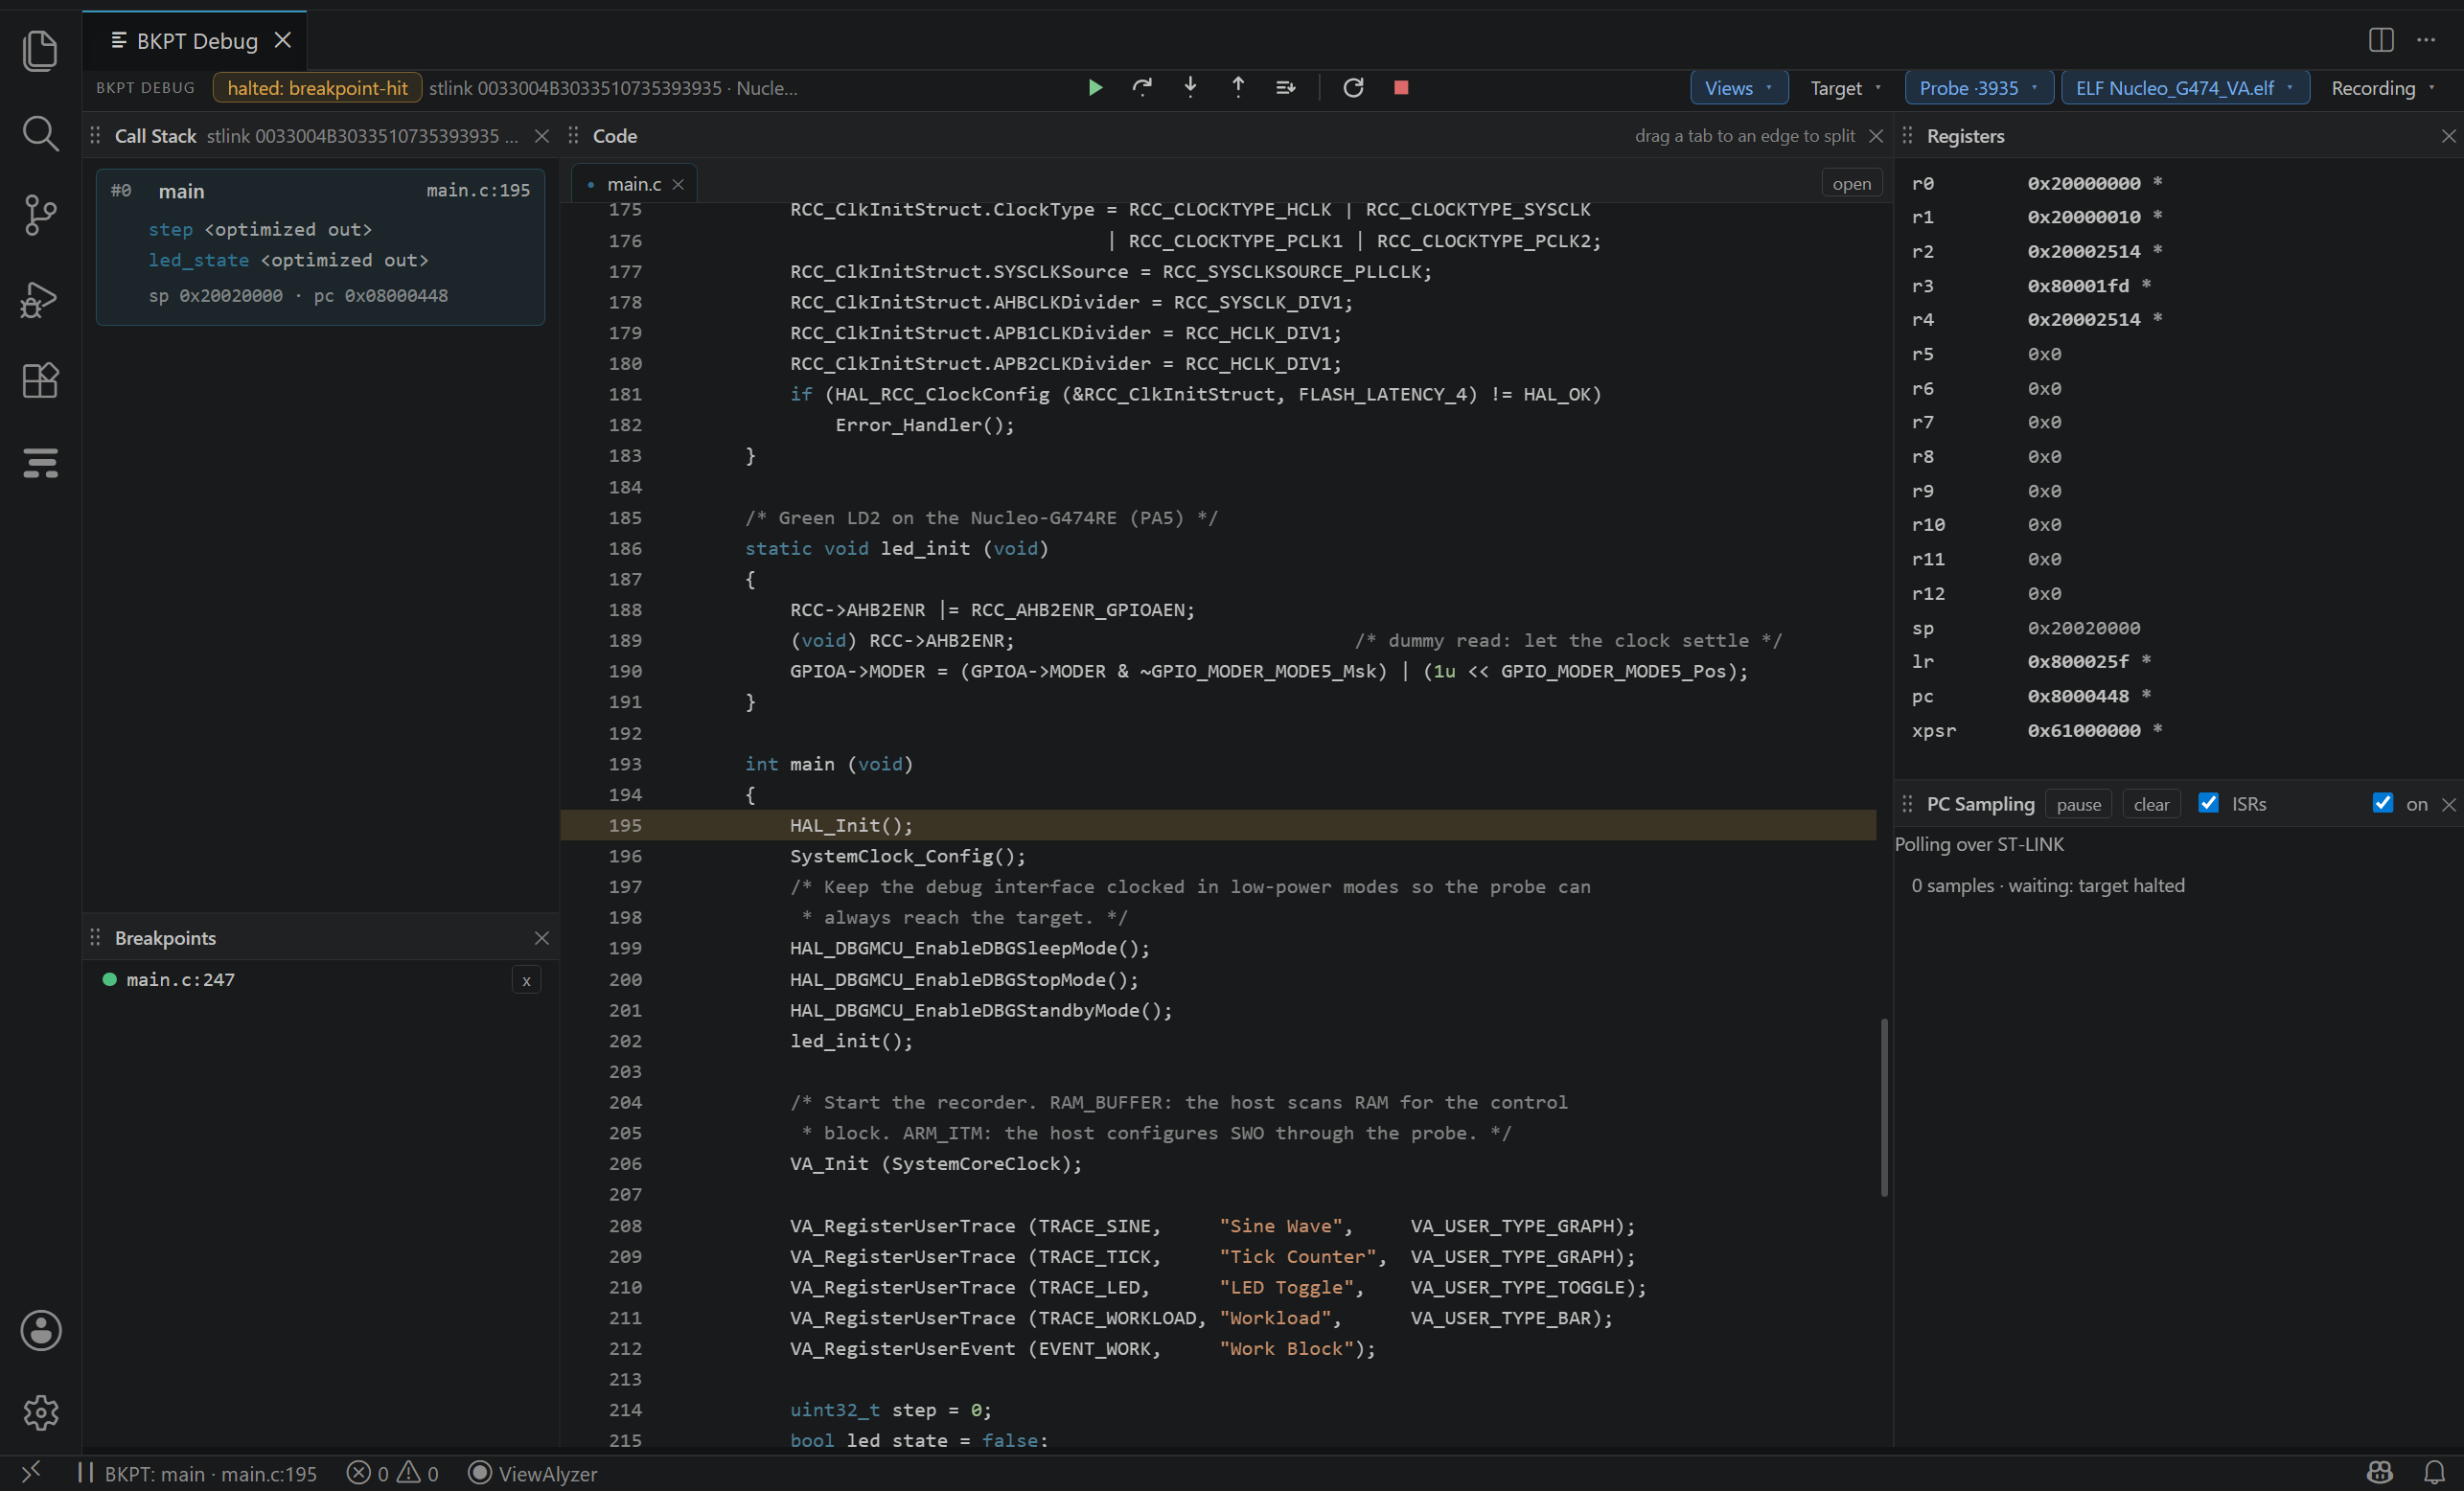
From here it is the debugger you know: F5 continues, F6 pauses, F10 and F11 step, click a line number to set a breakpoint. Debugging goes through each tile.
Keys
| KEY | ACTION |
|---|---|
| F5 | Start (when no session runs), else Continue |
| F6 | Pause |
| F10 | Step over |
| F11 | Step into |
| Shift+F11 | Step out |
| Ctrl+F11 | Step one instruction |
| Shift+F5 | Stop |
| Ctrl+Shift+F5 | Restart |
The keys are BKPT Debug's only while its session is active (and F5 to start only where an ELF is configured), so they do not fight with VS Code's own debugger. Every action is also a command in the Command Palette under BKPT Debug.
Attach instead of reset
Attach to Running Target joins the firmware without a reset: the target keeps running and you pause it when you want to look. Attach and Halt stops it at once. Both are in the strip's Attach menu and in the Command Palette.
Settings
All under bkptDebug. in Settings, with the workspace scope for anything board-specific.
| SETTING | MEANING |
|---|---|
elf | The firmware ELF (absolute, or relative to the workspace). Empty: debug.elf in .va/settings.json, then a prompt when a session starts. |
probe | stlink (default) or jlink. Both are driven directly. |
probeSerial | The probe's serial, for benches with more than one attached. Empty: the first probe of that kind. The strip's Probe menu writes it. |
speedKhz | SWD clock; 0 = the probe's default. |
device | The SEGGER device name (STM32F767ZI), J-Link only, effectively required there. |
jlinkPath | Optional directory containing the installed SEGGER J-Link library. |
armToolsPath | Required external ARM toolchain bin directory containing GDB, nm, objdump and addr2line. |
runTo | The symbol Start runs to after reset (main). Empty: halt at the reset vector. |
maskIsr | Interrupt masking while stepping: auto (single-step only), on, off. |
faultCatch | The fault classes caught at the exception: all, off, or a list of hard bus mem usage int sf. The Fault Analyzer tile edits it live. |
pcSamplingUpdateMs | Delivery interval for aggregated profile counts (default 100 ms), not the hardware sampling period. Select the source in Hardware Trace. |
cpuClockHz | The core clock in Hz; the Core clock field in the Target menu writes it. |
profilingSource, hardwareTrace | Off (default), Sampling, or individually configured On-chip trace. See Hardware trace. |
svd, peripheralRegisters | Exact device SVD plus saved register actions and shared polling rate (default 10 Hz). Use the Peripheral Registers tile. |
dataWatchpoints | Saved hardware halt-watch definitions. Edit them in Breakpoints → Data watchpoints. |
expressionWatches | Saved read-only expressions and display formats. Edit them in Call Stack → Variables → Expressions. |
etmHistory | ETM enable, stop-update policy, sink, and buffer settings. The Hardware Trace → ETM setup tab explains capability requirements. |
swoFreqHz | The SWO clock in Hz; the SWO clock field in the Target menu writes it. 0 (the default) is automatic: the fastest exact rate the probe's receiver takes, up to 10 MHz. |
tcpPort | The extension's managed GDB server port (6987), reached at 127.0.0.1. Live watch, PC sampling, trace memory and SWO use the next four ports (6988–6991). Existing explicit port settings are preserved; the standalone native server's default is unchanged. |
gdbserverPath | Your own bkpt_gdbserver; empty uses the bundled one. |
traceEnginePath | Advanced override for the debug session's trace decoder; empty uses the bundled decoder. |
Troubleshooting
Start fails at once. Read the Output channel (BKPT Debug: Show Debug Output): the probe is in use, no probe was found, or arm-none-eabi-gdb is missing. Check Setup Health lists what the extension found.
**Start warns after a few seconds that main was never reached.** The firmware on the board is not this ELF (reflash with your vendor tool), or the image needs a different runTo.
Two boards on the bench and the wrong one answers. Pin the probe: the strip's Probe menu, or bkptDebug.probeSerial. An unpinned session takes the first probe it finds.
Breakpoints never hit. Check that the flashed image matches the ELF, the breakpoint is bound, and execution reaches that code. Read any first-halt mismatch warning; an optimized-away line may have no instruction to bind.
ITM Console is empty. Opening it does not enable text acquisition. Follow ITM Console setup: On-chip trace, ITM Console enabled, correct port selected, matching clocks and SWO wiring, and firmware that writes to ITM.
The cable or power was lost. Use connection-loss recovery. Reconnect and Halt intentionally leaves trace and saved debug setup off until you verify the target and restore the appropriate configuration.