Capture hardware
Bandwidth and timing
Instruction trace at full clock rate needs dedicated bandwidth and accurate timestamps. Control of the capture hardware gives the software reliable evidence of target behavior.
 BreakpointBuy a license
 Debug and capture hardware · In development
A programmable debug and trace probe for everyday embedded engineering.
BreakPoint One combines flash programming, debugging, and instruction trace with configurable FPGA hardware. It is being developed to make advanced capture and measurement capabilities accessible to more engineering teams.
Open FPGA capacity and an instrument port let engineers extend the probe with custom triggers, protocol decoding, and logic capture. The same tools support visual investigation, scripts, and AI agents.
Programmable by design
The instrument port connects the FPGA to external equipment. Configure trigger inputs, clock outputs, synchronization pulses, and logic analyzer lanes through software, without writing HDL or using a vendor toolchain.
Route a function trigger to an oscilloscope, or use an external edge to freeze a capture with its pre-trigger history. Events are timestamped by the same hardware clock as the instruction trace.
Every setting available in the app has a documented command, so the same configuration can run from a bench script or in CI. The probe reports its capabilities to the host tools.
Capture hardware
Instruction trace at full clock rate needs dedicated bandwidth and accurate timestamps. Control of the capture hardware gives the software reliable evidence of target behavior.
Shared capture data
ViewAlyzer visualizes the capture, BKPT Studio’s agent queries it, and Assert tests against it. A documented format also makes the data available to your own scripts.
Existing equipment
The BKPT software stack works with standard debug probes today. BKPT One extends the available capture capabilities; it is not required to get started.
Hardware comparison
ST-LINK, J-Link, and J-Trace serve established needs, from development-board debugging to specialist trace and validation work. BKPT One focuses on accessible instruction trace and configurable instrumentation for the daily firmware bench.
The comparison below retains the July 2026 price and capability snapshot. BKPT One is in private beta; general-availability pricing has not been announced.
Scroll horizontally to compare all four probes.
| JULY 2026 · US LIST | STLINK-V3STMICROELECTRONICS | J-LINK BASE / PLUSSEGGER | J-TRACE PRO CORTEX-MSEGGER | BKPT OneBKPT LABS |
|---|---|---|---|---|
| PRICE | About $35 to $43, and already on the boards you own | $598 / $798 | $1,880. Whole-family model: $3,080 | Private beta. GA pricing aimed at a bench budget, not a lab one |
| TARGETS | STM32 and STM8 only | The industry catalog: thousands of devices across every vendor | M-profile cores in this model; A / R need the $3,080 one | ARM microcontroller cores first for wide market reach, more to come. Flashes 10,000+ device variants via the CMSIS-Pack FLM catalog |
| DEBUG: FLASH / HALT / STEP | Yes | Yes | Yes | Yes: it replaces the box on your desk |
| SWO: PRINTF, SAMPLING | Yes | Yes | Yes | Yes |
| INSTRUCTION TRACE (ETM/ETR/ETF) | No | No: SWO only | Yes: streaming. The reference instrument | Yes: streaming over USB-C. The reason it exists |
| TRIGGER I/O, STAMPED IN HARDWARE | Bridge GPIOs, not stamped against a capture | No external trigger pins | No external trigger pins | In and out, latched on the capture clock, with pre-trigger history |
| SPARE FABRIC FOR YOUR PROBLEM | Fixed function | Fixed function | Fixed function | Most of the FPGA is left open: triggers, clocks, logic lanes for the user to customize. Pre built ip such as LogicLite so your probe becomes much more |
| CAPTURE DATA | None: nothing to capture | None: nothing to capture | Vendor tools (Ozone) | One documented file: GUI, agent, CI, and your own scripts |
| TRACK RECORD | The default on every ST board | Two decades, every IDE | The validation-lab reference | Private beta. This row is earned; give us time |
J-Link and J-Trace are trademarks of SEGGER Microcontroller GmbH. ST-LINK is a trademark of STMicroelectronics. BKPT Labs is not affiliated with, or endorsed by, either company. Prices are US web-shop list prices as of July 2026; capabilities are summarized from public vendor documentation. Spot an error? Tell us and we will fix it.
Bench study · Power and trace
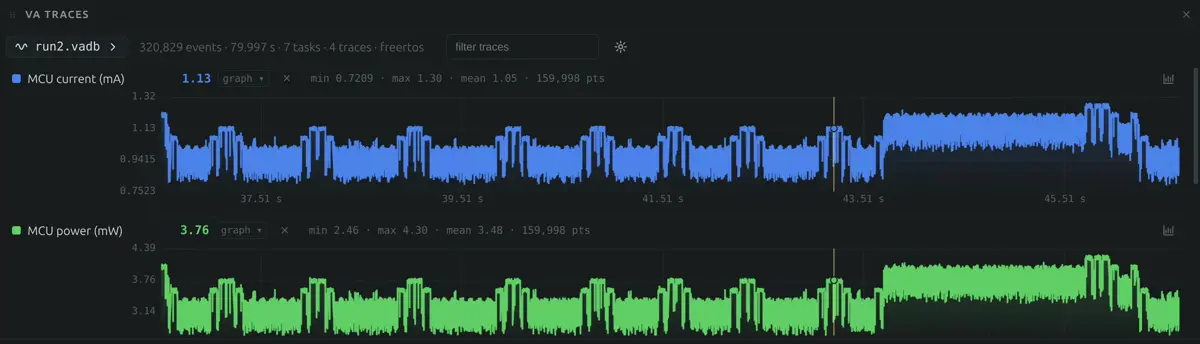
A Joulescope JS320 connected to the target rail records current and power. The probe timestamps synchronization edges, and a merge step brings those measurements into the instruction trace capture.
The result connects energy use to the functions that caused it. The same approach can connect other instruments and external event streams through a common timing reference.
Read the full field noteEngineering workflows
Capabilities demonstrated on the development hardware and supported by the shared capture workflow.
Current measurements travel with the capture, placing power data alongside execution time and cycles in the function table.
Collect program counter samples without instrumenting or halting the firmware. A probe firmware update increased our measured sampling rate from 137 to 6,866 samples per second.
Hardware-timestamped trigger inputs and outputs connect external measurements to the code running on the target.
The same record can be opened by ViewAlyzer, queried by BKPT Studio, tested by Assert, and read by your own scripts.
A scriptable probe and saved capture let teams turn deadline budgets into repeatable checks on real silicon.
Agents can query the recorded target behavior directly and use the relevant evidence to investigate a problem.
Development hardware
Subject to change as the hardware and firmware develop.
Receive engineering updates and help shape the hardware before general availability.