FreeRTOS
Task scheduling and notifications, queues, mutexes, semaphores, event groups, kernel heap allocation, and software timer lifecycle.
 Breakpoint
Buy a license
ViewAlyzer
Built with Rust and GPU-accelerated GPUI, ViewAlyzer is a native desktop app for streaming live signals and investigating blocked tasks, queue contention, and late callbacks.

 Linux
 VS Code
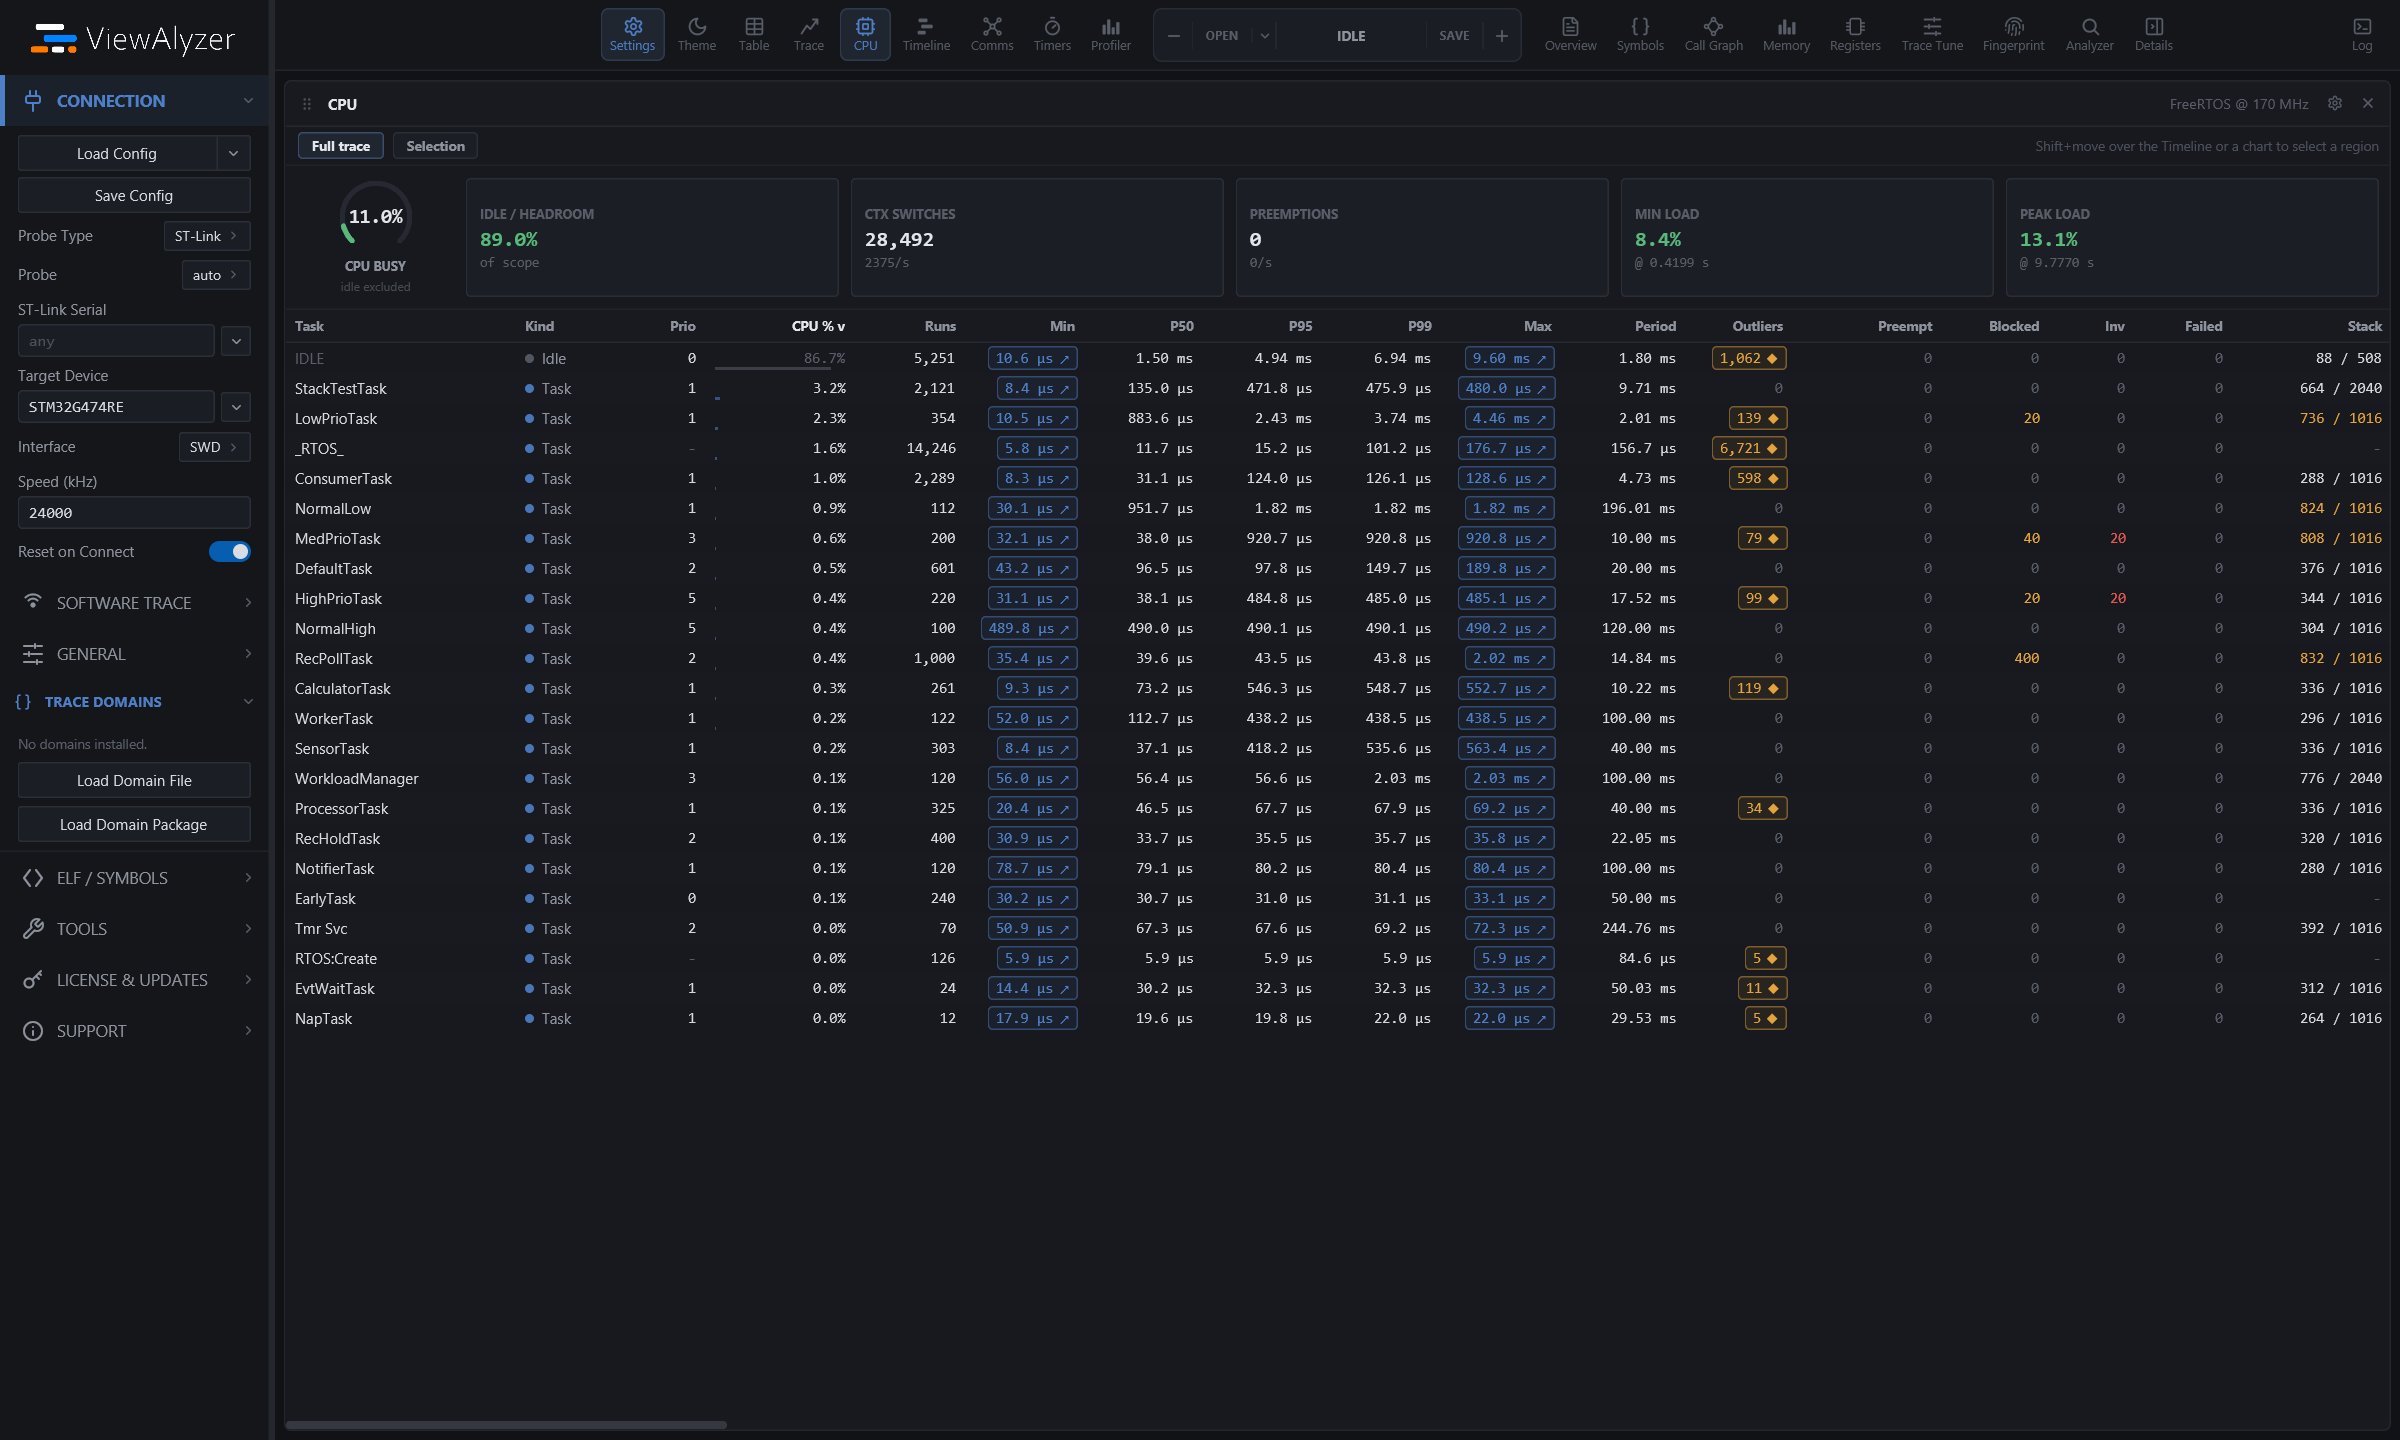
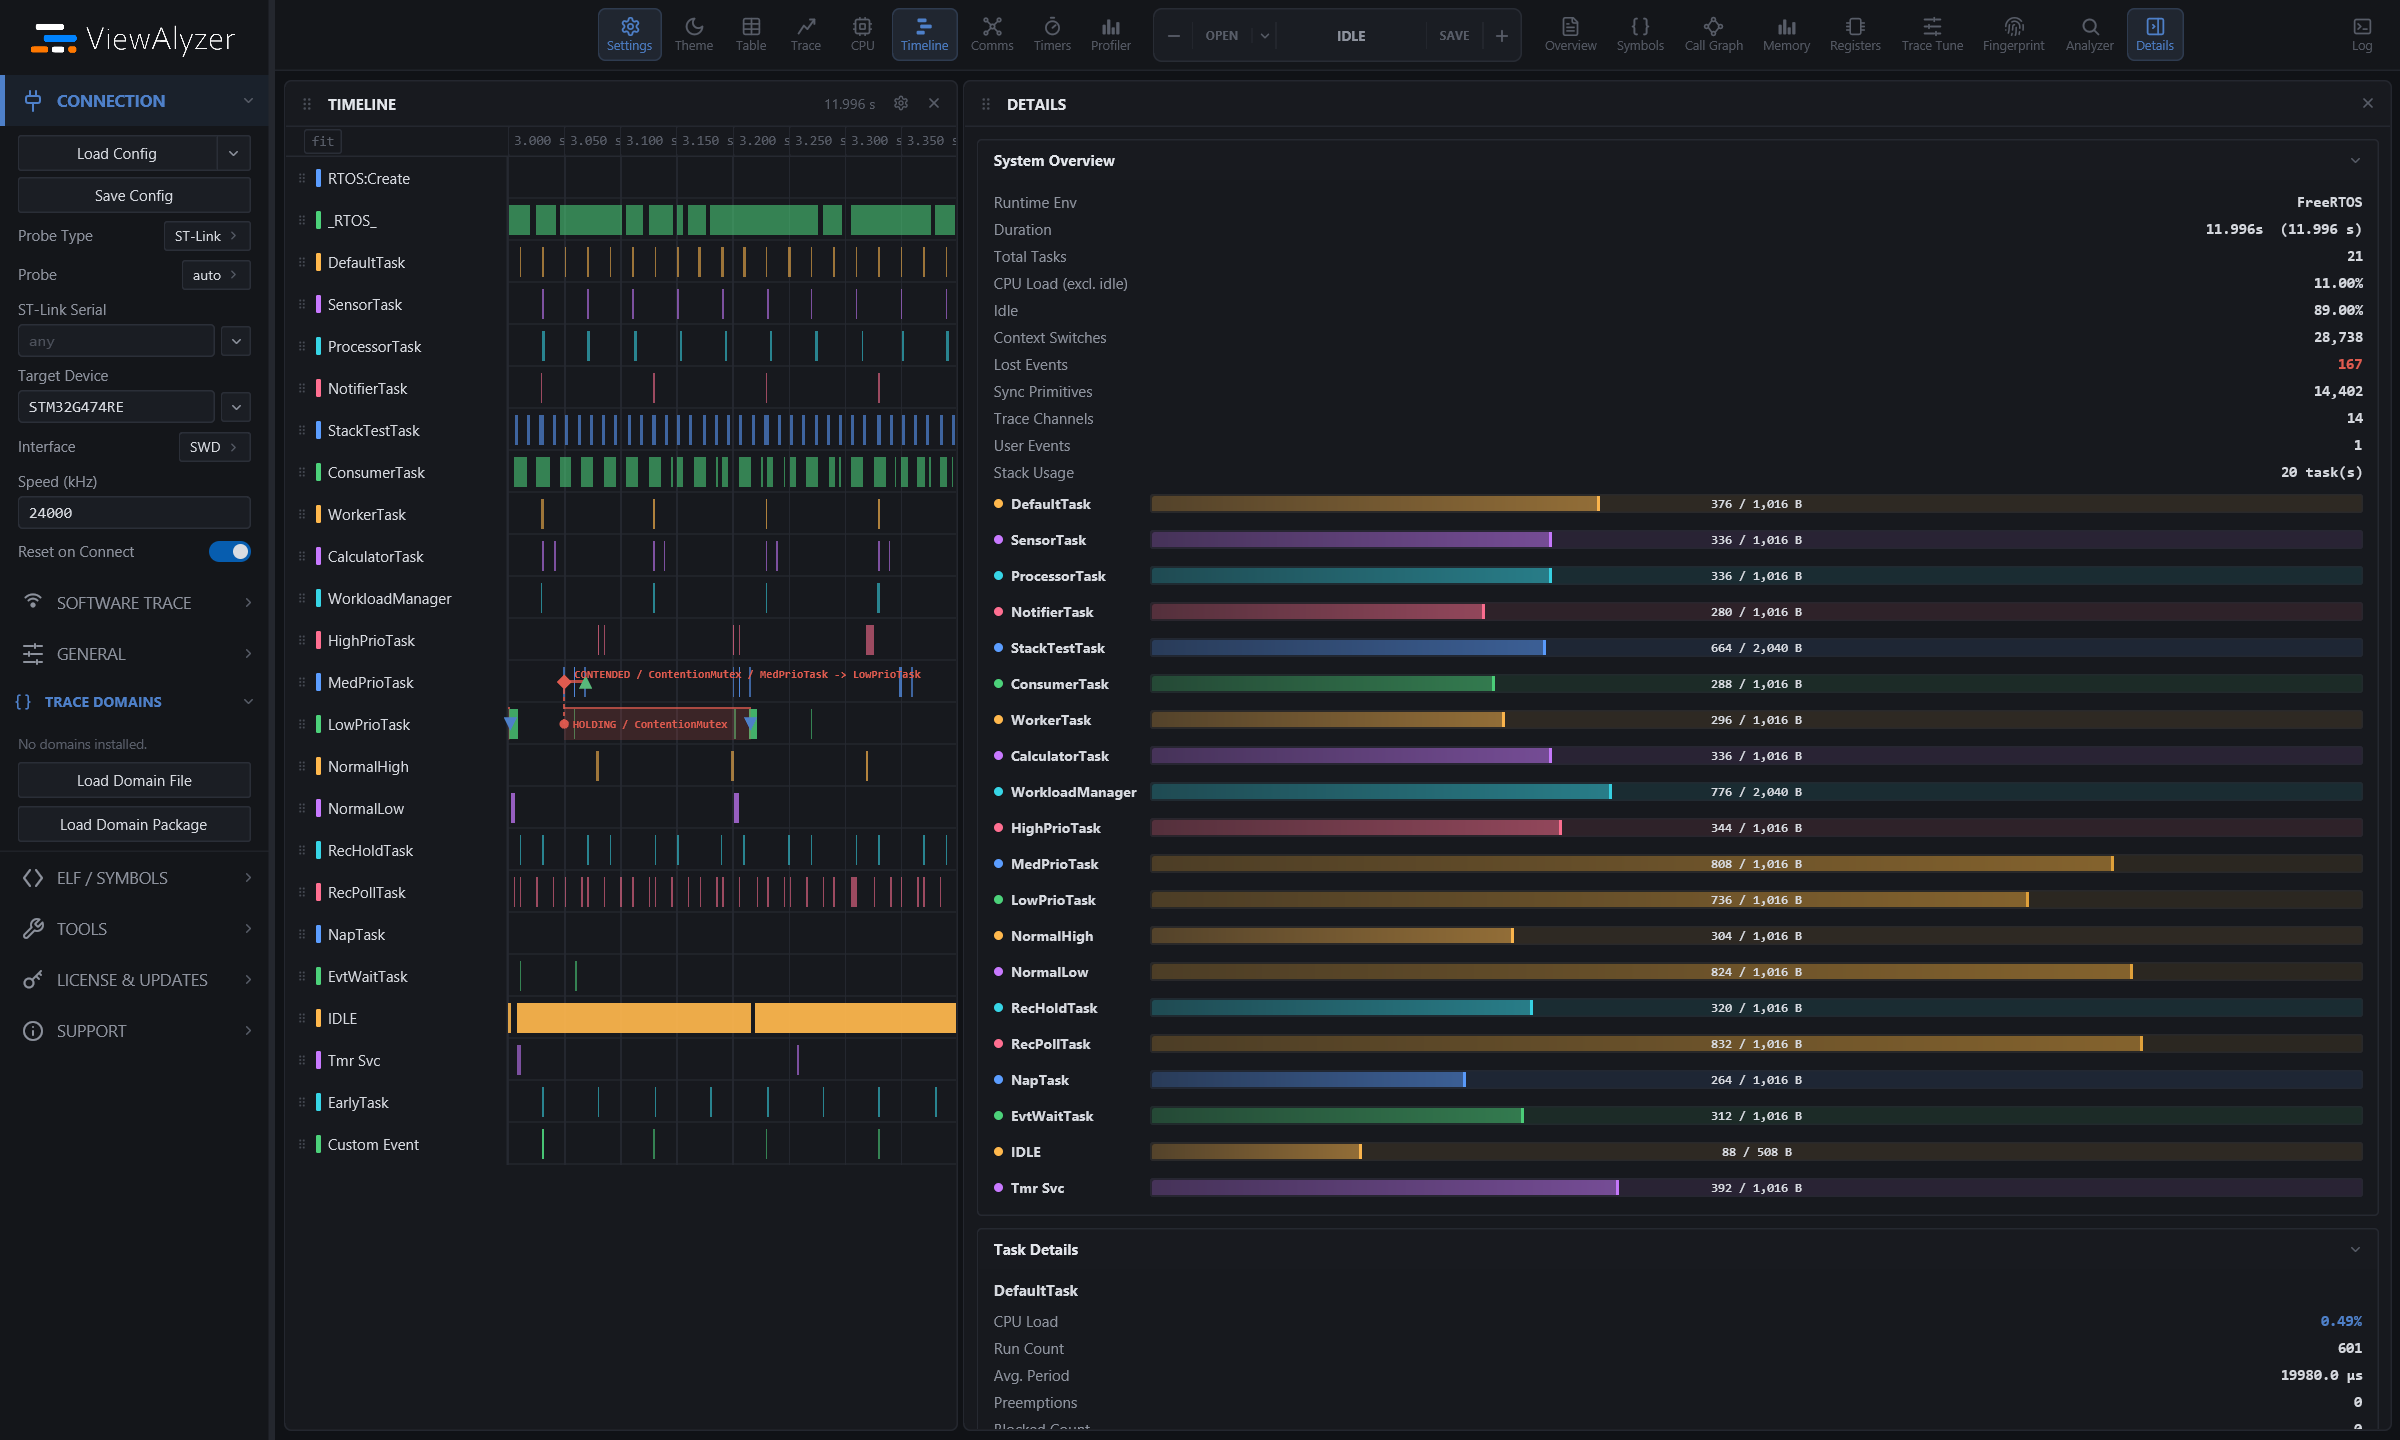
ViewAlyzer’s RTOS adapters record task and thread activity through kernel hooks. Follow scheduling, synchronization, queues, memory allocation, and timer activity alongside your application events.
Task scheduling and notifications, queues, mutexes, semaphores, event groups, kernel heap allocation, and software timer lifecycle.
Thread scheduling, message queues and FIFO/LIFO, mutexes, semaphores, event objects, kernel heap and slabs, and timer lifecycle.
Thread scheduling, queues, mutexes, semaphores, event flags, byte and block pools, and application timer lifecycle.
Thread scheduling, message queues, mutexes, semaphores, event flags, memory allocation and pools, and software timer lifecycle.
Every task, queue, mutex and notification in the recording becomes one map of recorded traffic. Replay the capture and watch messages move, failures land and queues fill.
Turn on traffic heat to color each path by volume, gather the busiest objects together, and narrow the heat to any interval on the timeline.
Explore the runtime map ↗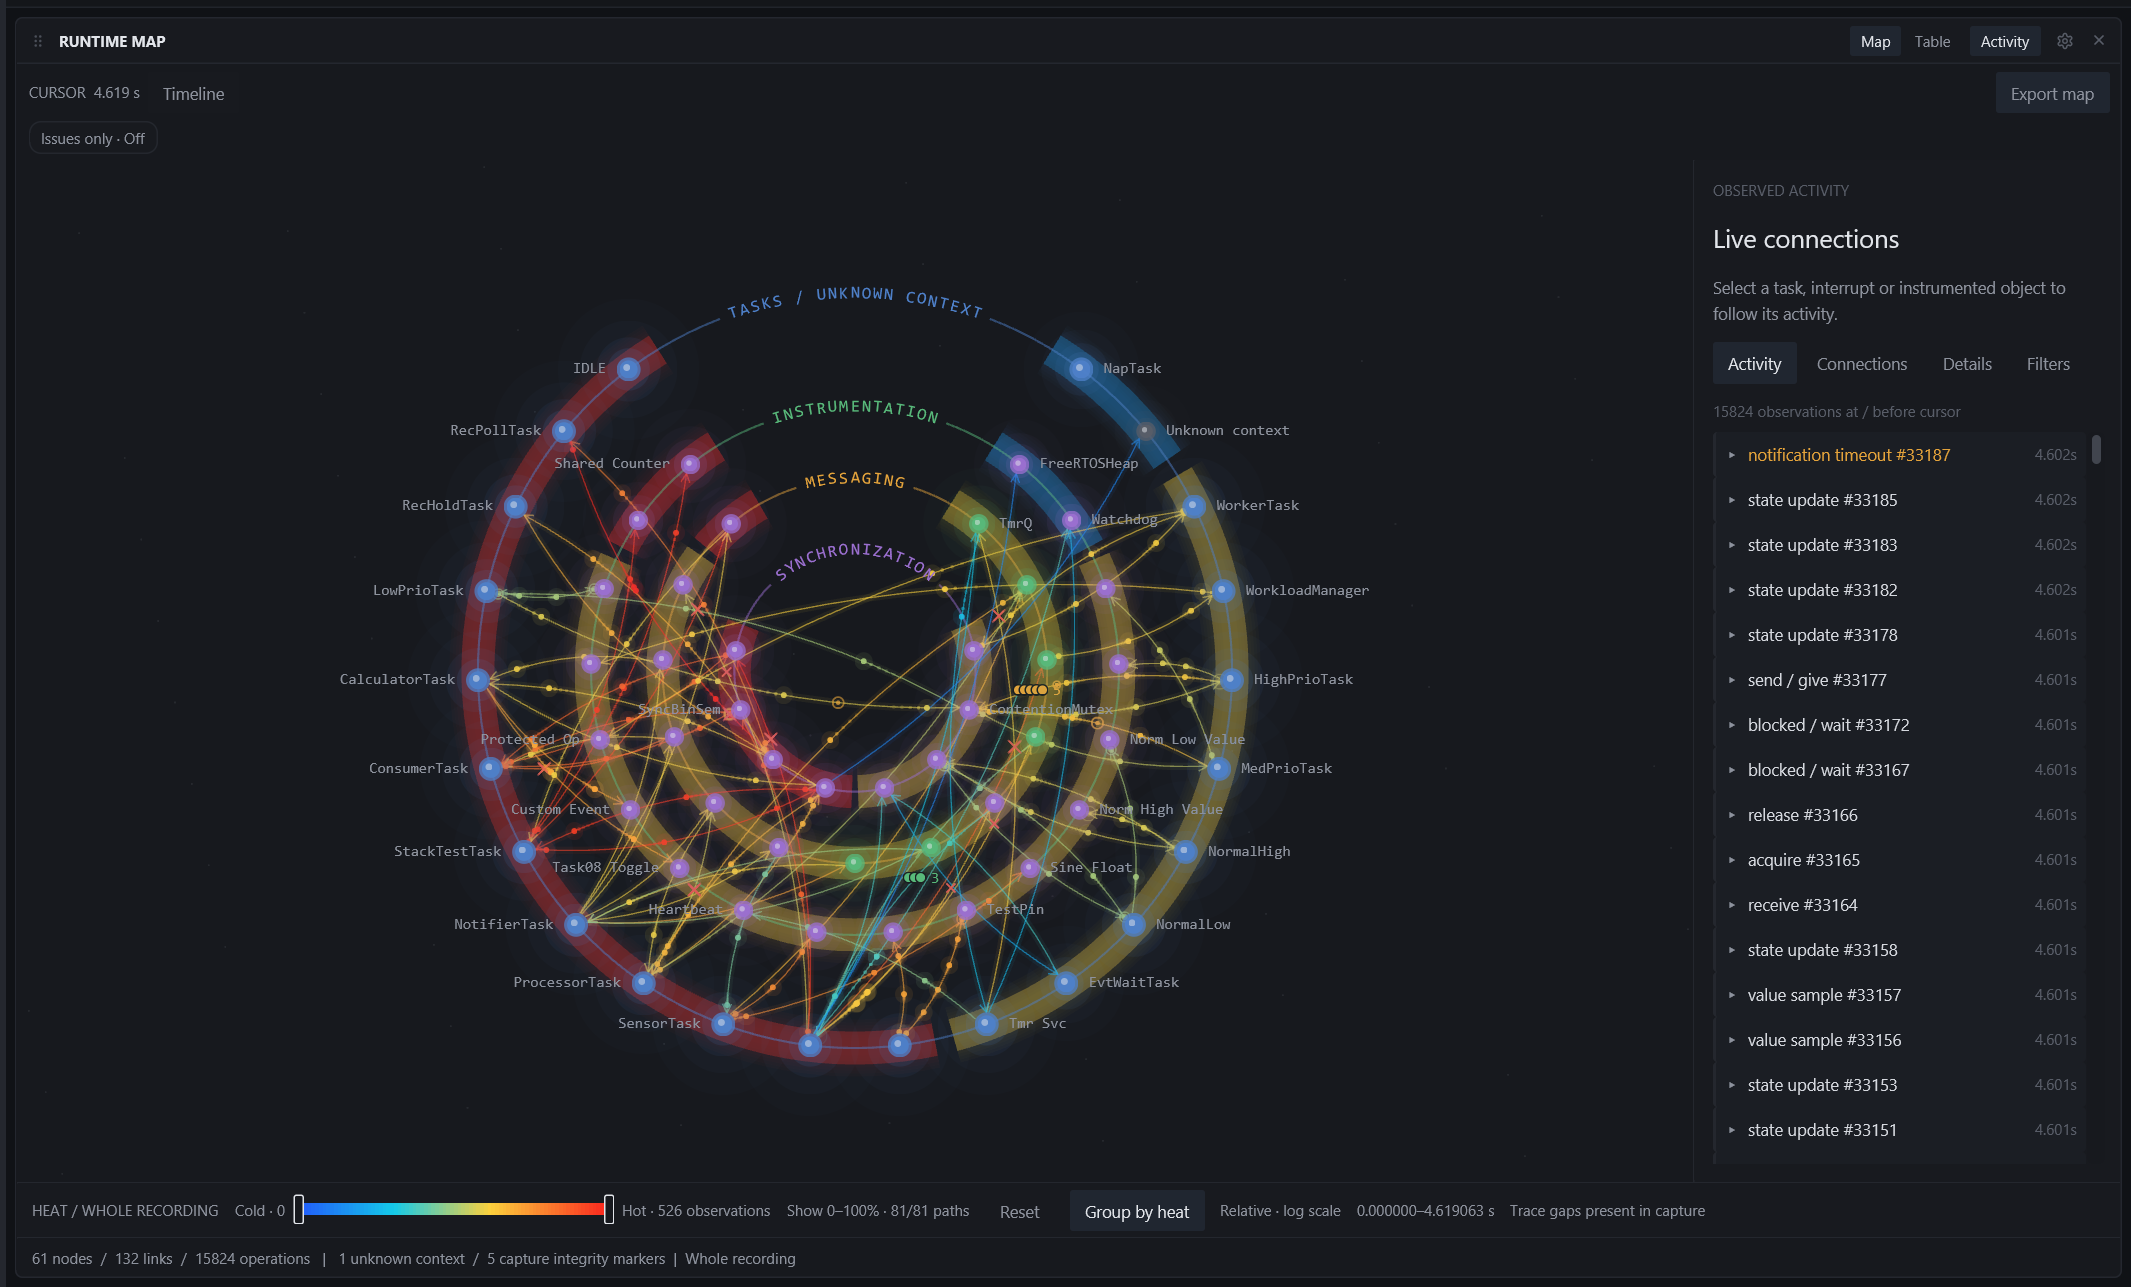
Replay the recording from the top bar and every view follows the cursor. Switch on Issues only and failures, timeouts and contention light up where they happened.
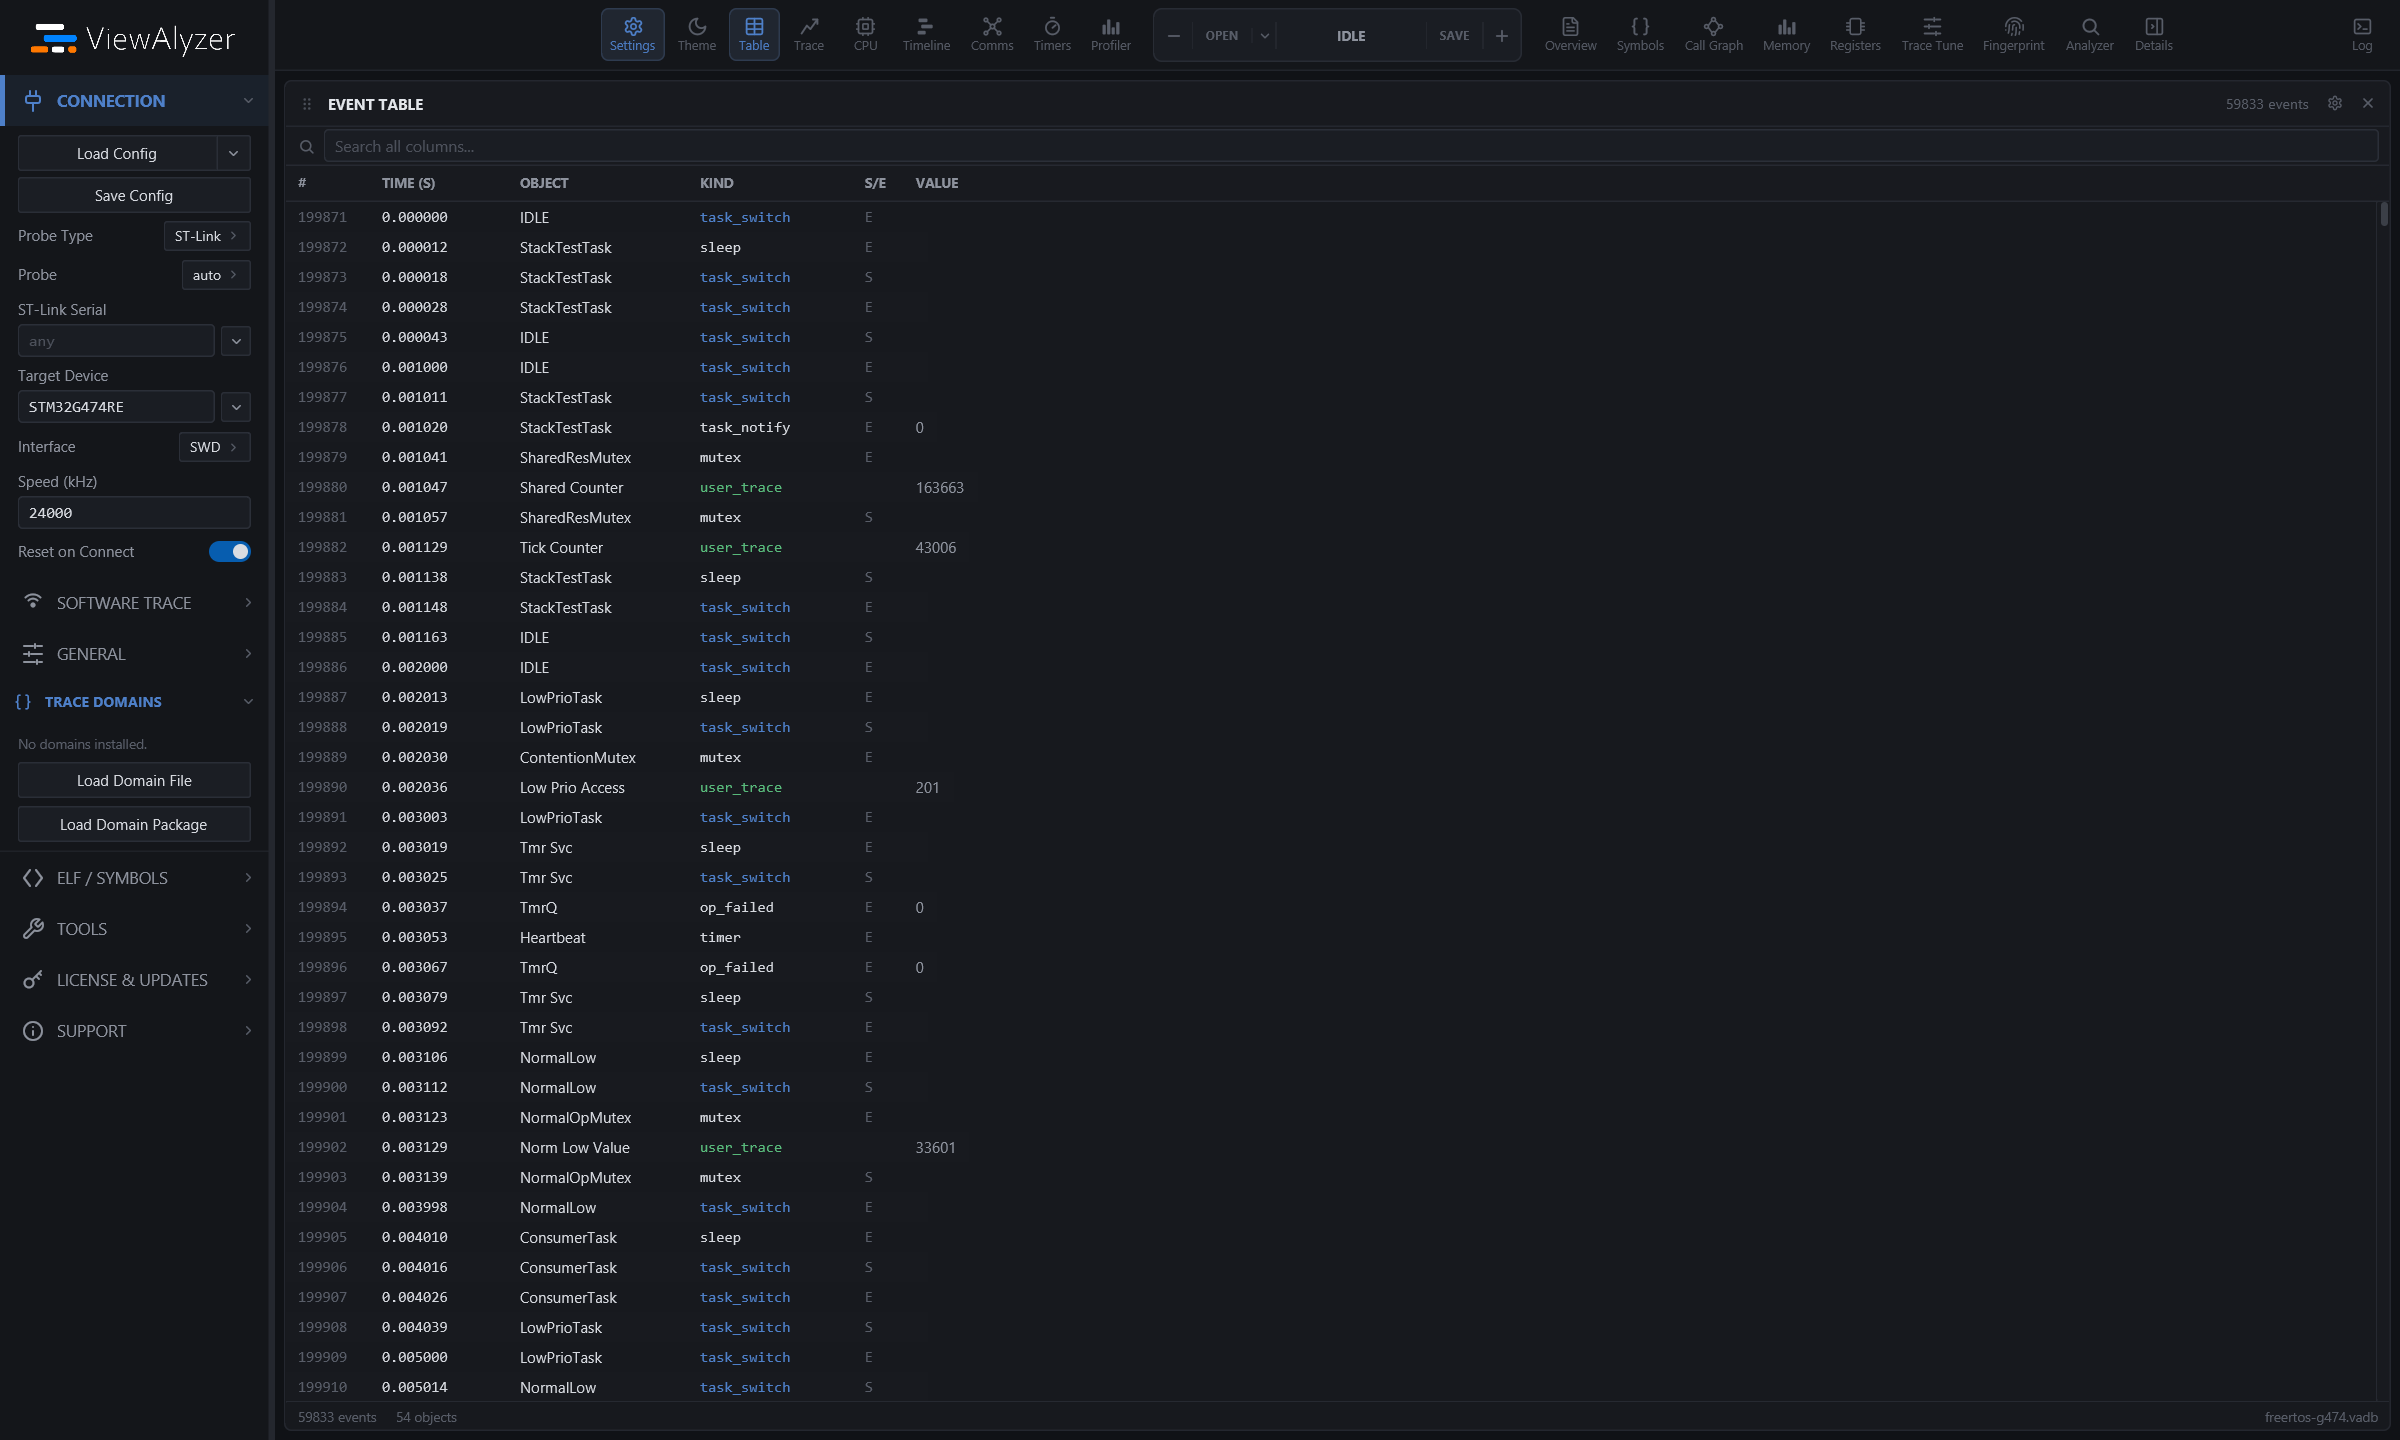
Open one in the inspector, then jump straight to it: the Timeline and Event Table land on the event. Here, DefaultTask retries every 20 ms against a queue that is already full.
Replay and inspect ↗A task stops making progress. Is it asleep, waiting for a resource, or ready but waiting for CPU time? View execution and recorded task states together to investigate the gap.
Missing state events remain unknown, so you can distinguish recorded evidence from an assumption.
Explore task states ↗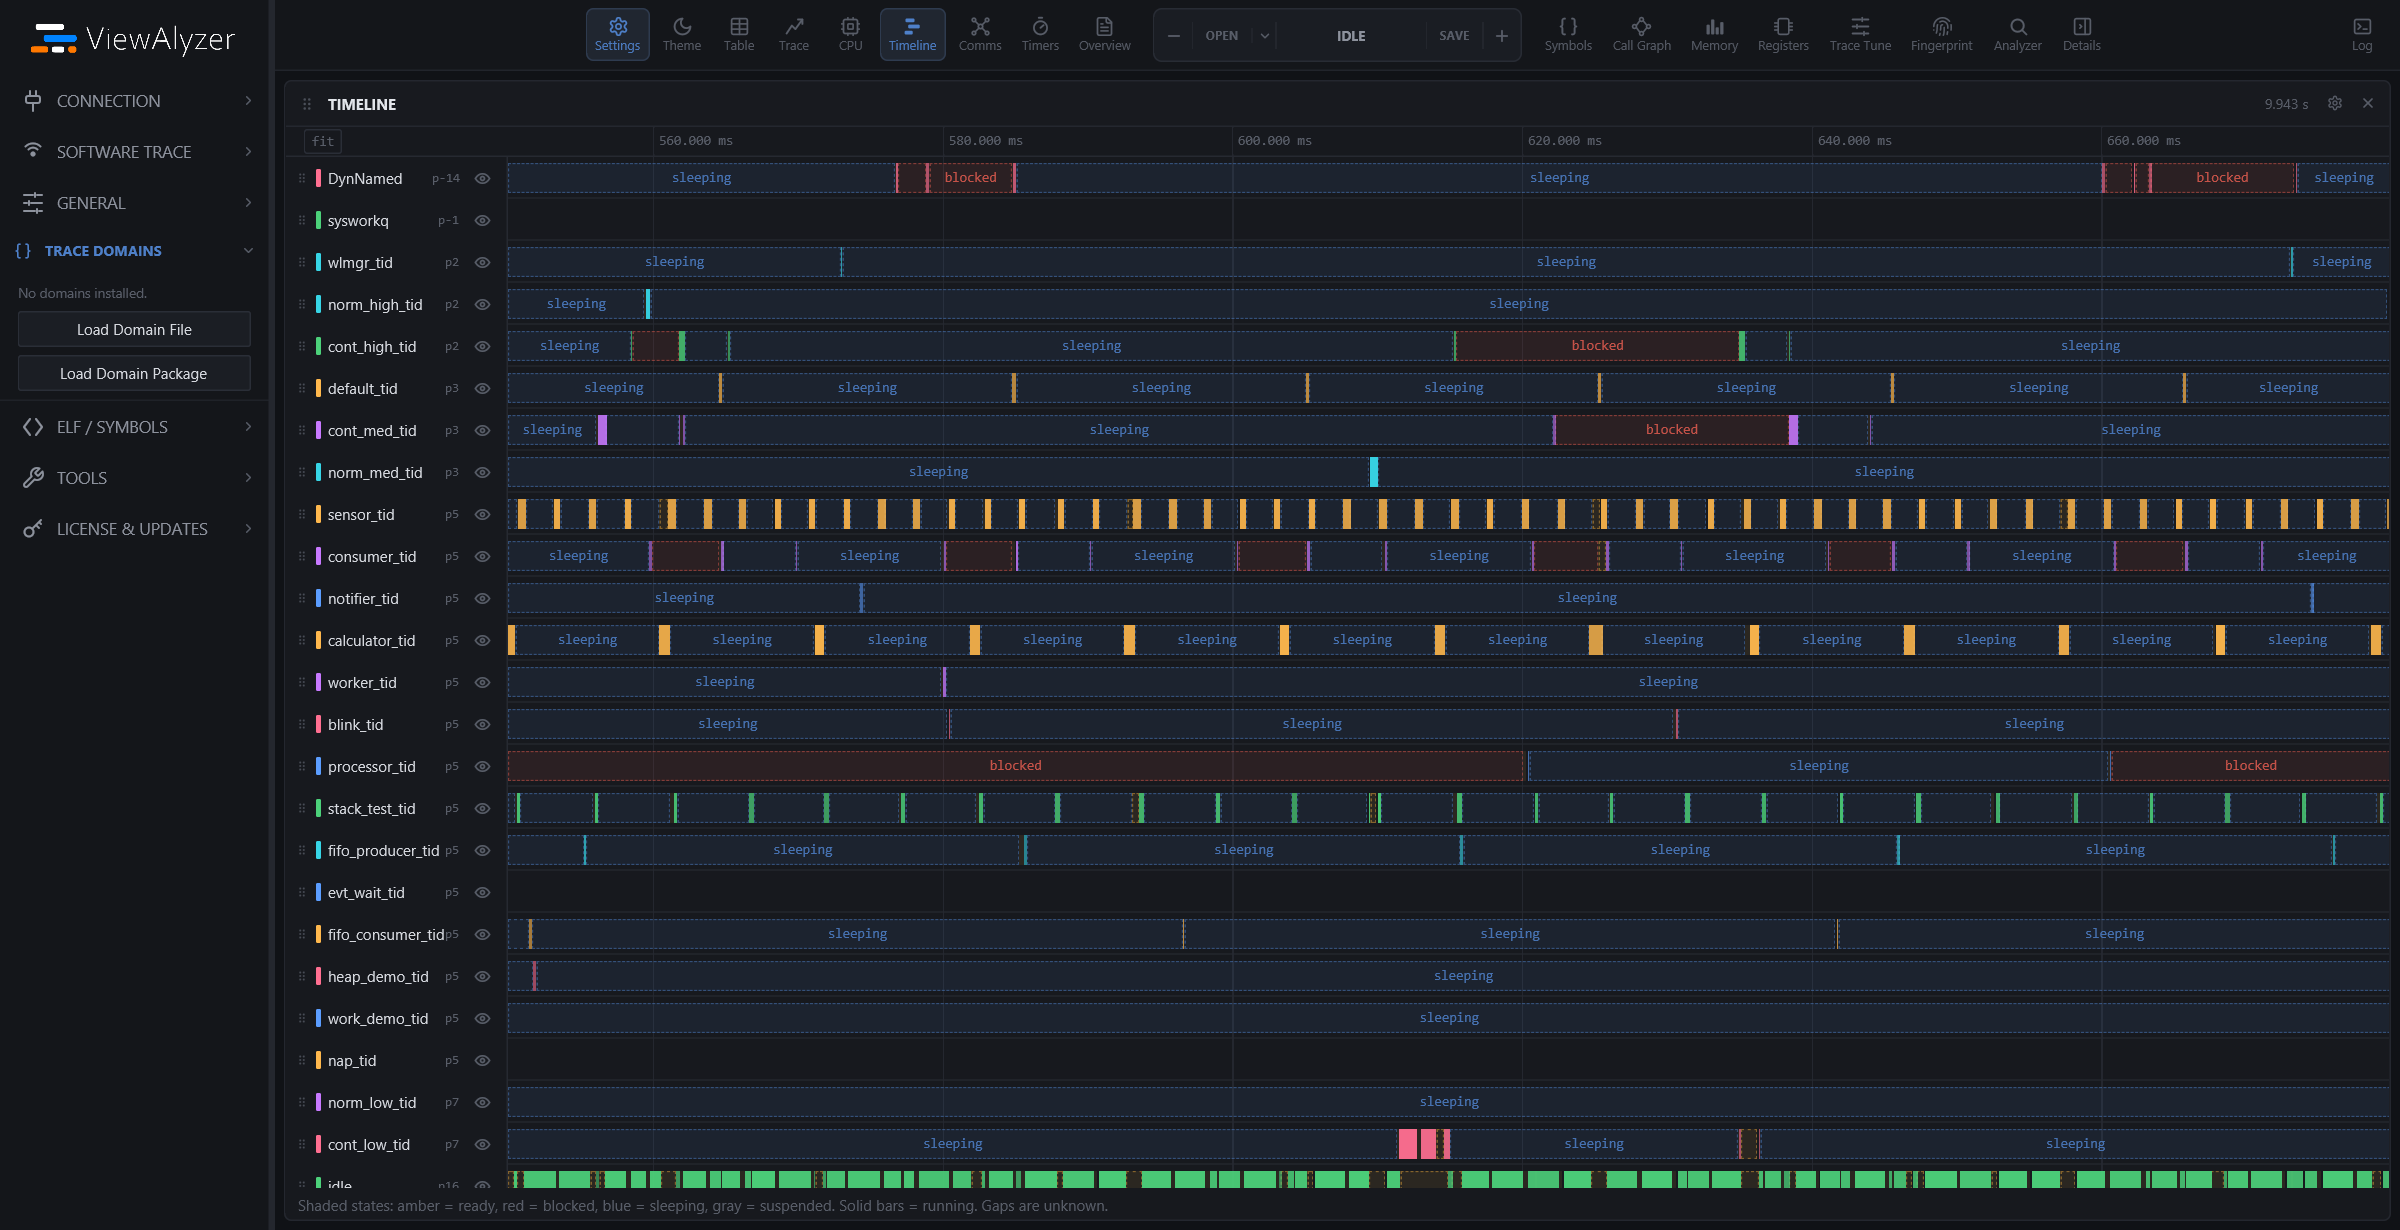
Scrub the recording to see occupancy at the cursor. Check peak usage, failed operations, and time spent full, then follow the consumer on the timeline.
RTOS adapter hooks supply resource observations. Enable the categories your investigation needs.
Inspect resources ↗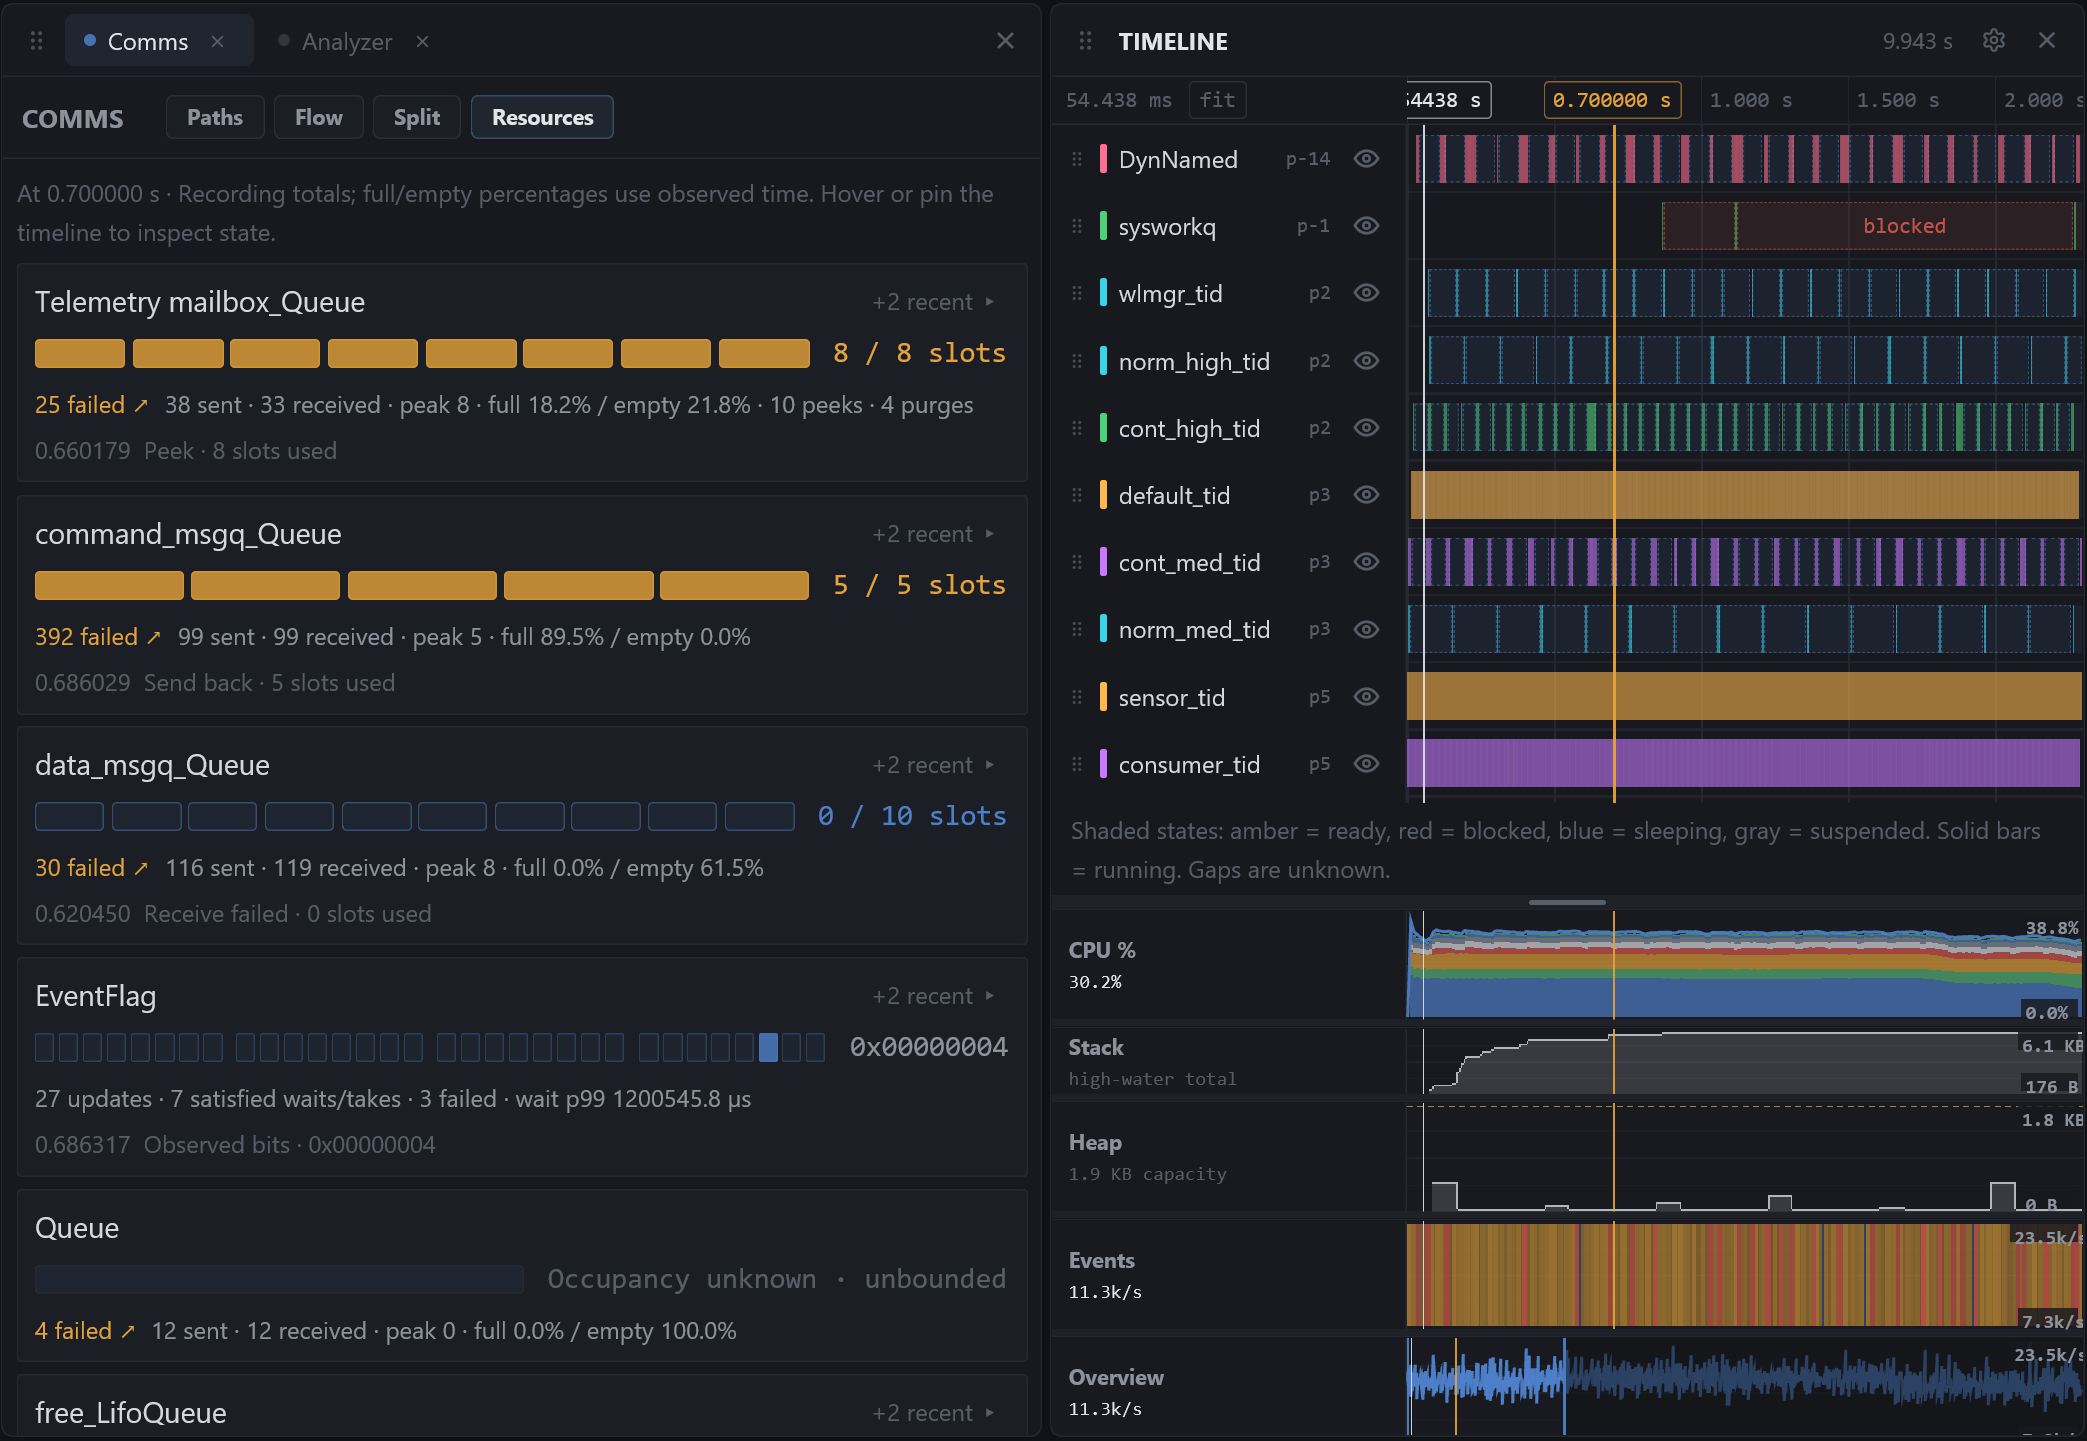
Line up timer arms, deadlines, callbacks, and cancellations. Select a timer to inspect its cycles and separate late execution from an intentional cancellation.
Investigate jitter, watchdog activity, and work building up in the timer service task.
Explore timers ↗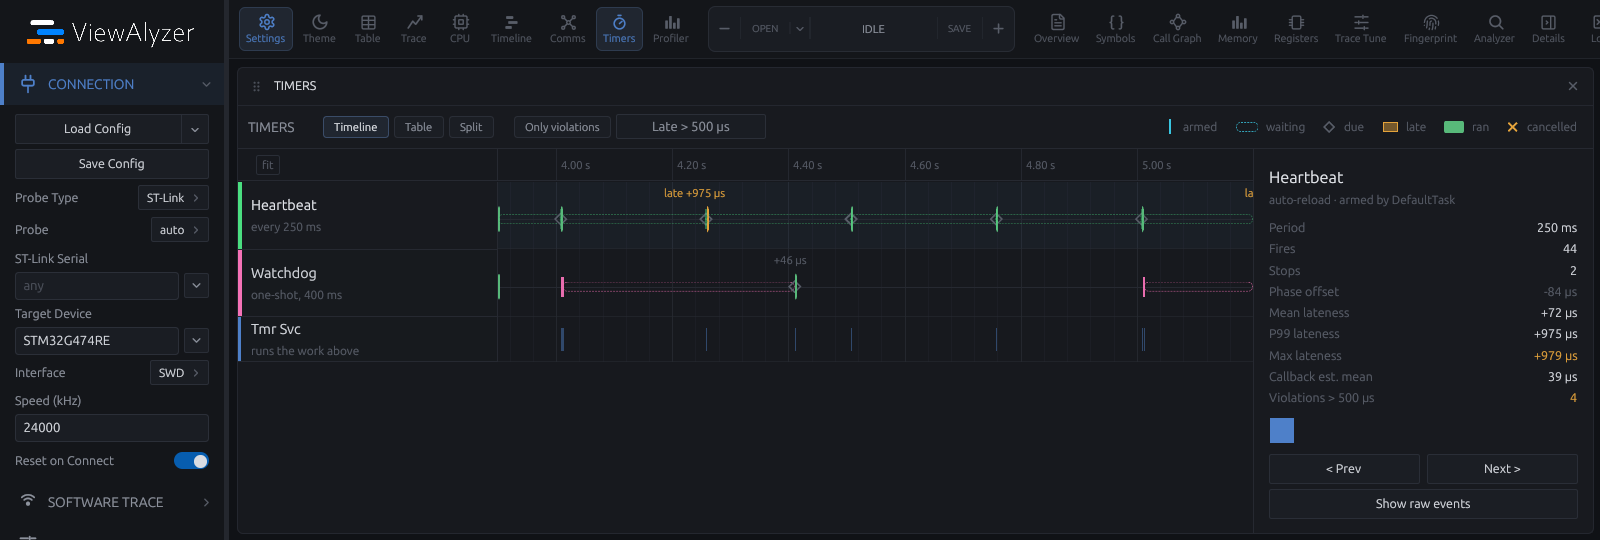
Click a queue’s failure count to see the individual operations. Select an instance to jump to the exact timeline event, with its task or ISR and observed occupancy.
An unsuccessful nonblocking poll can be expected. Use the surrounding activity to understand whether a failed operation matters.
Follow a queue failure ↗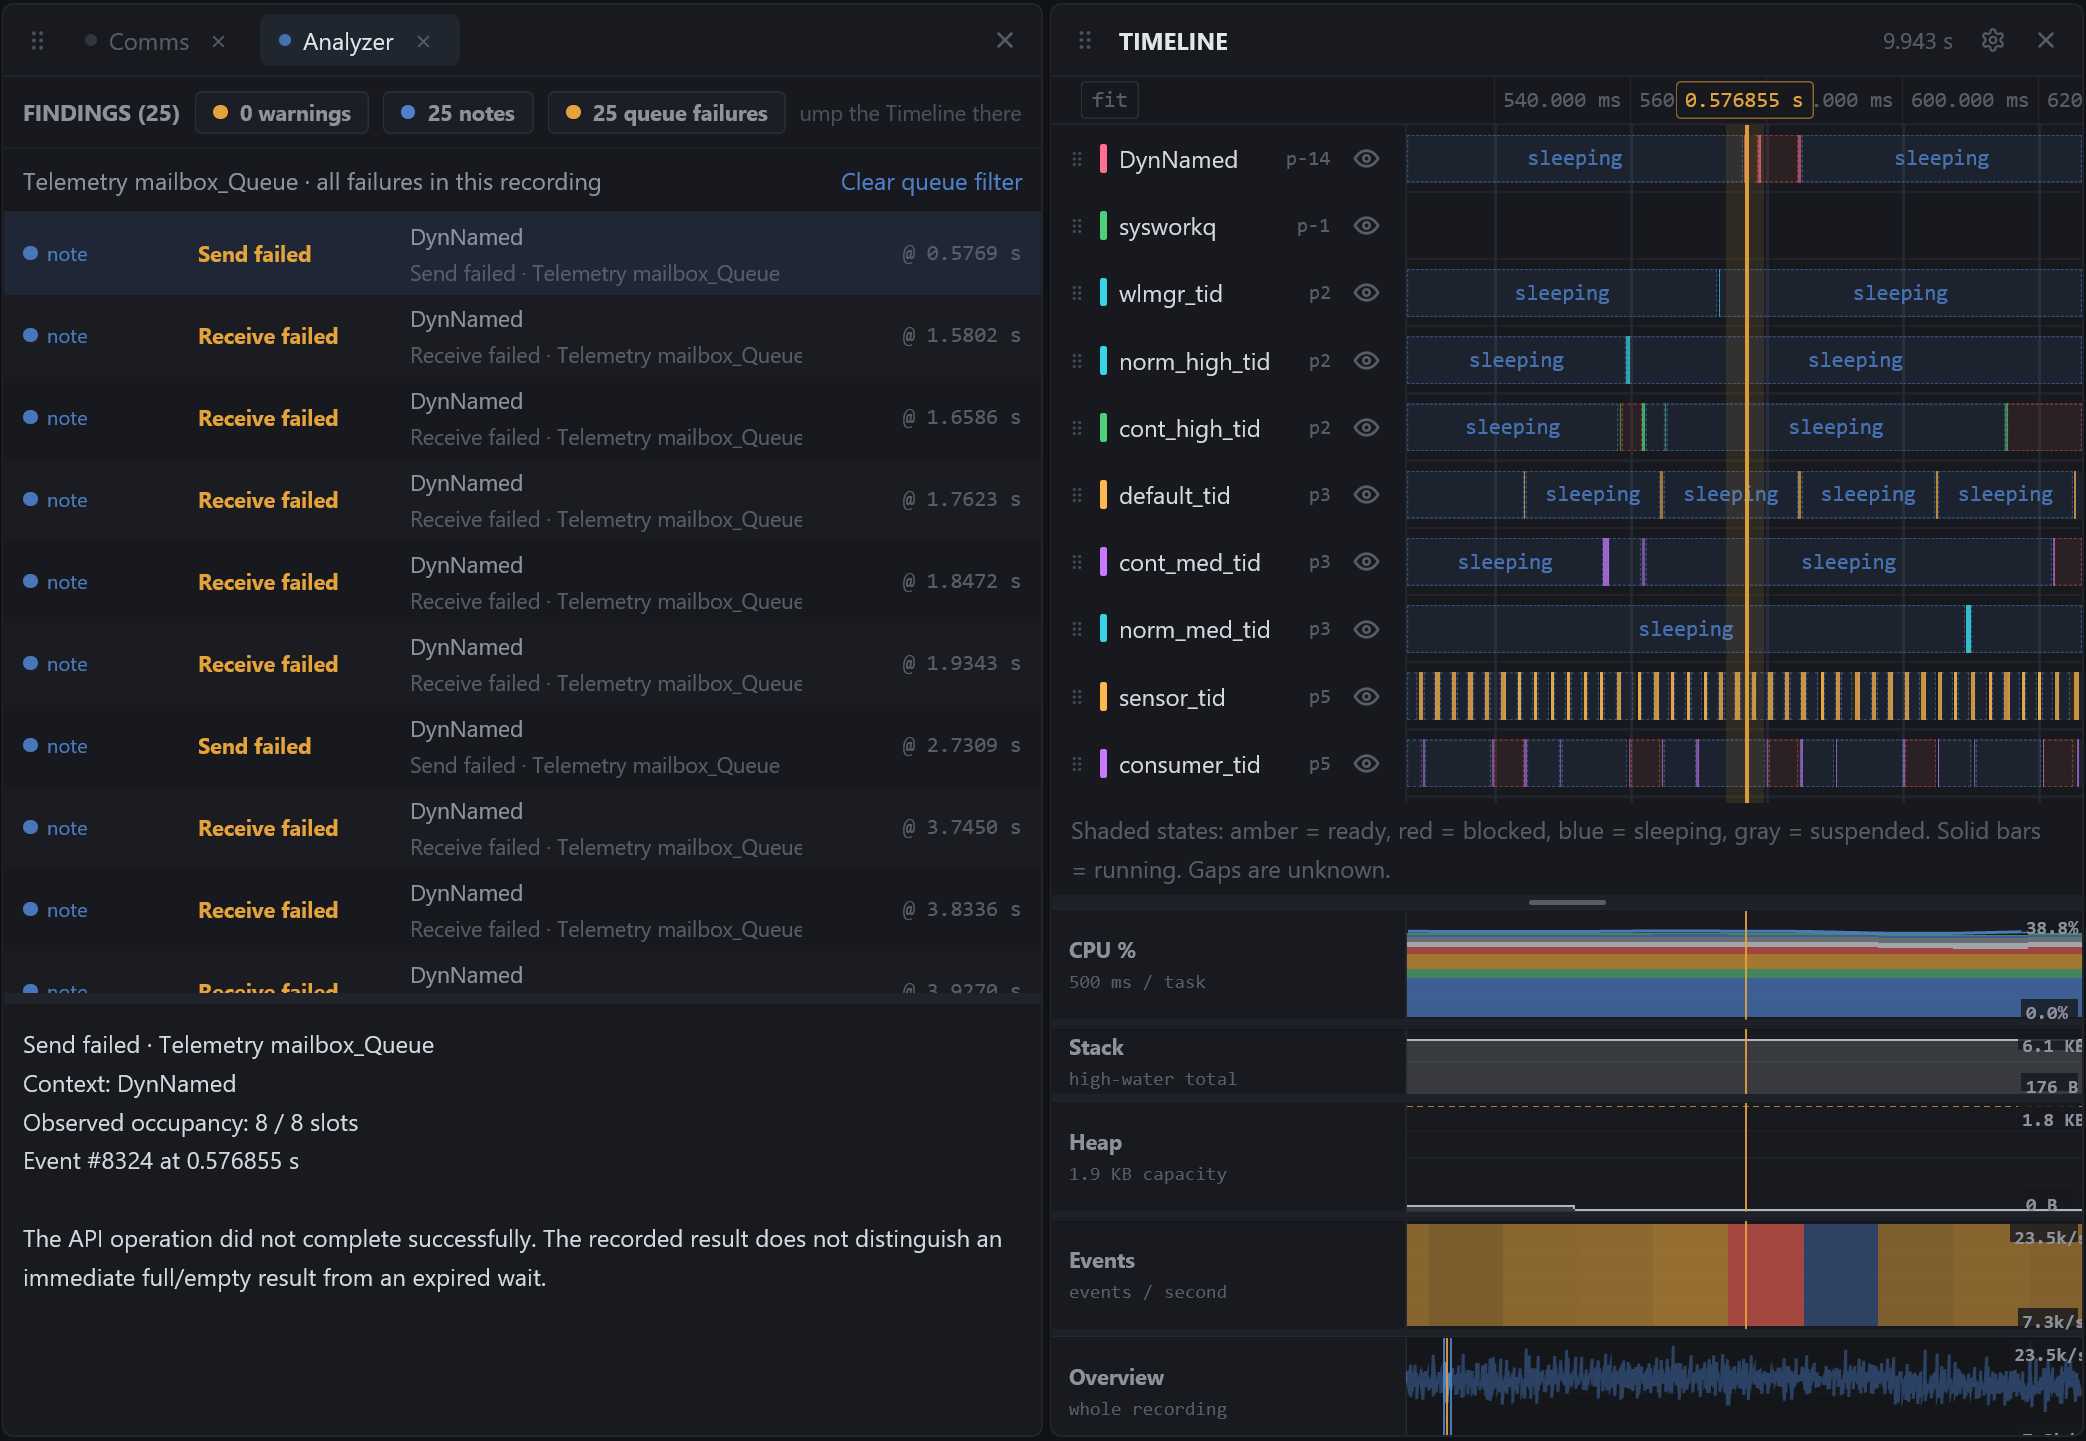
Open the views you need. Each panel follows the same capture and shared cursor.
Plot application values beside task activity. Connect a sensor spike or changing control output to the work running at that moment.
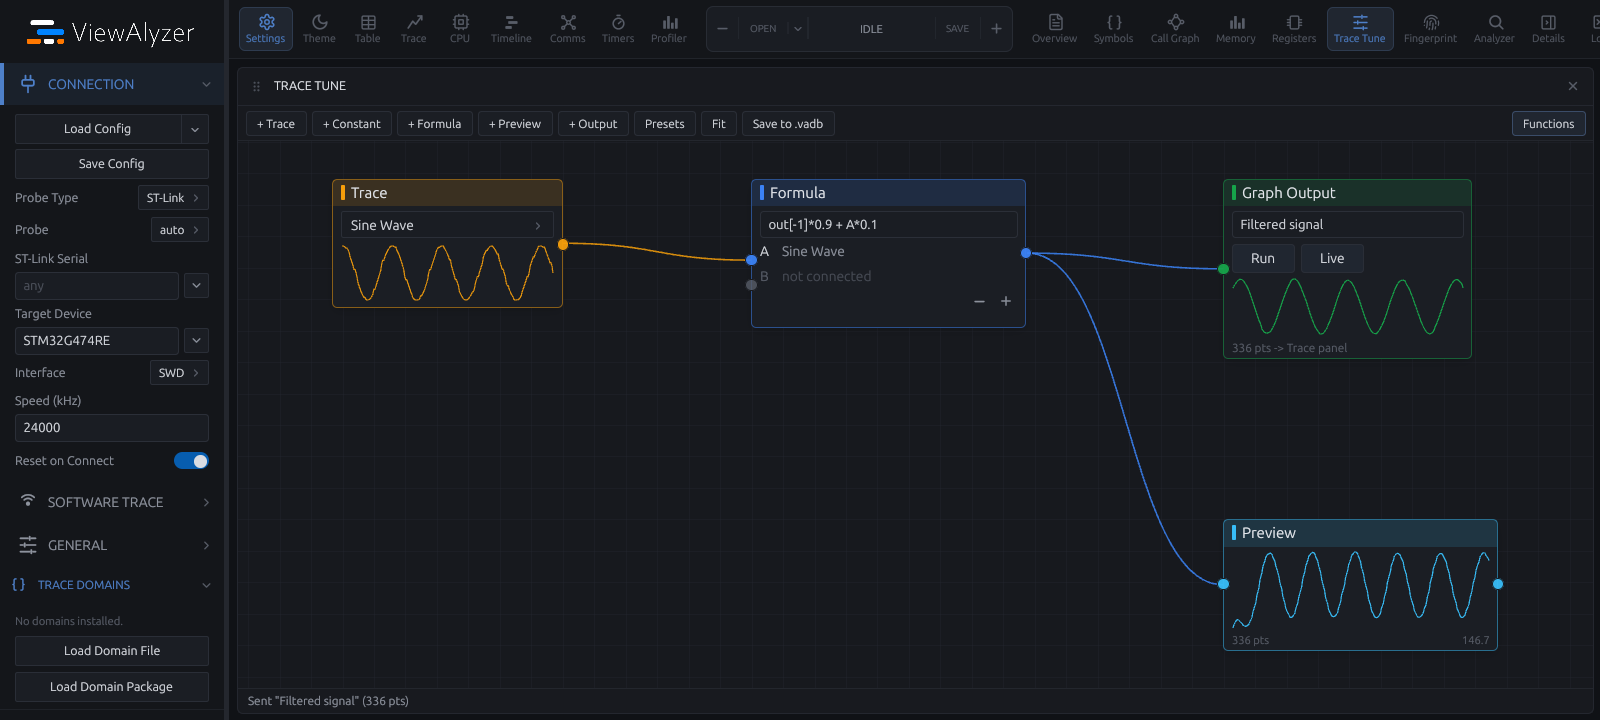
Signal charts ↗Build derived signals with Trace Tune’s visual node graph. Filter inputs, convert units, and combine channels without another firmware run.
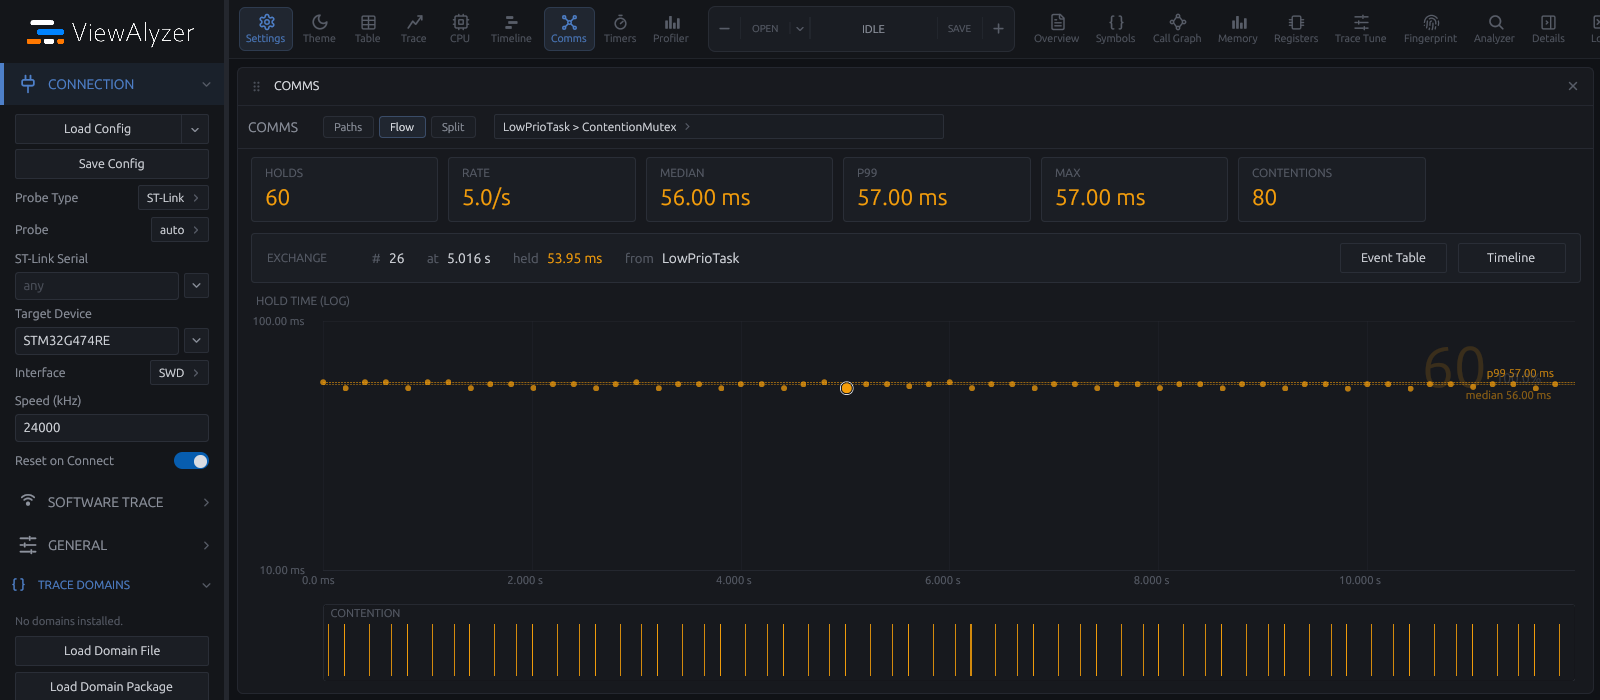
Trace Tune ↗Inspect queue and semaphore exchanges or mutex hold times. Scatter plots surface outliers that averages can hide.
Communication analysis ↗Place time markers across the timeline and signal charts. Read the interval between events as you zoom, pan, and scrub.
Time markers ↗Use the CLI and queryable recordings to compare runtime behavior between builds and inspect the evidence behind a change.
Automation documentation ↗Trace Domains add protocol and subsystem views to the workspace, with schemas and decoders for domain-specific events.
Trace Domain catalog ↗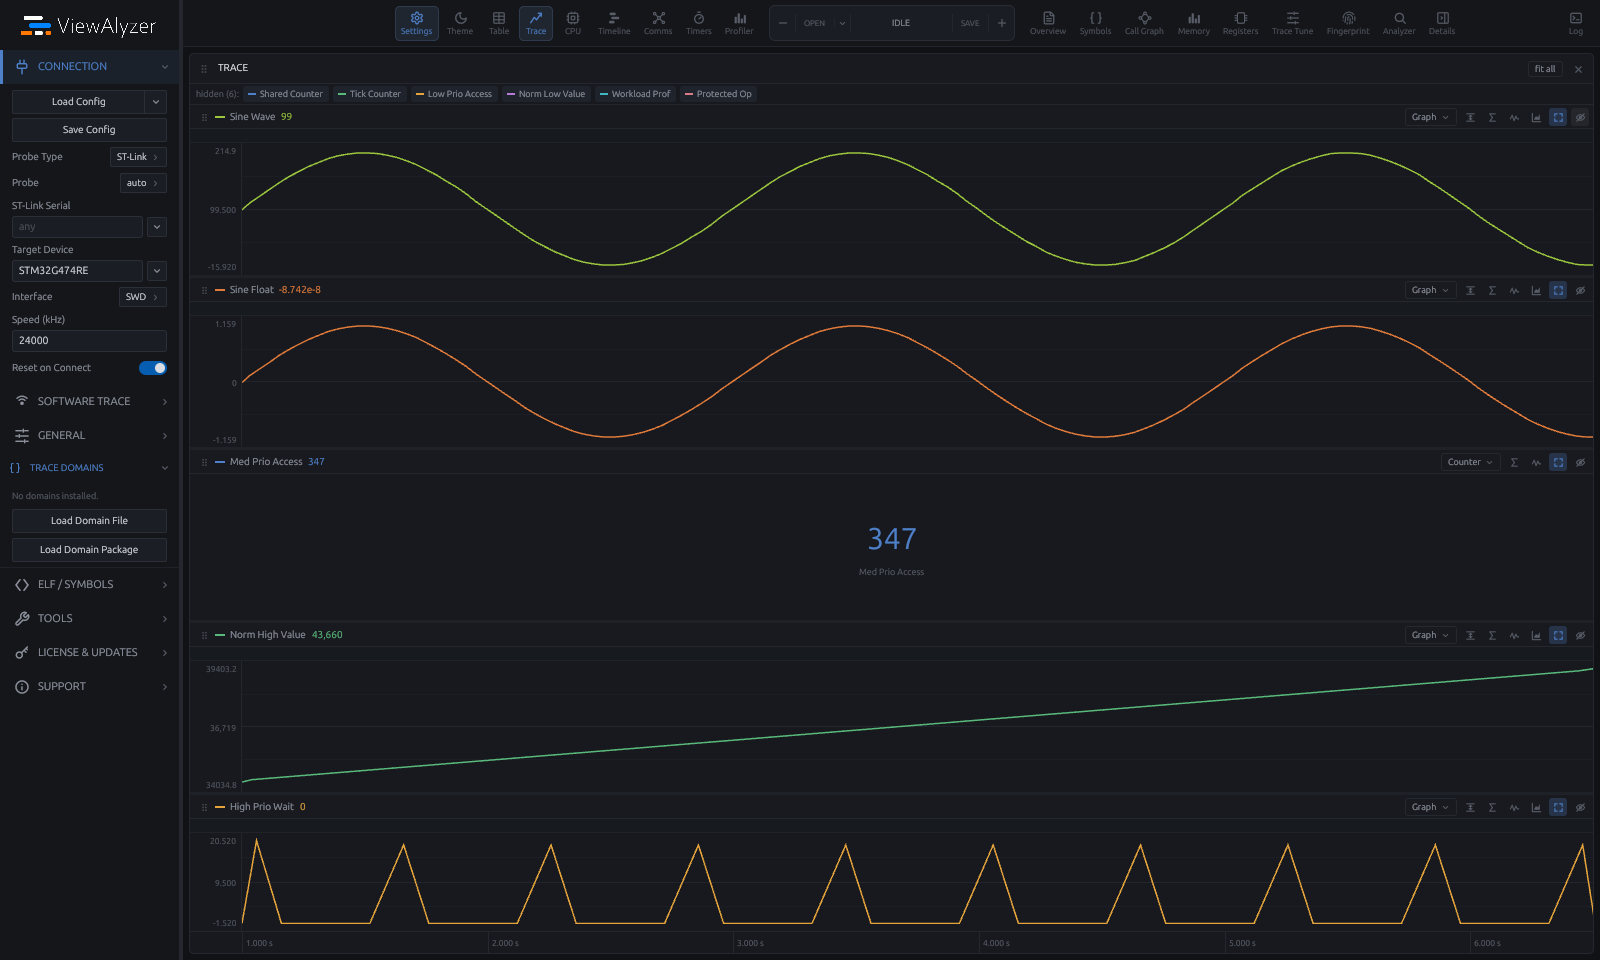
Compare capture paths, analysis views, automation, and evaluation limits in the published feature matrix.
Compare featuresSee CPU use, timing, and RAM measured in the same telemetry application with recording off, ViewAlyzer, and Percepio.
See firmware impactRelease notes ·
Inspect live recordings without stopping capture, find issues faster in Analyzer, and get more precise CPU, stack, heap, and timer measurements.
Read the release highlights and fixes, with a history of published versions. This release includes every change since 1.3.1, the previous public release.
Read release notesThe new viewer still reads older recorder streams. Upgrading the recorder requires the new viewer; fingerprint baselines and custom automation need migration. ESP32 debug-probe capture is temporarily unsupported.
Check compatibilityNo account or license needed to evaluate. Get the app and the Apache-2.0 recorder library, then integrate the recorder with your RTOS or bare-metal firmware.
ViewAlyzer 1.4.0 · SHA256 checksums
Updating an existing installation? Read the release notes and upgrade checklist.
Prefer your editor? Install ViewAlyzer for VS Code ↗
Free evaluation: 5-second captures, 5-second cooldown, 10 timeline lanes, and variable watching at 100 Hz across 4 symbols. Compare Free and Pro →
One Pro license for ViewAlyzer, BKPT Debug, and BKPT Toolkit.