 DOCS/VIEWALYZER/RUNTIME MAP
VIEWALYZER · GPUI EDITION
DOCS/VIEWALYZER/RUNTIME MAP
VIEWALYZER · GPUI EDITION
Runtime Map
A map of what your firmware actually did: every task, interrupt and instrumented object that appears in the recording is a node, and every recorded interaction between two of them (a queue send, a semaphore take, a mutex acquire, a notification) is a link. Traffic animates along the links as the cursor moves, failures are marked where they happened, and pending queue items sit on the object as dots.
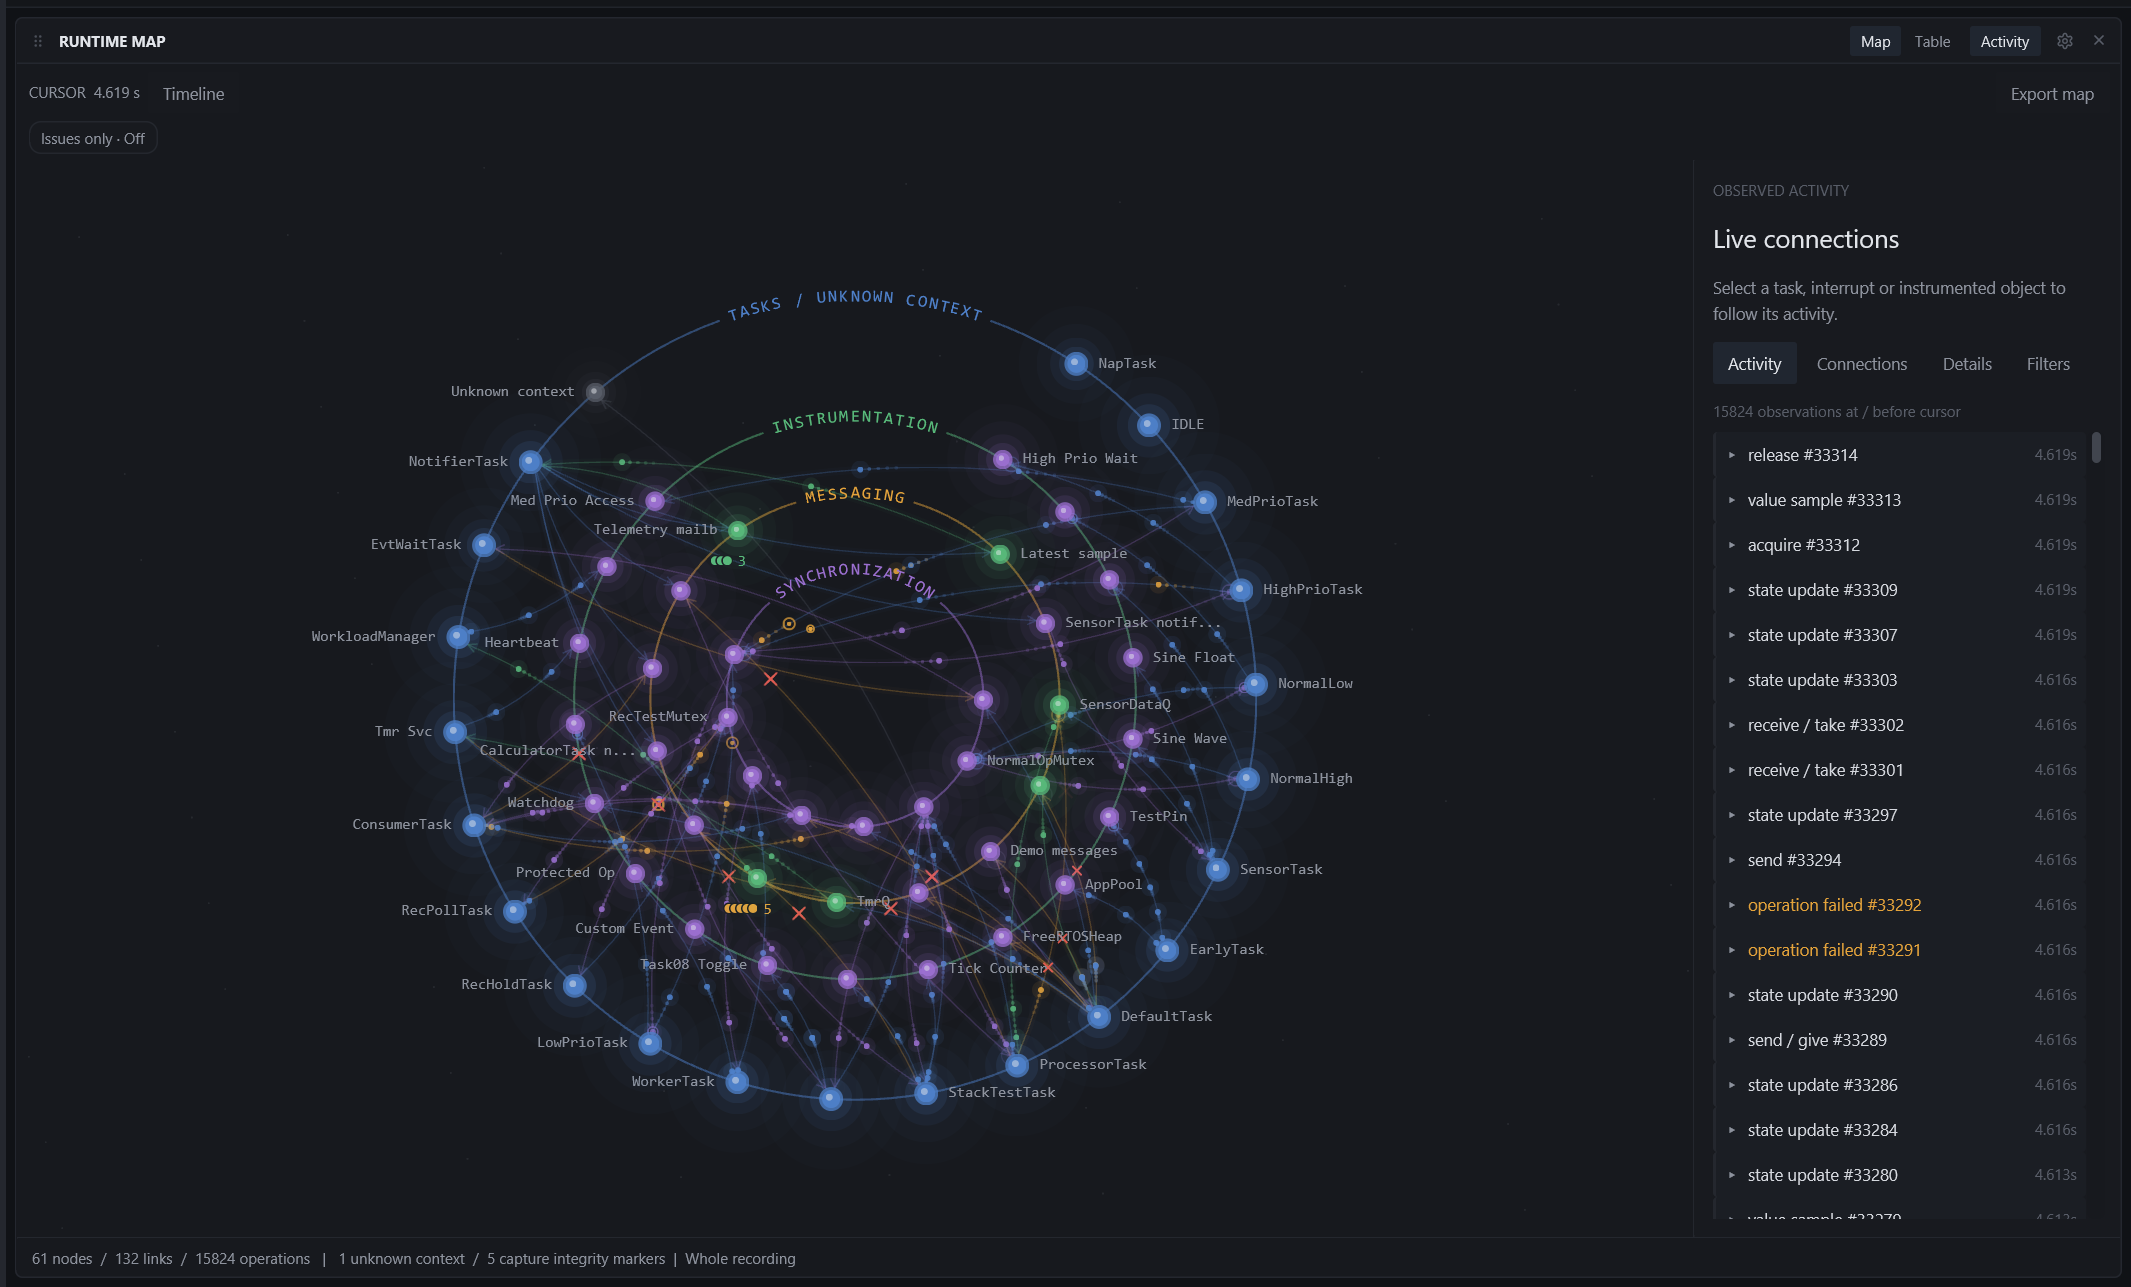
The map only draws what was recorded. Nothing is inferred from source code, and a missing link means no recorded operation, not proof that the code path cannot run.
Needs: a recording (or a live capture) with task and kernel-object events. Queue occupancy, notification values and stream/message buffers need the matching recorder detail hooks; older recordings still map, with those details left out.
Reading the map
- Node colour says what kind of thing it is: blue for tasks and interrupts, green for queues and buffers, purple for synchronization objects, user traces and other instrumentation, grey for activity with no known task context.
- Links carry one colour per operation kind. A moving dot on a link is a recorded event near the cursor; dot travel is illustrative, the event time is measured.
- Red crosses mark failed operations and timeouts at the affected object; an amber ring marks mutex contention. Both cues last 600 ms around the event.
- Stacked dots with a count beside a queue or notification are its pending items at the cursor (the backpressure display).
- The status strip at the bottom counts nodes, links and operations in the mapped range, unknown-context activity and capture integrity markers.
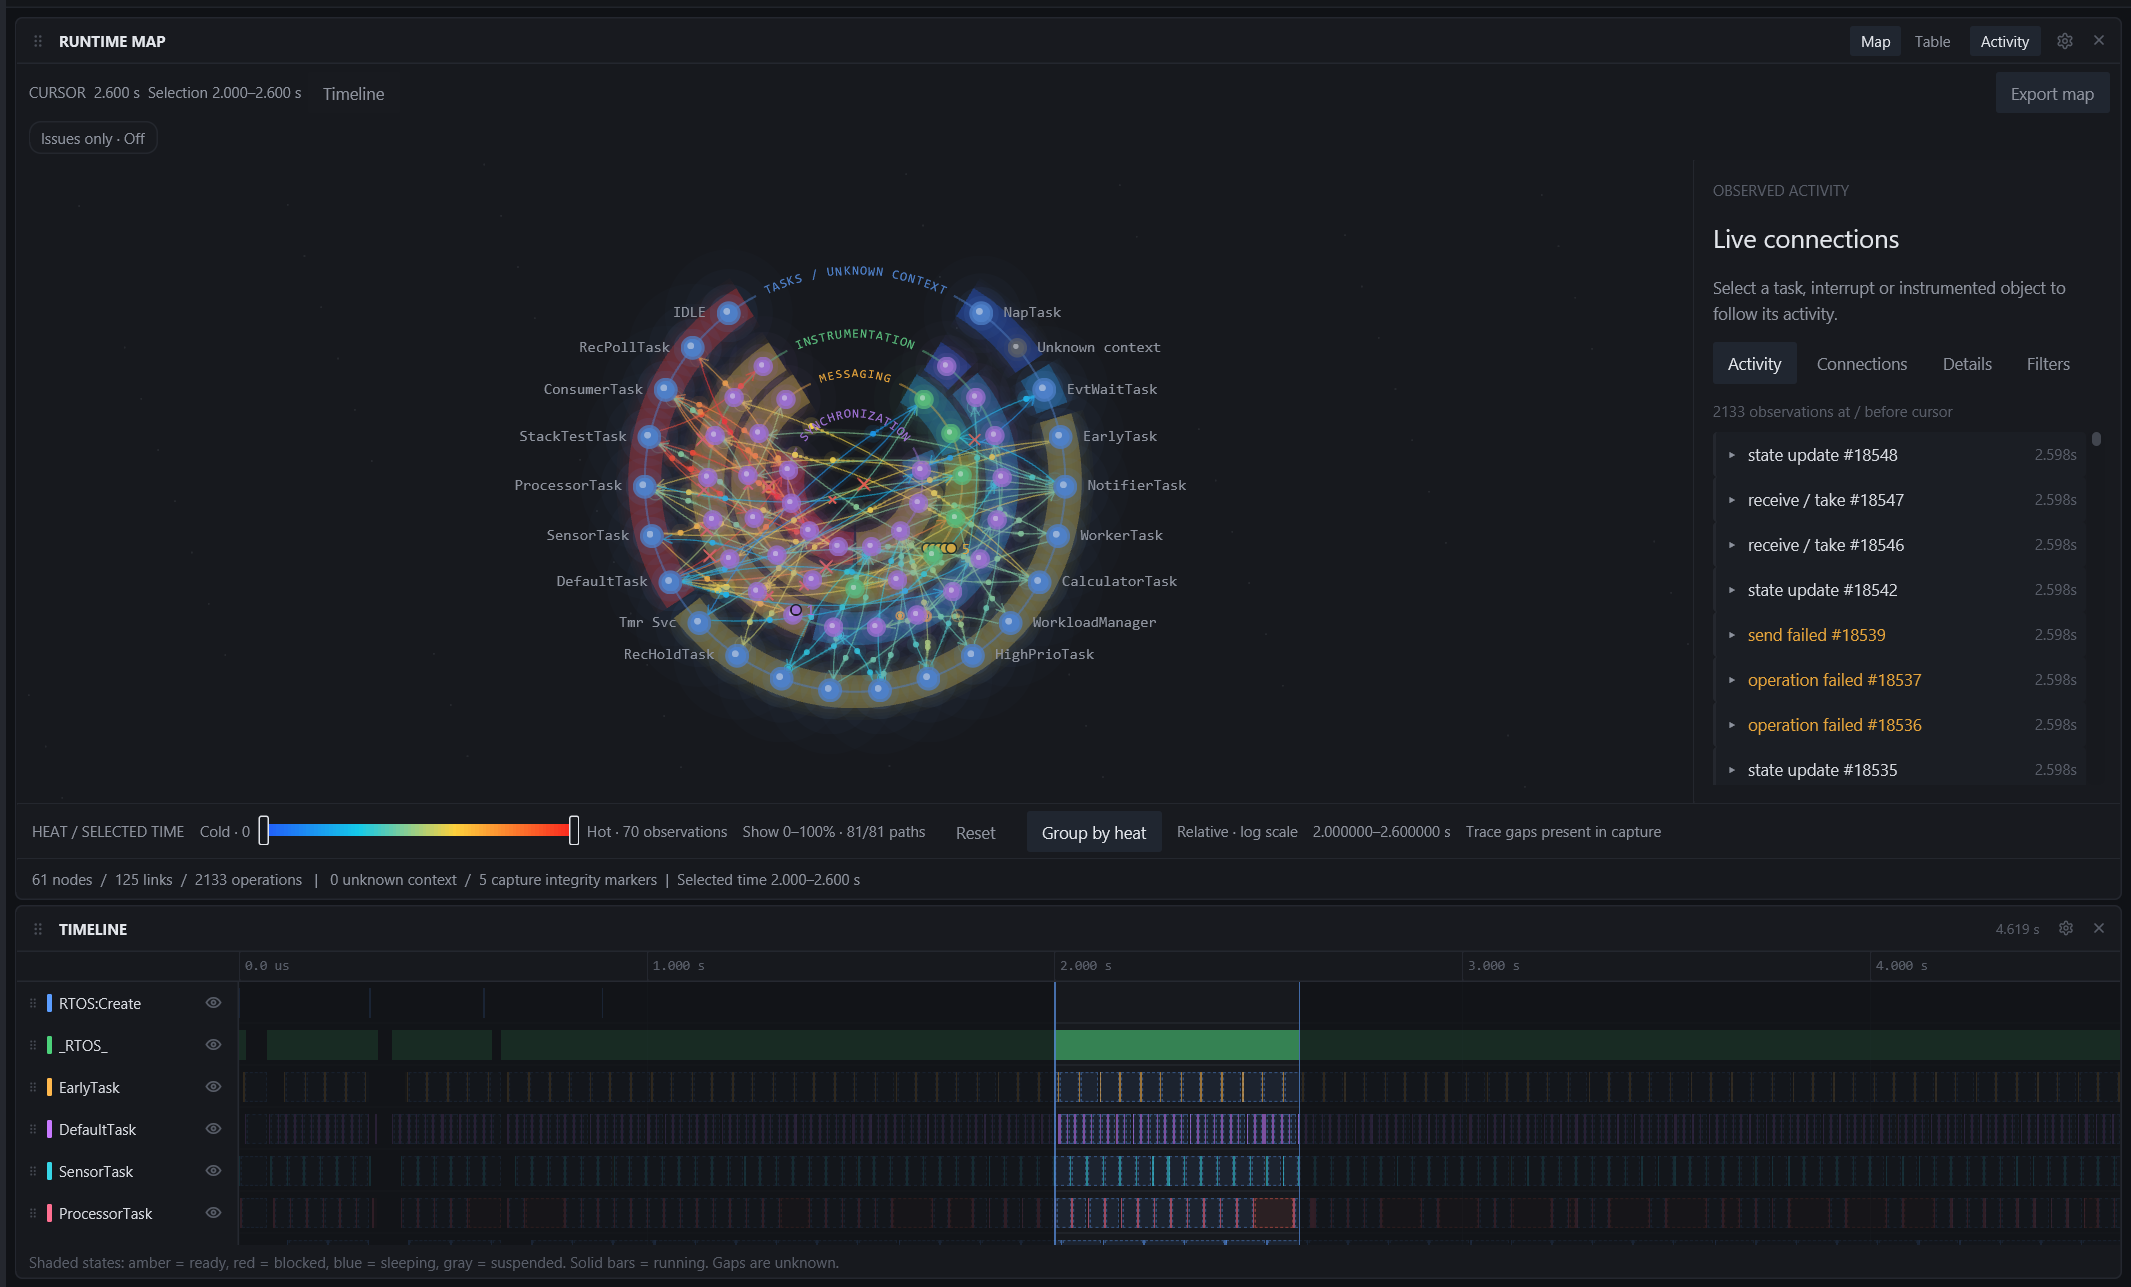
The map follows the shared cursor: scrub the Timeline and the traffic, pending counts and inspector all move to that moment. Shift-sweep the Timeline to limit the map to a selected interval.
Layouts
Choose a layout from the gear menu in the panel header. Every layout shows the same nodes and links; only the arrangement changes.
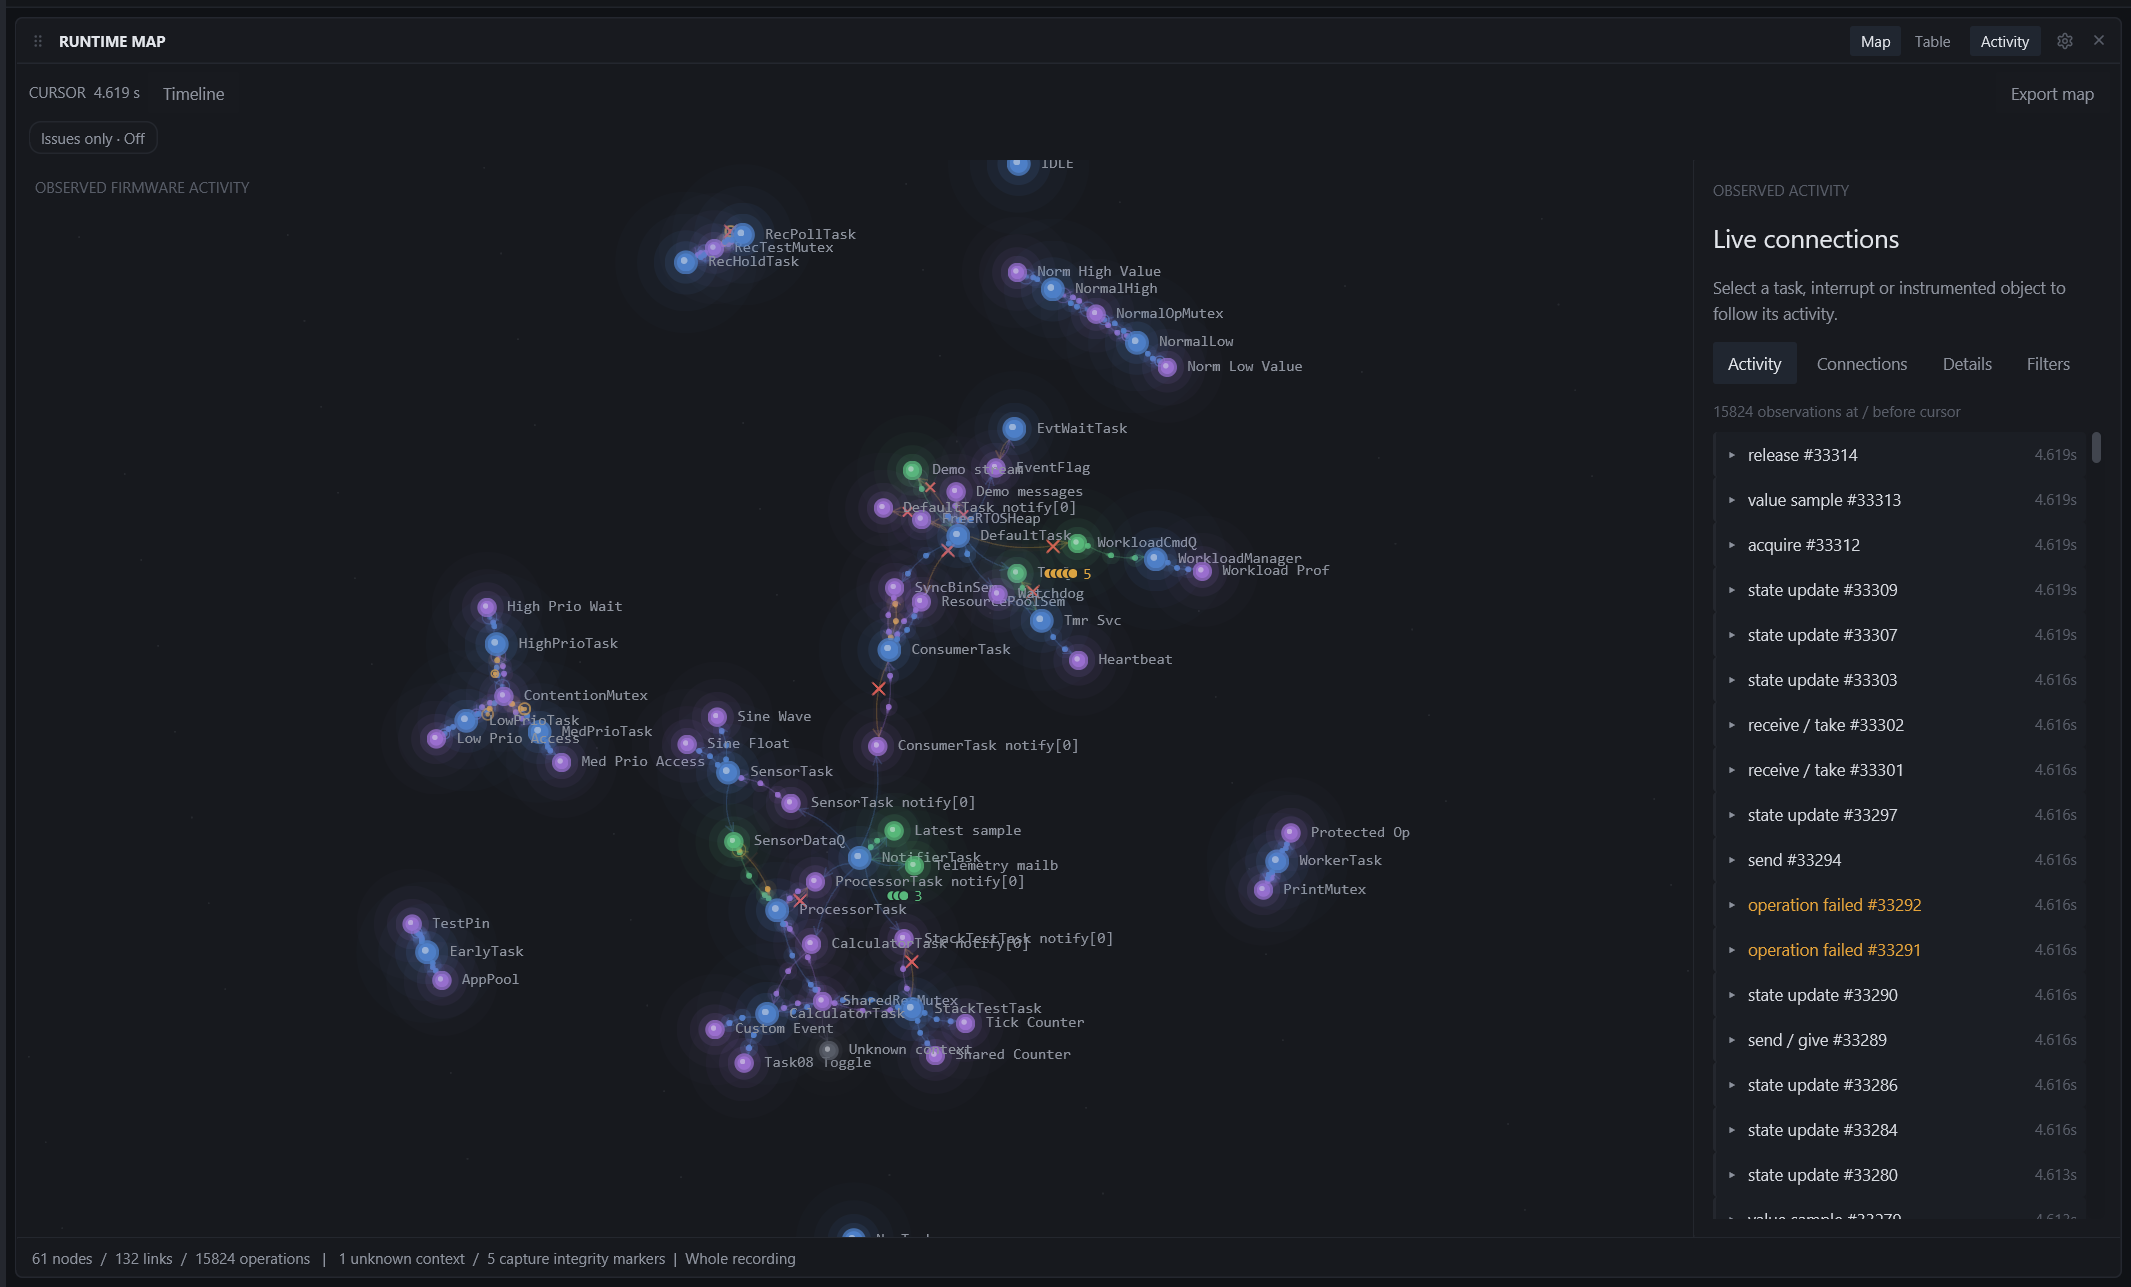
| LAYOUT | WHAT IT DOES |
|---|---|
| Constellation | A force layout: objects that talk to each other cluster together, so subsystems separate on their own. |
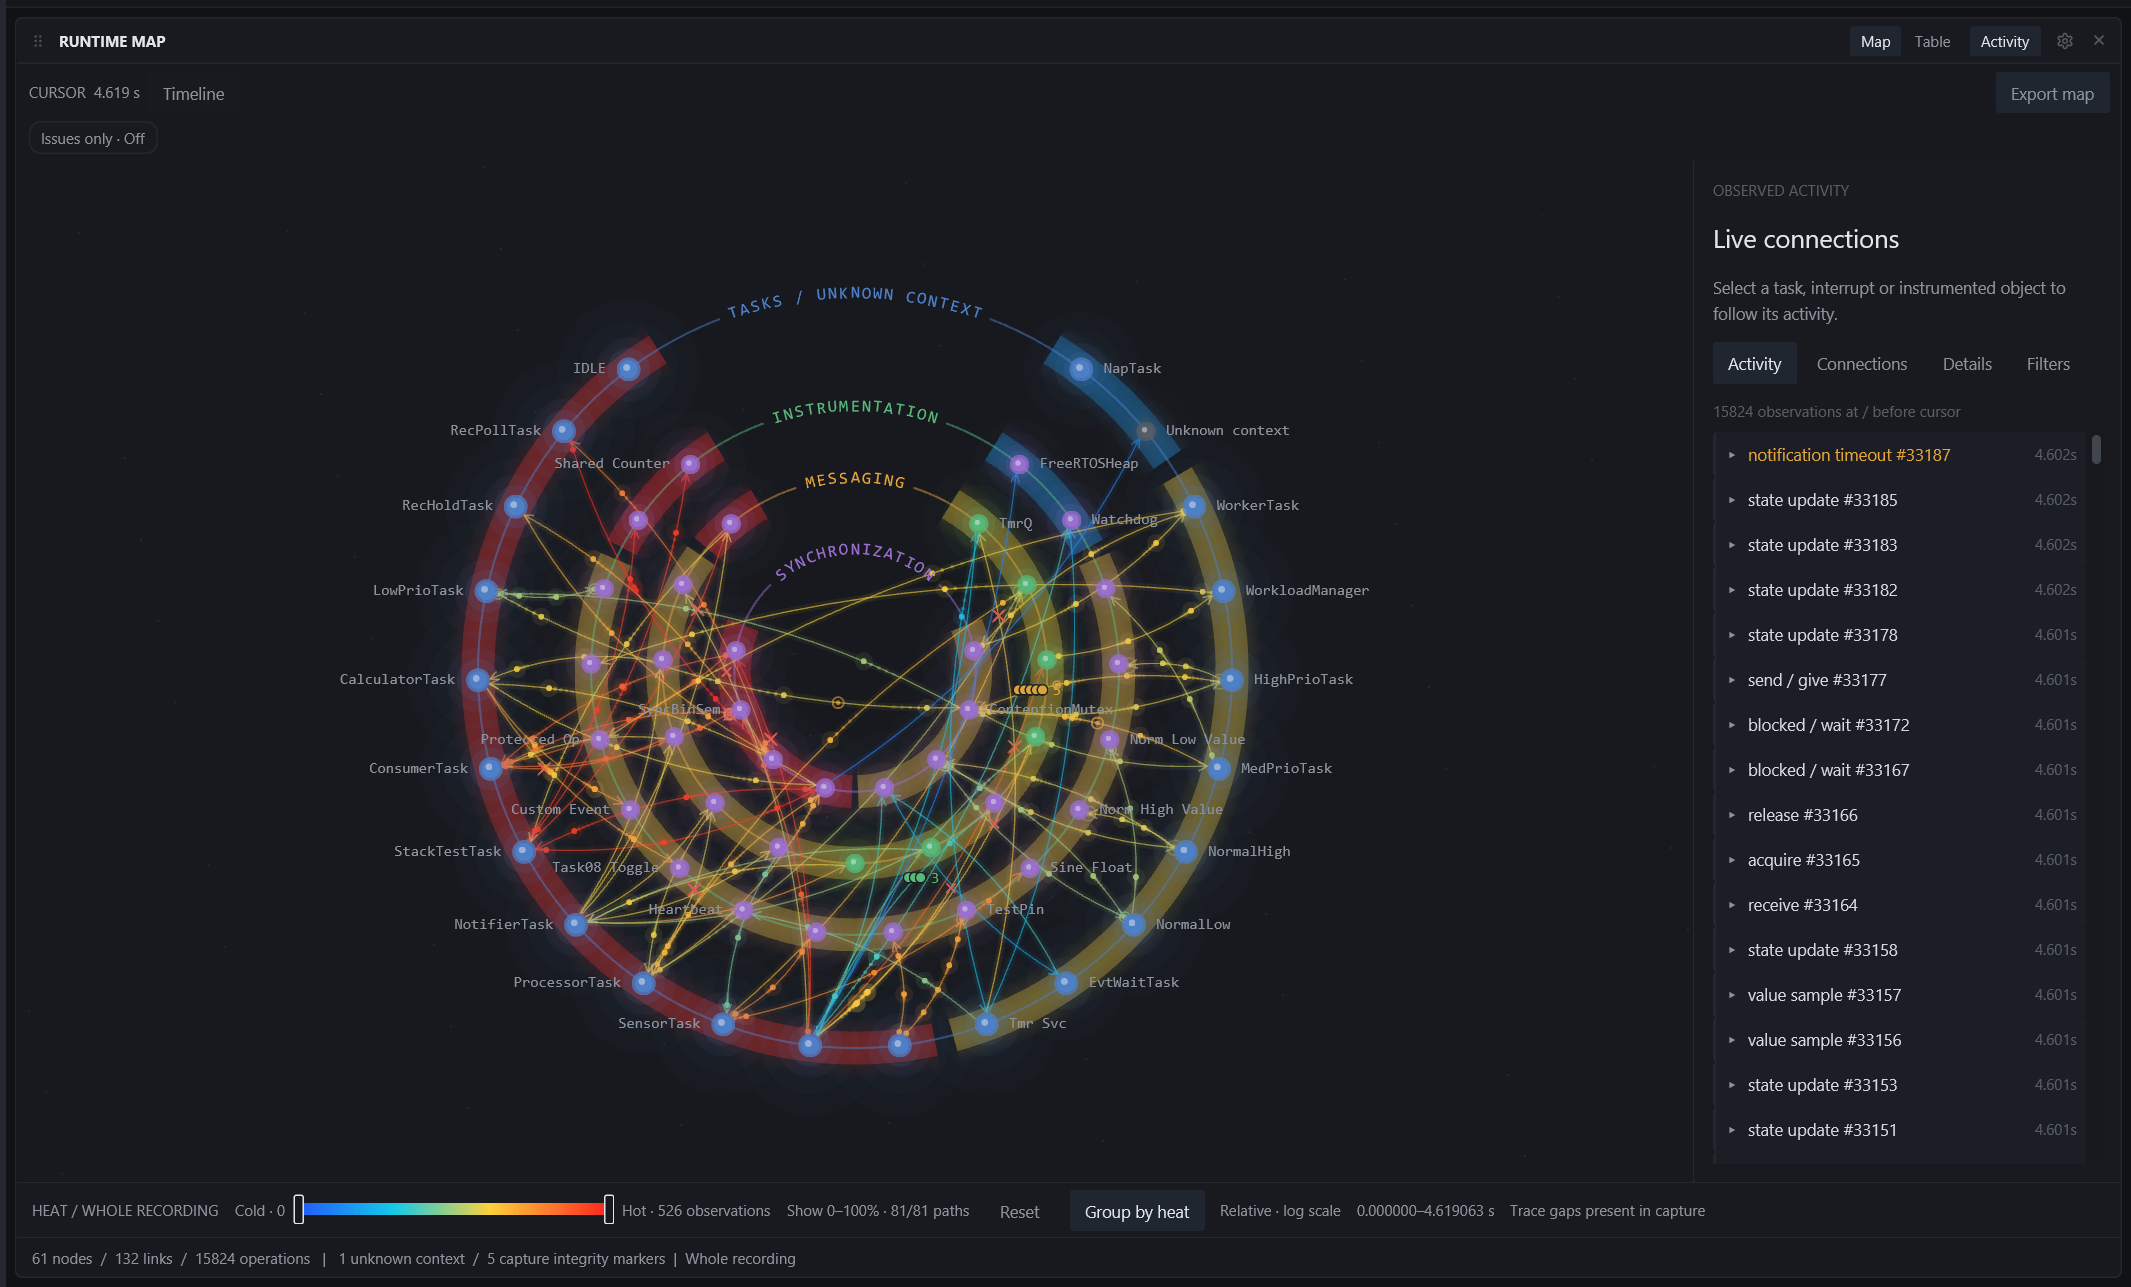
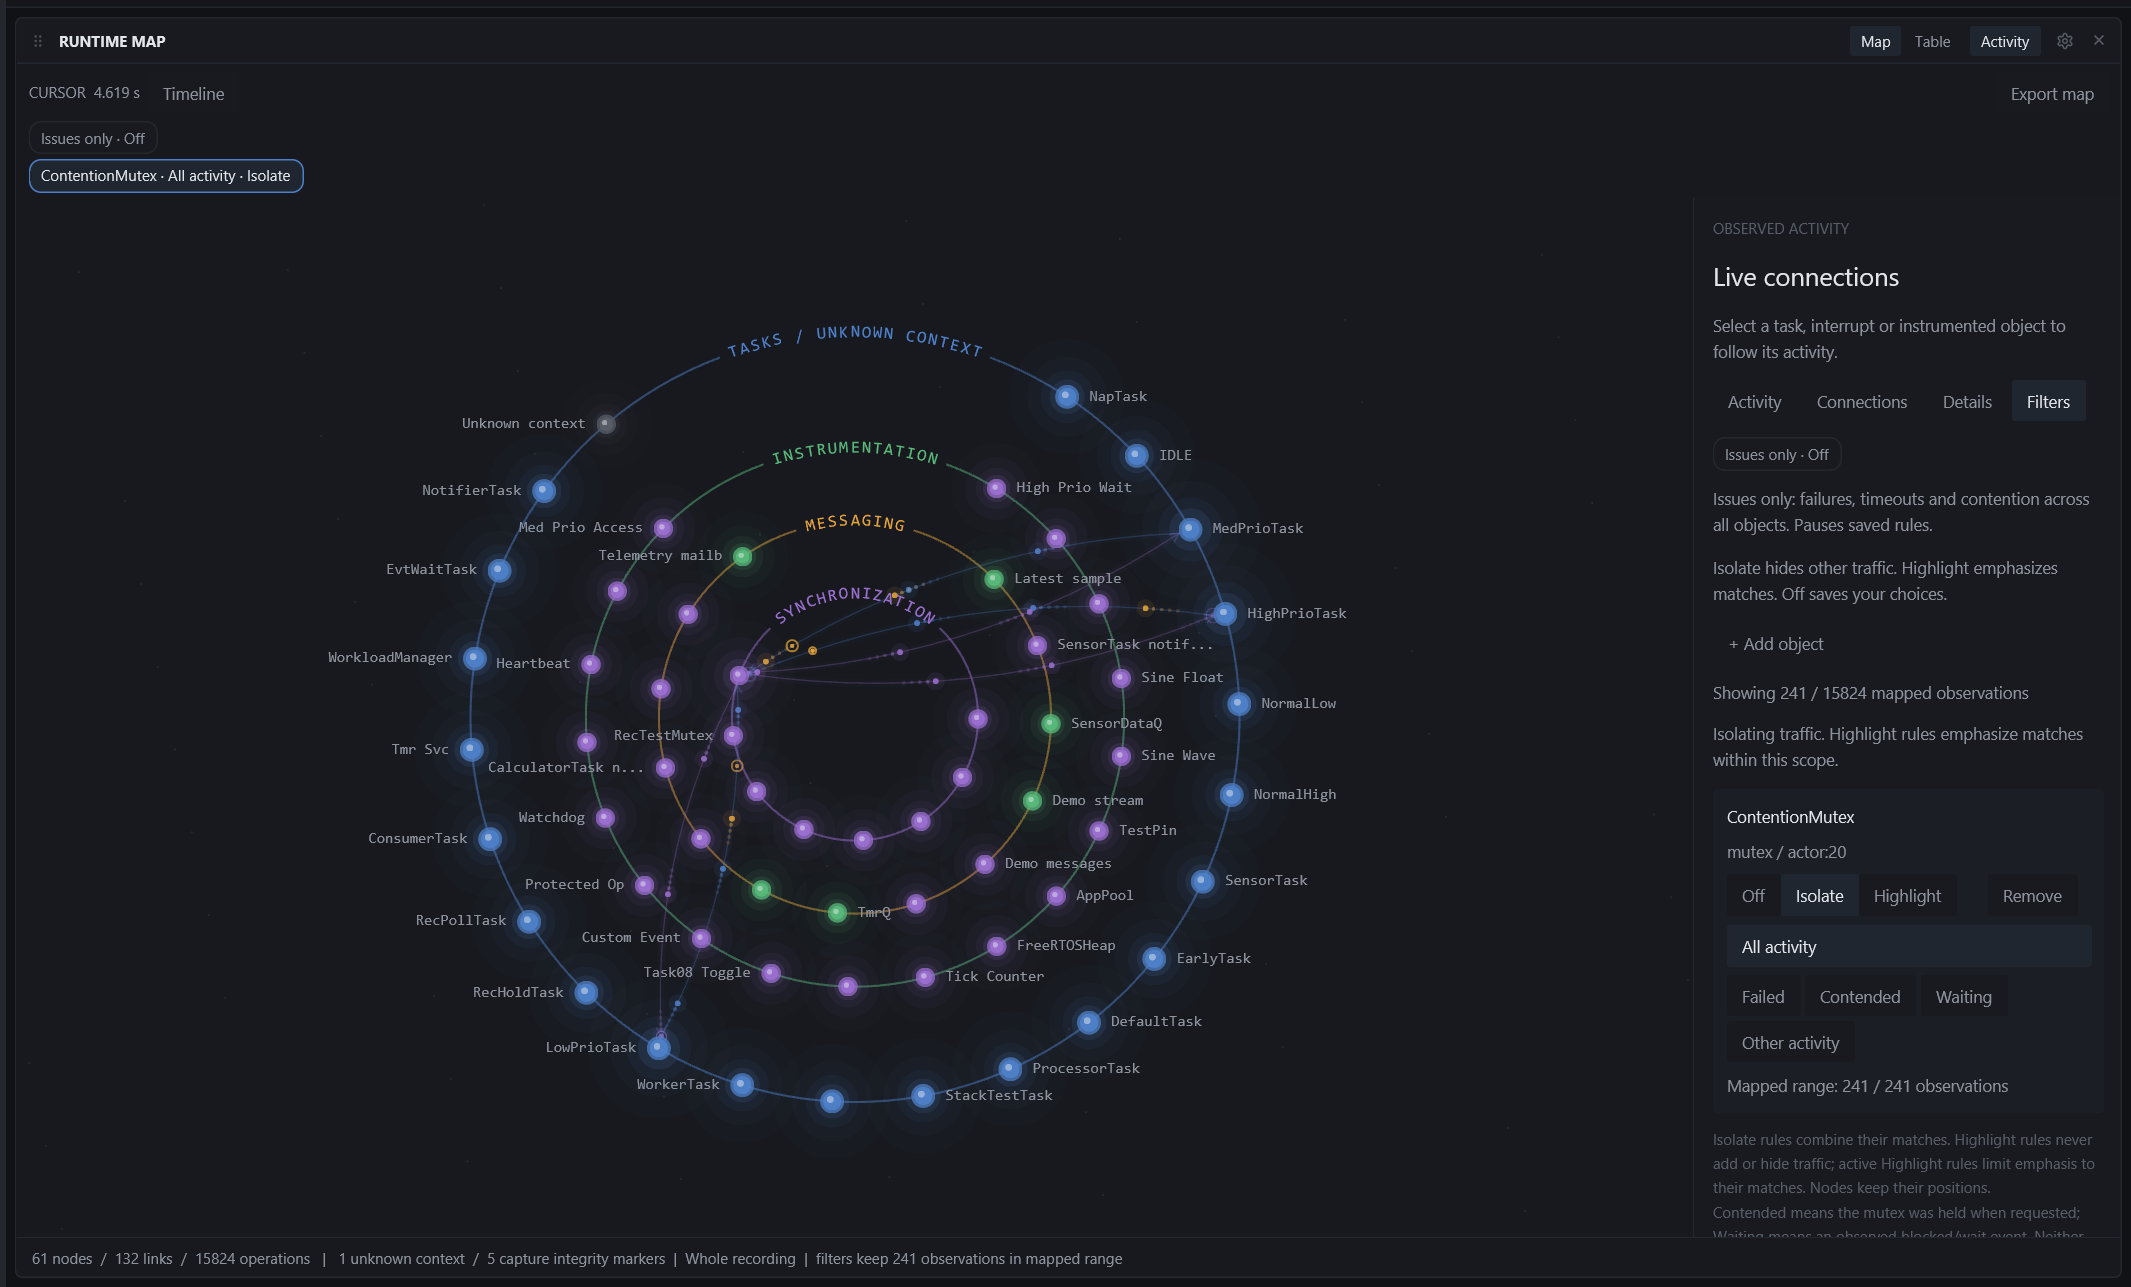
| Organized | Concentric rings by role: tasks outside, then instrumentation, messaging and synchronization toward the centre. Ring labels name each band. |
| Centered | Puts the selected object at the centre and places everything else by connection distance from it. |
| Hierarchy | The same distance levels as Centered, drawn as rows from the selected object downward; disconnected objects sit in a band at the bottom. |
| Linear | Left-to-right columns from the roots you pick, with in/out counts on each card. Best for following one queue or mutex. |
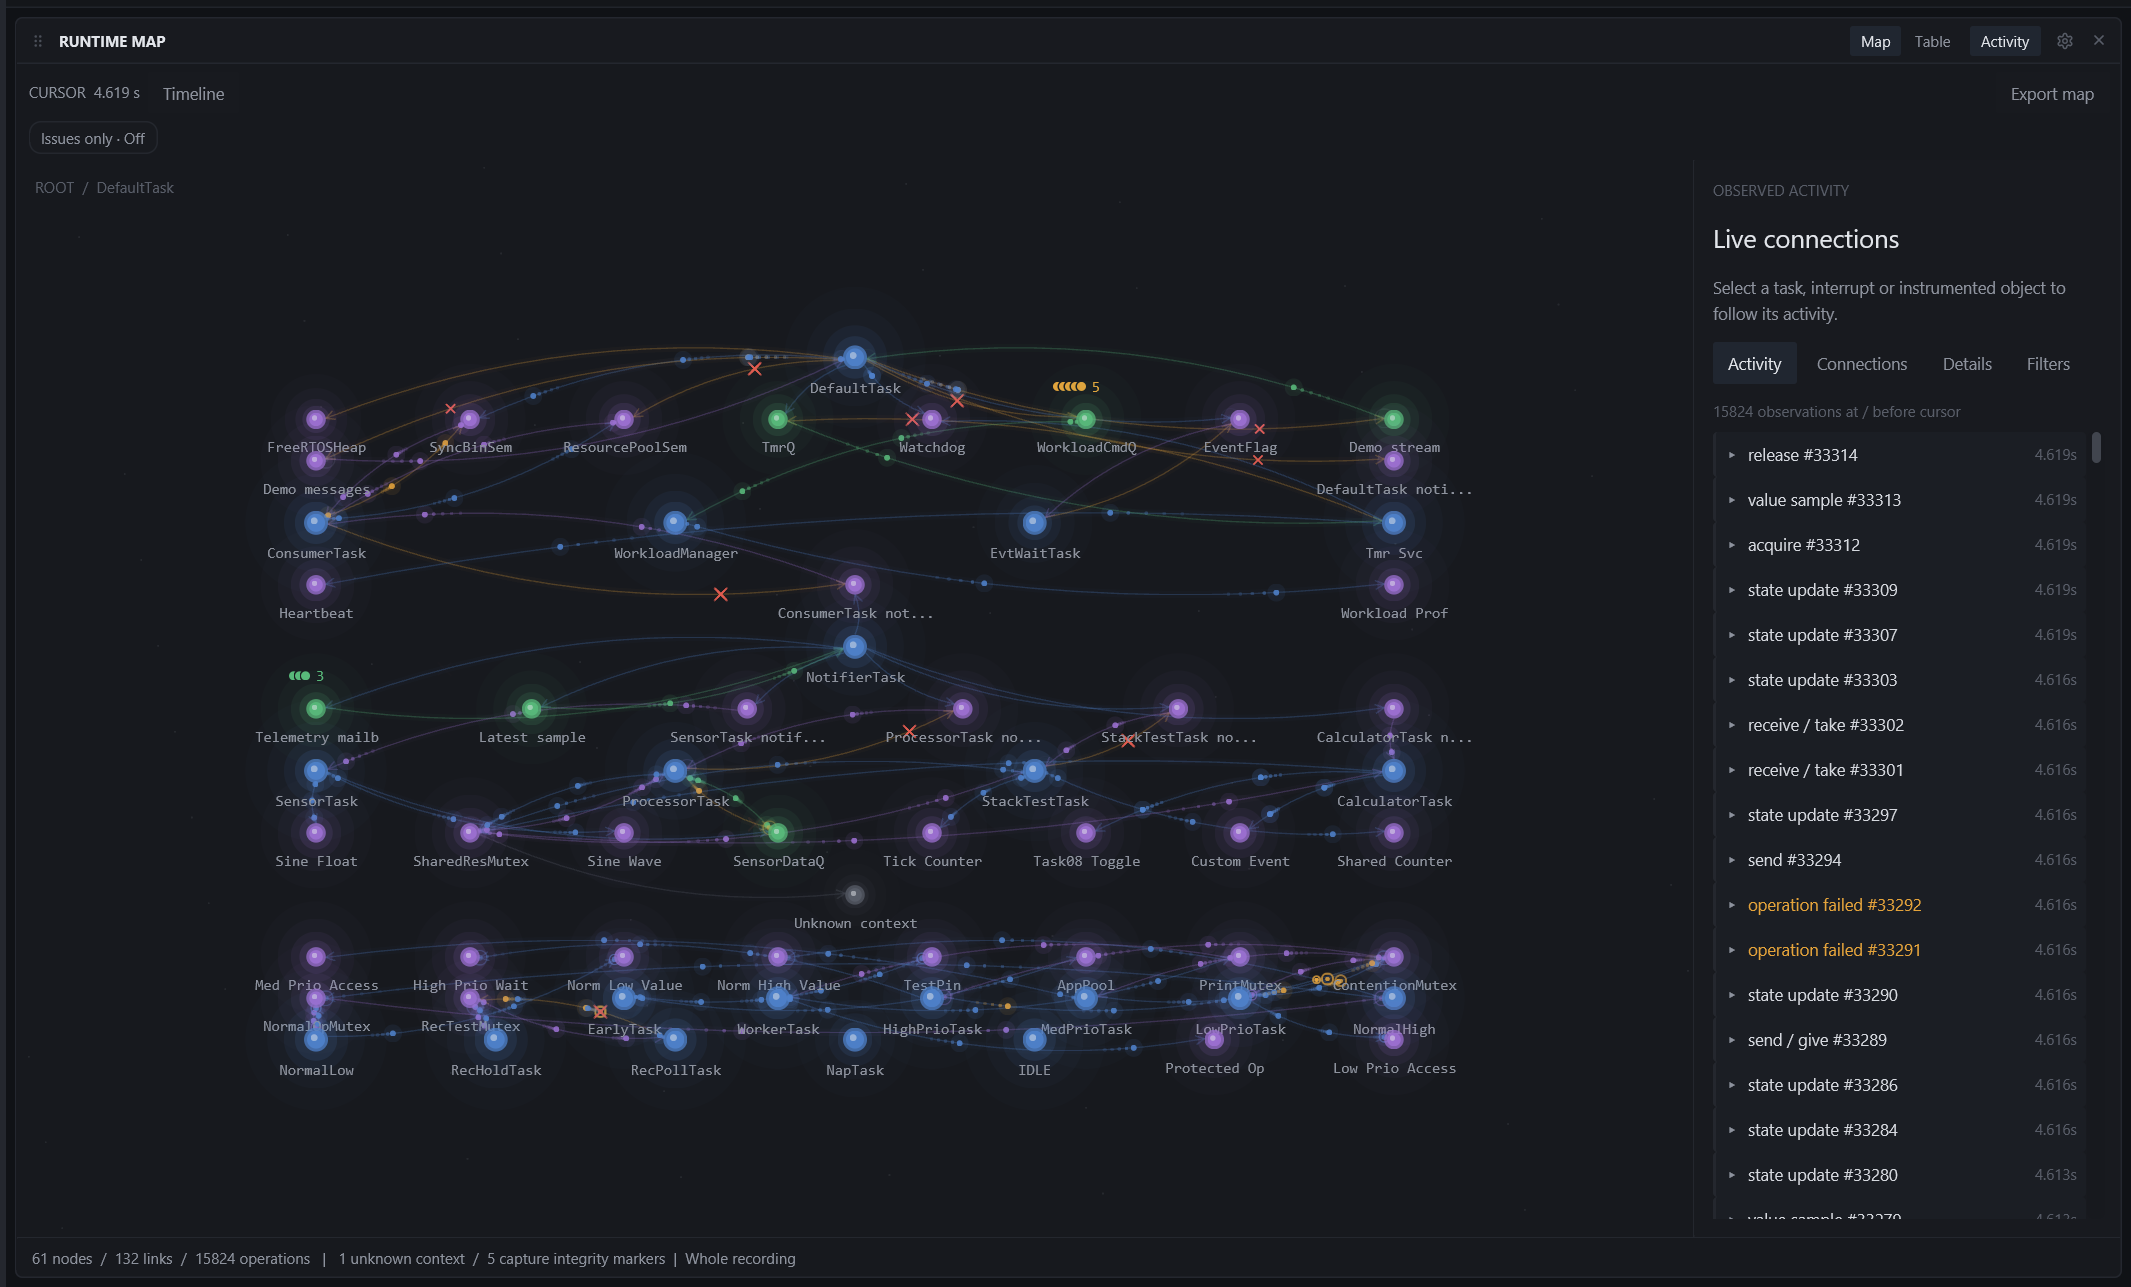
Levels in Centered and Hierarchy are connection distance, not ownership or call order; arrows keep the recorded direction.
Linear: follow a few objects
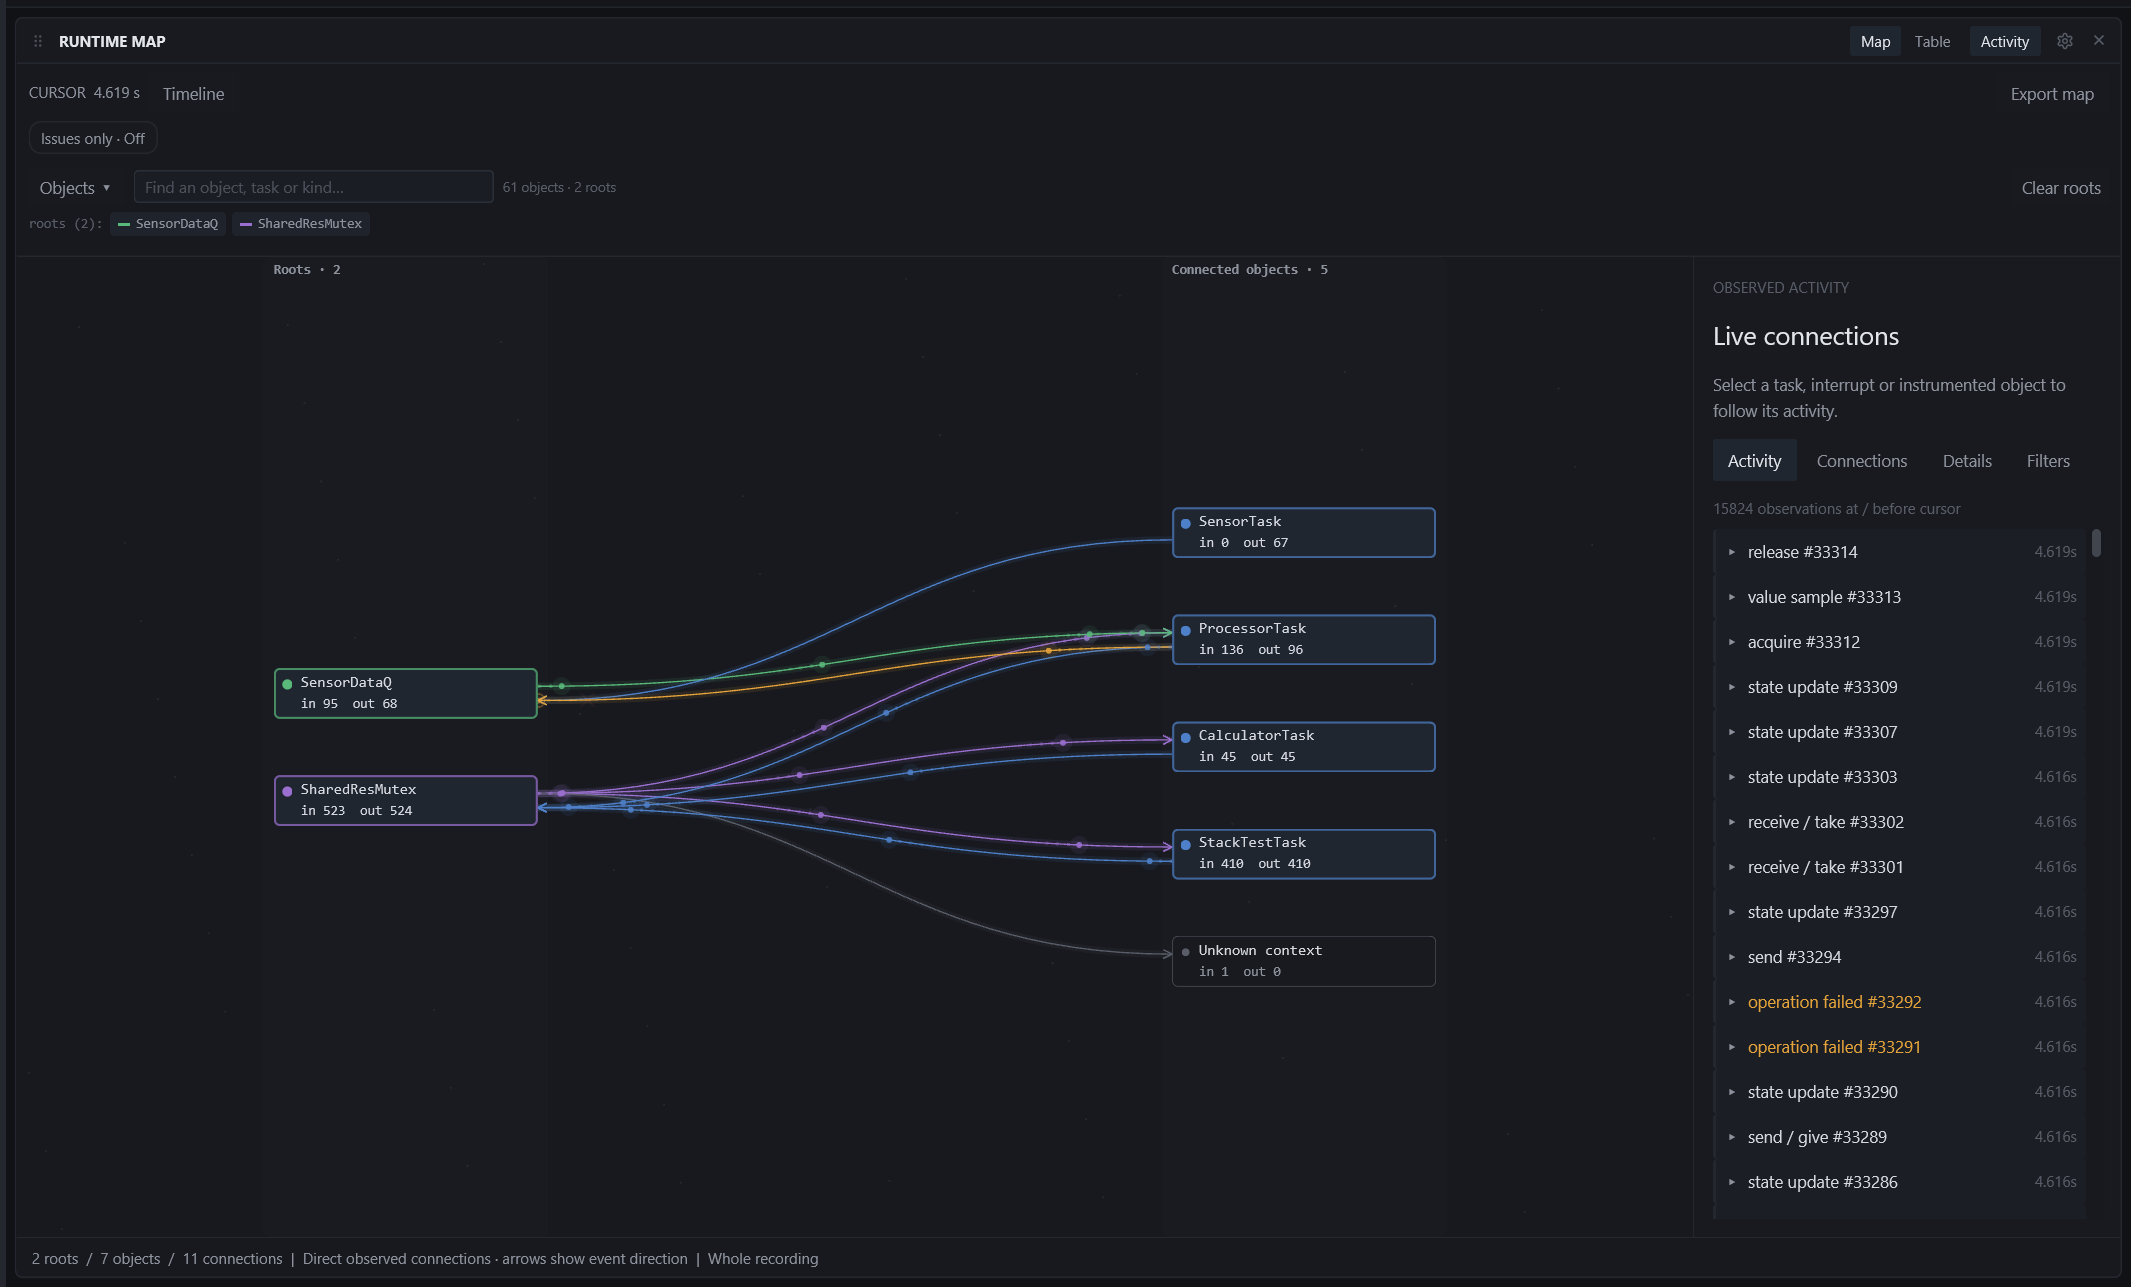
Click object names in the Objects list (or type in the search box) to add them as roots. The roots stay in the left column; every object with a recorded connection to them lines up on the right, with in and out counts for the mapped range. Clear roots starts over.
Heat
Turn on Traffic heat in the gear menu to colour every link by how much traffic it carried. Colour is relative and logarithmic: blue is cold, red is the busiest path in the range.
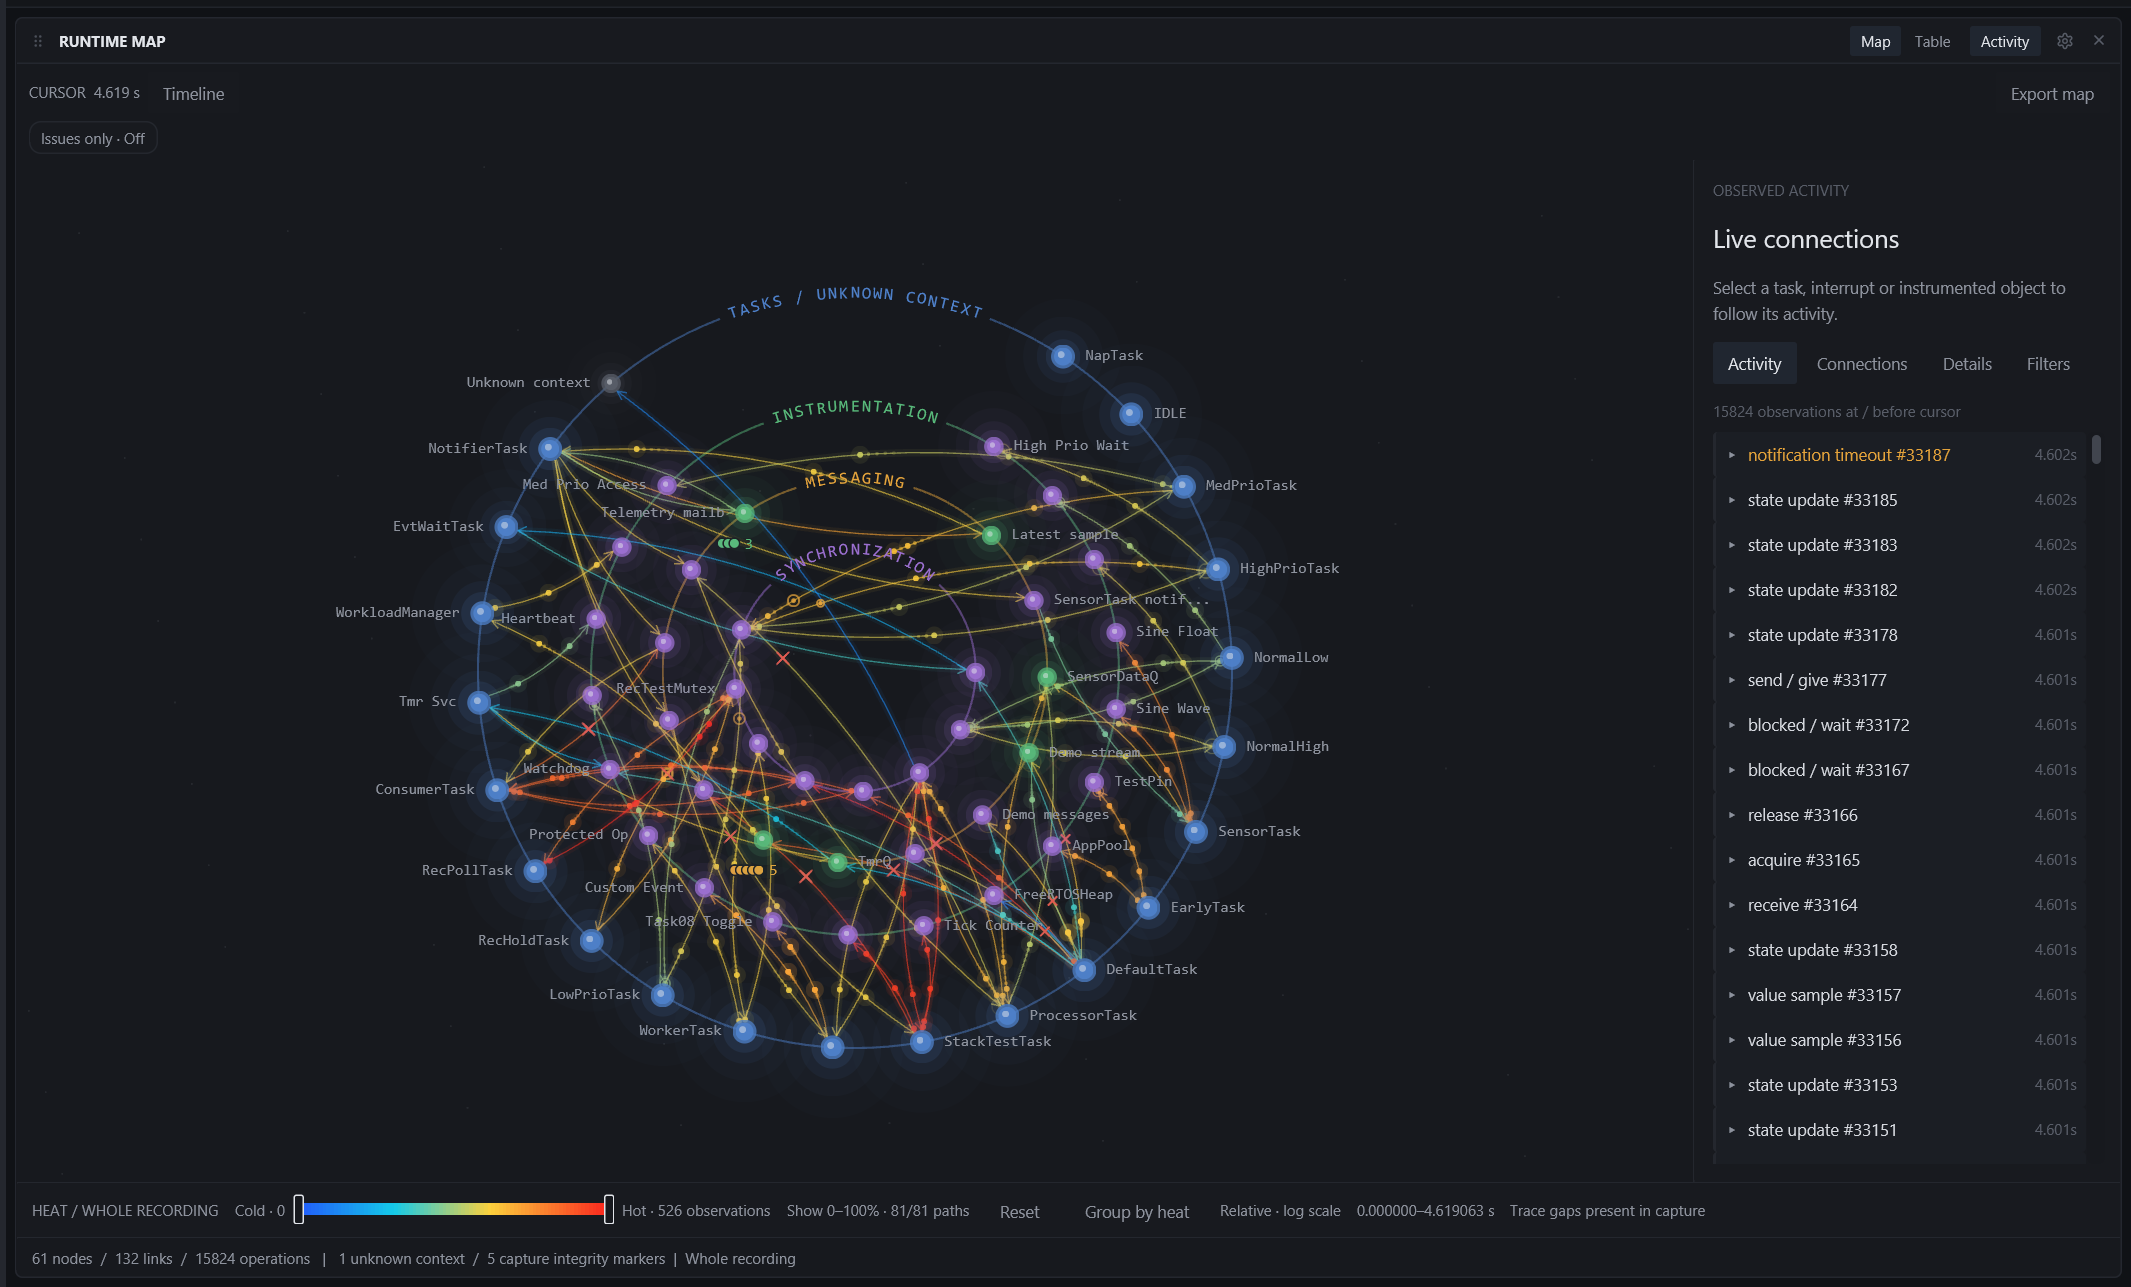
Group by heat rearranges the rings so the busiest objects gather on one side of each band, with a coloured arc behind them. It is the fastest way to see where the work actually goes.
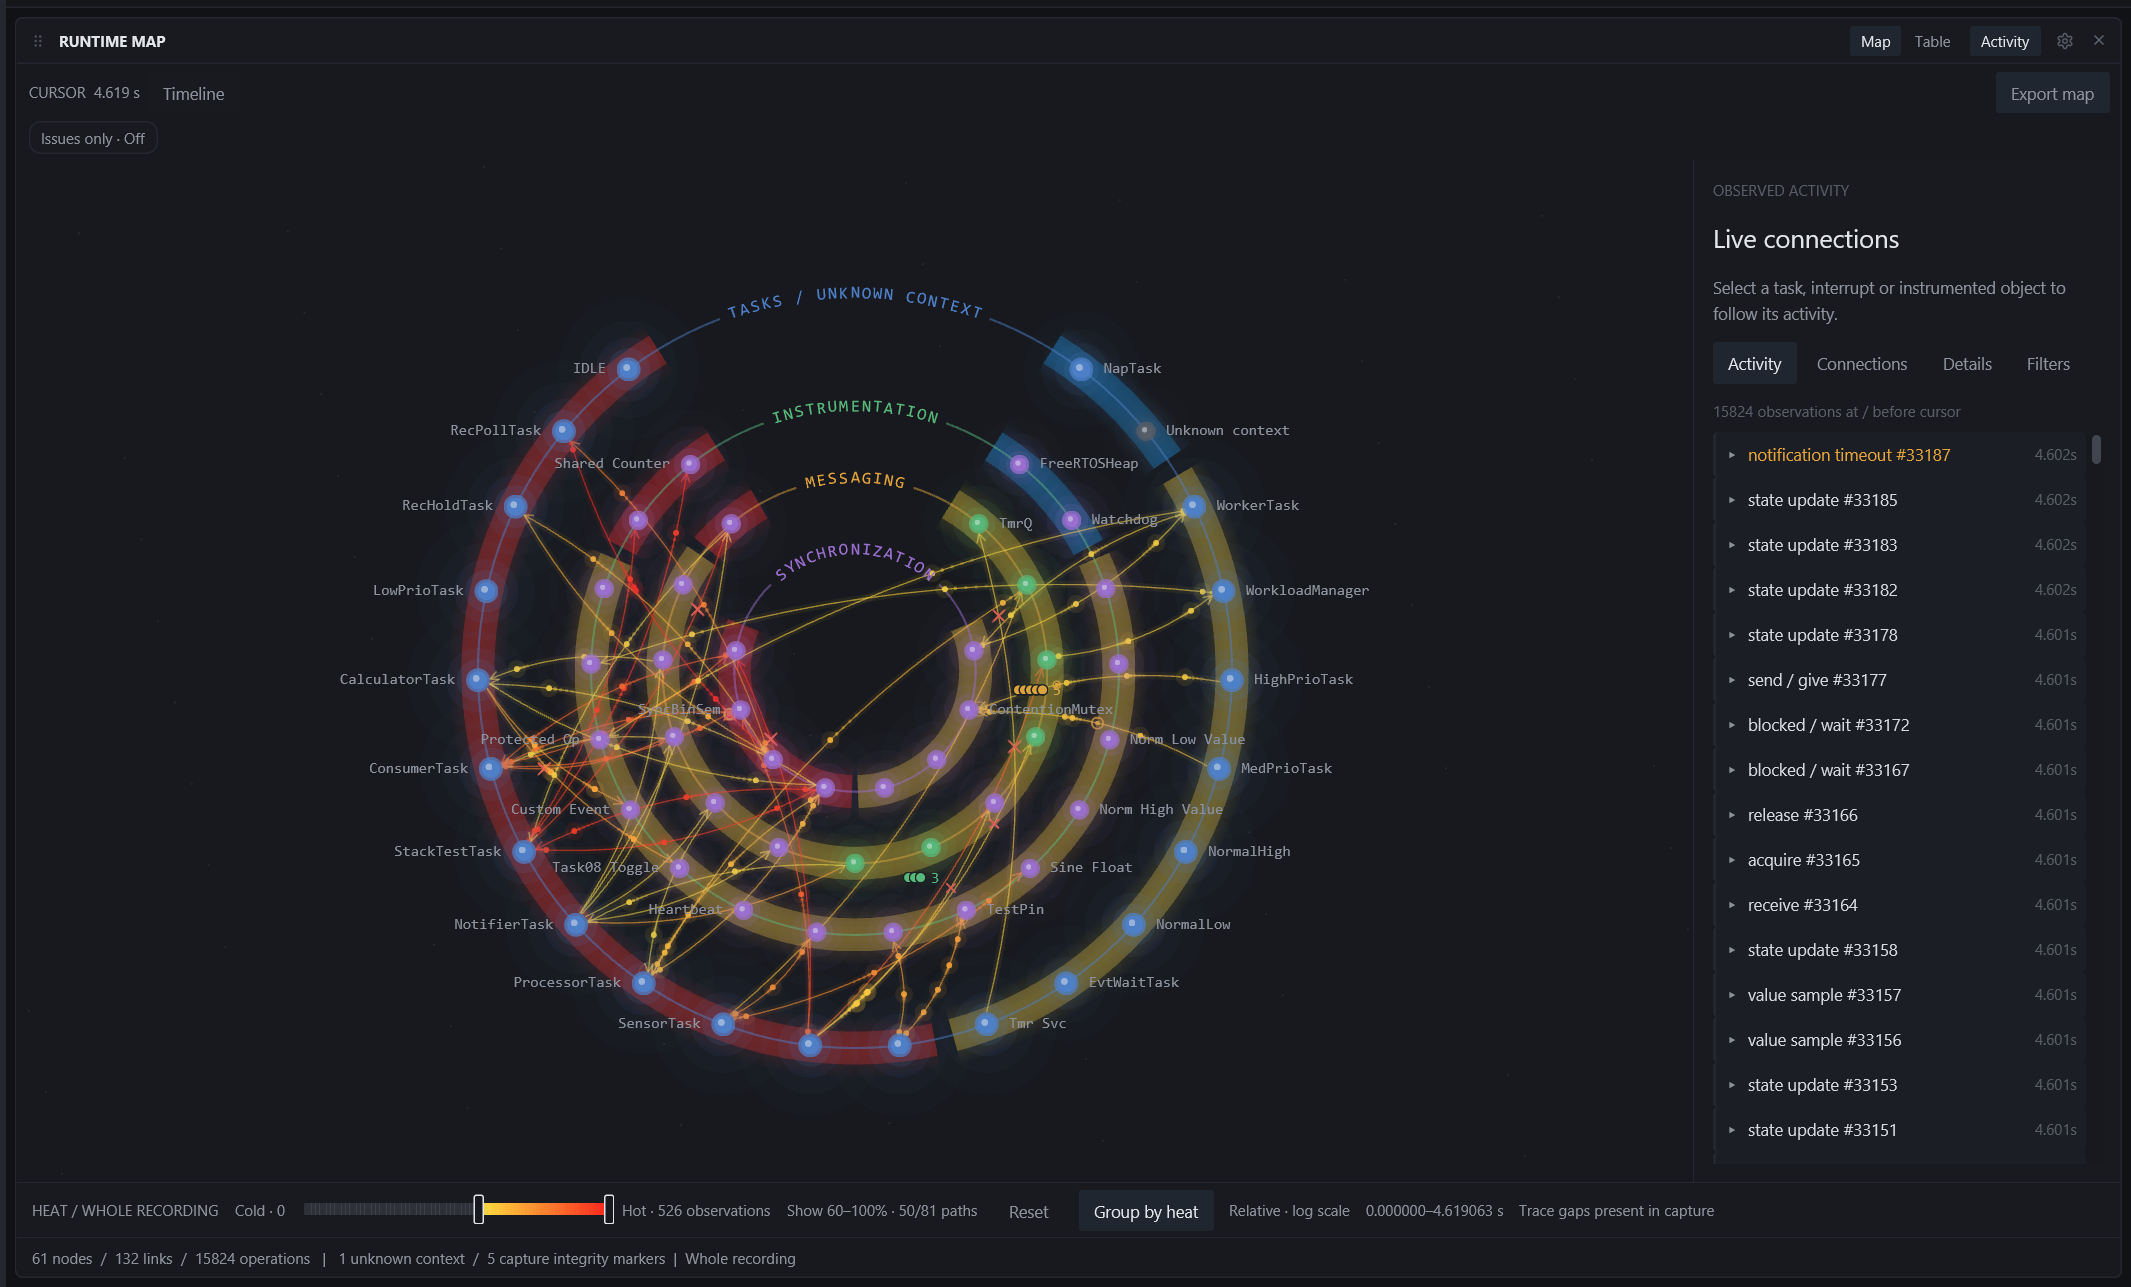
The heat bar along the bottom of the map controls what is shown:
- The range slider keeps only paths inside a heat band. Drag the left handle up to hide the quiet traffic and keep the hot paths.
- Reset returns to the full range.
- Group by heat is the same toggle as in the gear menu.
- The caption says what the heat covers (whole recording or selected time), the peak count, the time range, and whether trace gaps fall inside it.
Shift-sweep a range on the Timeline and the heat covers only that interval. Comparing a quiet window with a busy one is the quickest way to see which paths a burst actually used.
Heat totals do not depend on the playback cursor. A cold path means no observations in the interval, not proof that the firmware did no work; partial history and trace gaps are labelled.
Selecting and inspecting
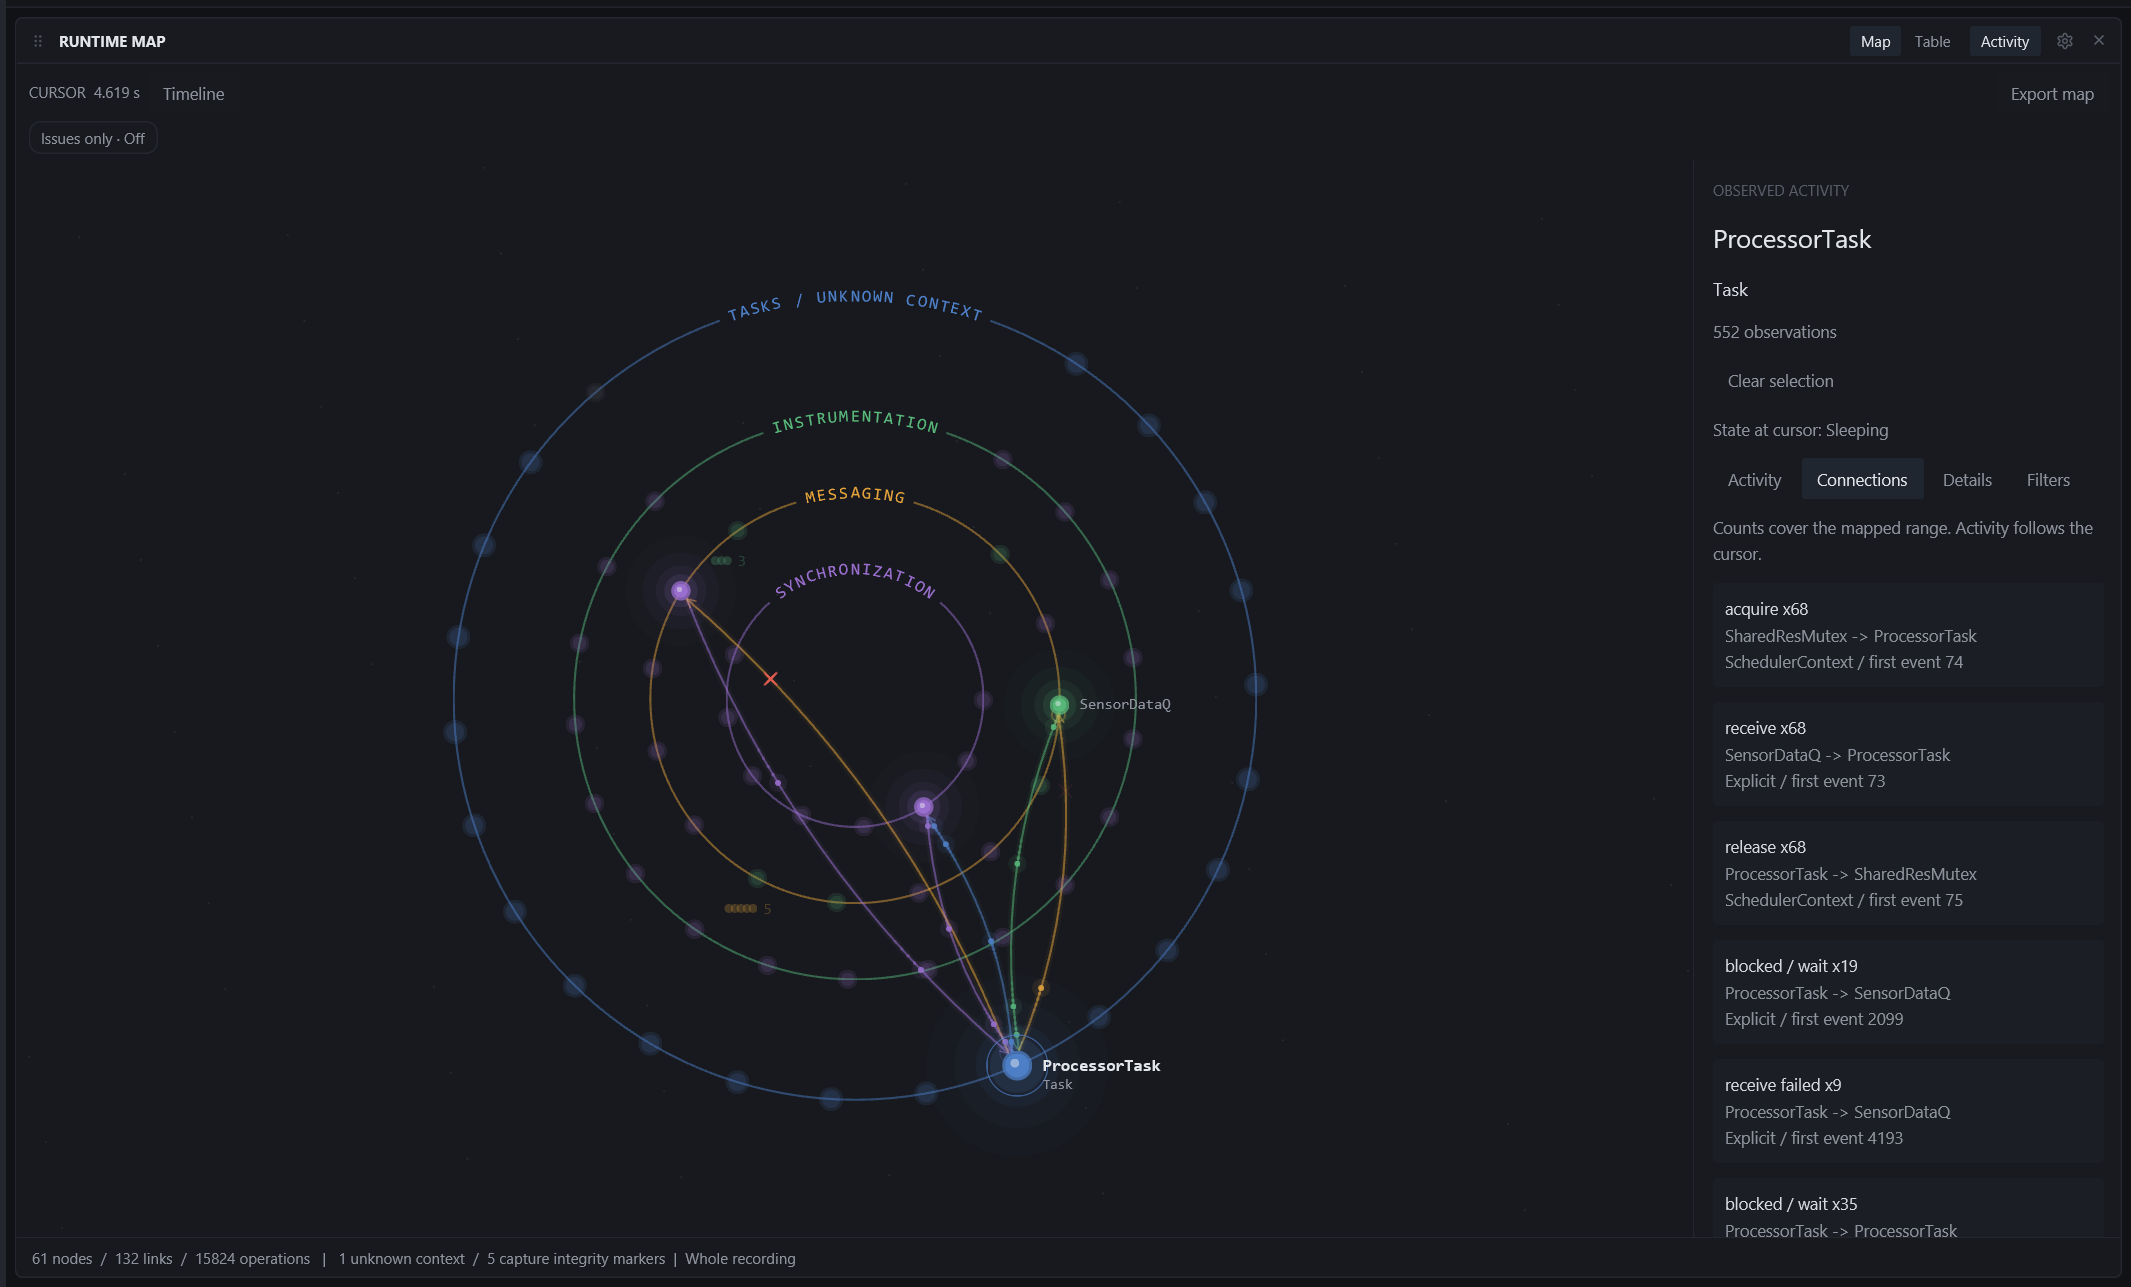
Click a node to select it. The inspector on the right switches to that object: its kind, observation count and state at the cursor.
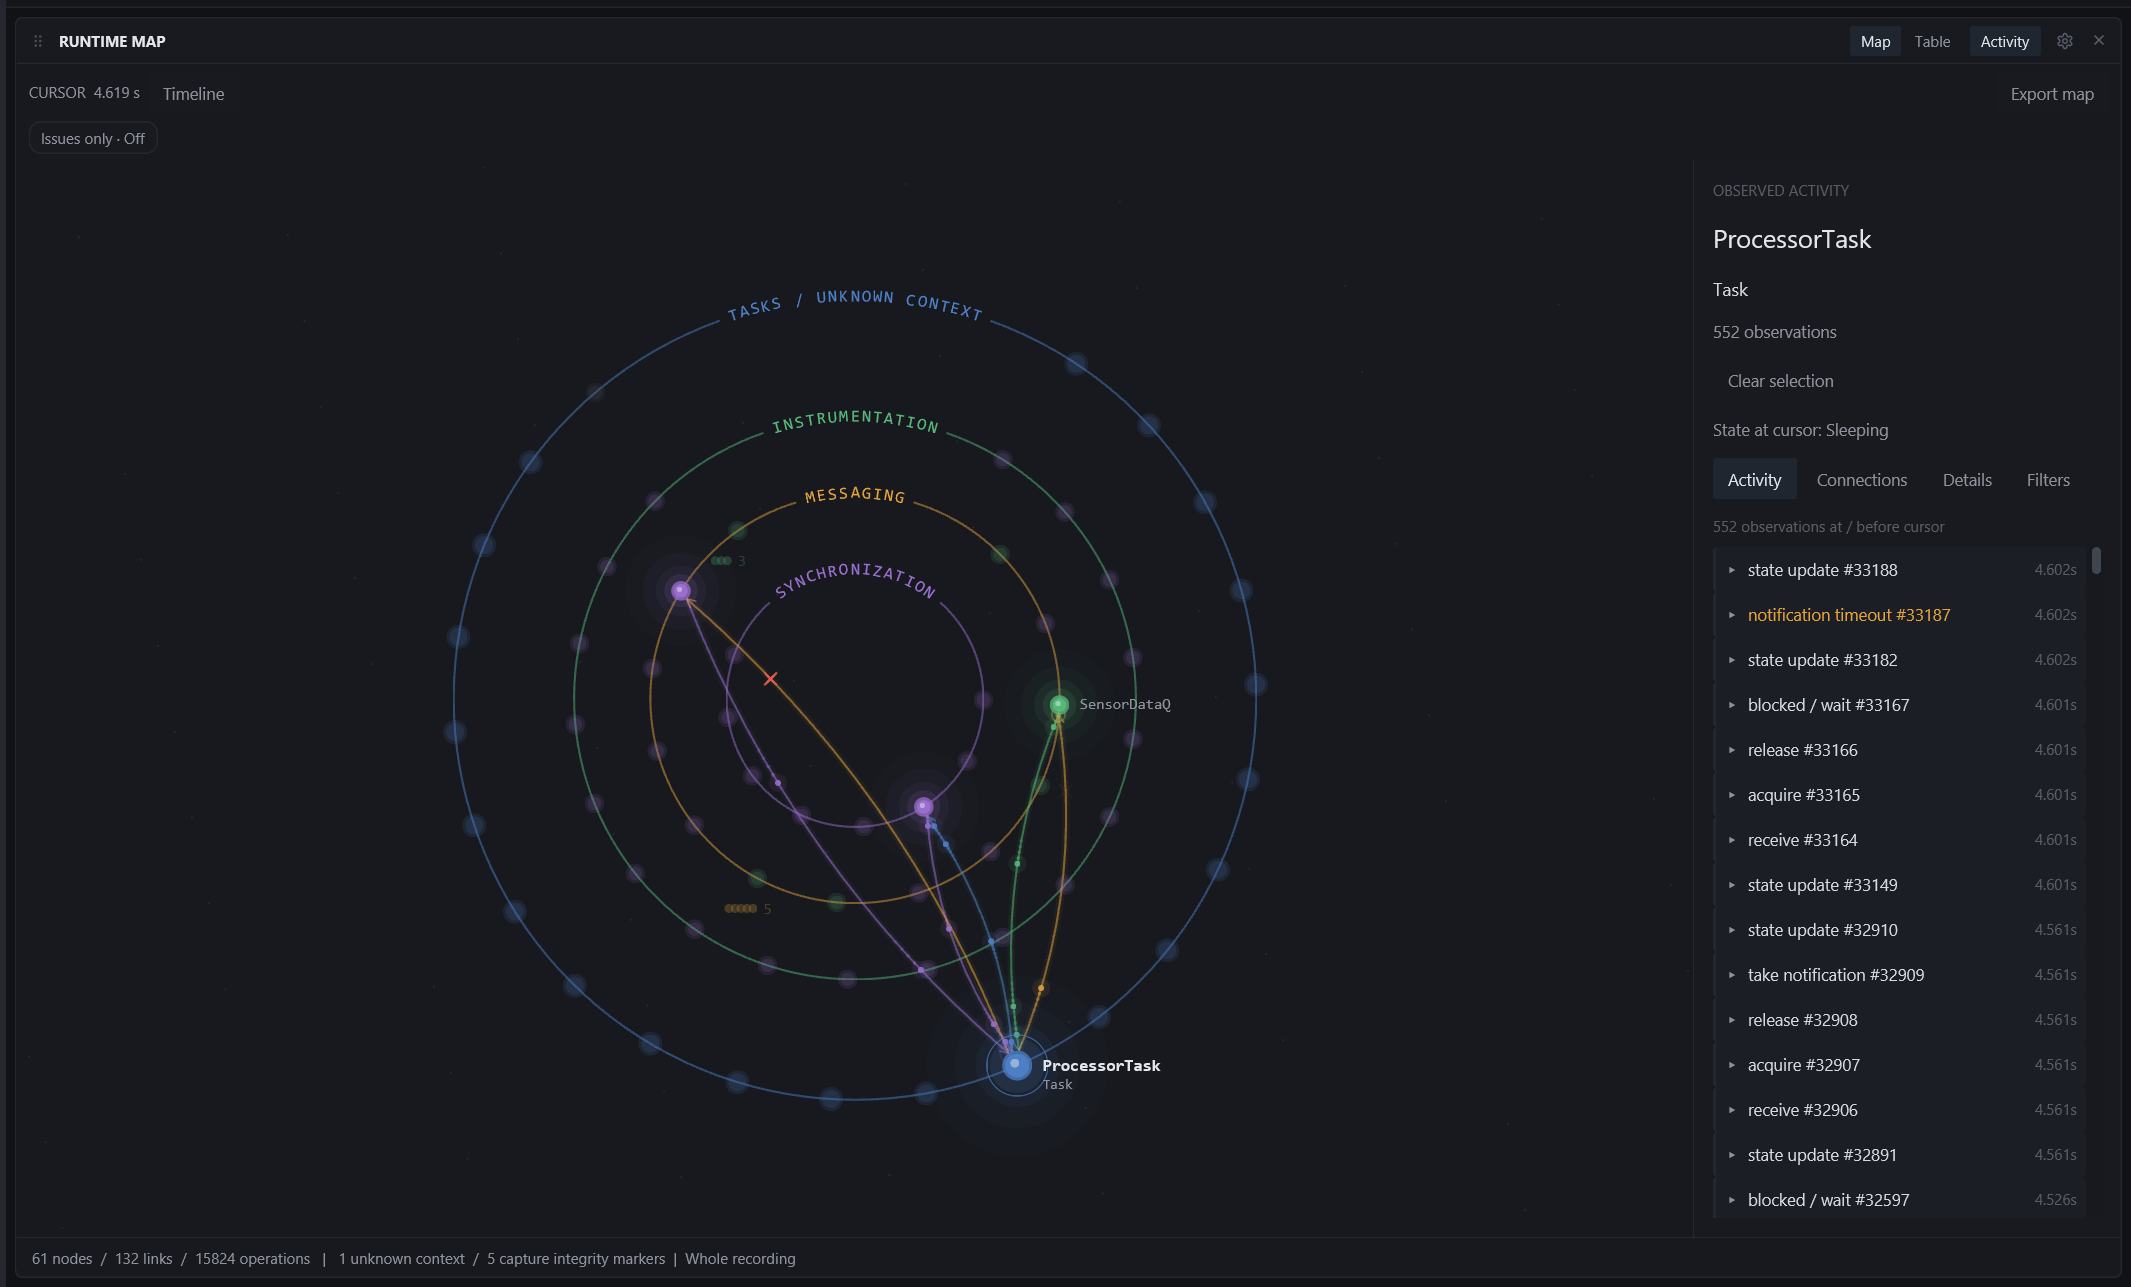
The inspector has four tabs:
| TAB | WHAT IT SHOWS |
|---|---|
| Activity | Every observation at or before the cursor, newest first. Expand one to read its time, endpoints, value and outcome; Timeline jumps there. |
| Connections | The selected object's links with counts for the mapped range, the attribution and the first event. |
| Details | A legend for the map's cues: pending stacks, pulses, failure and contention marks, dimmed tasks. |
| Filters | Object rules and the Issues only preset (below). |
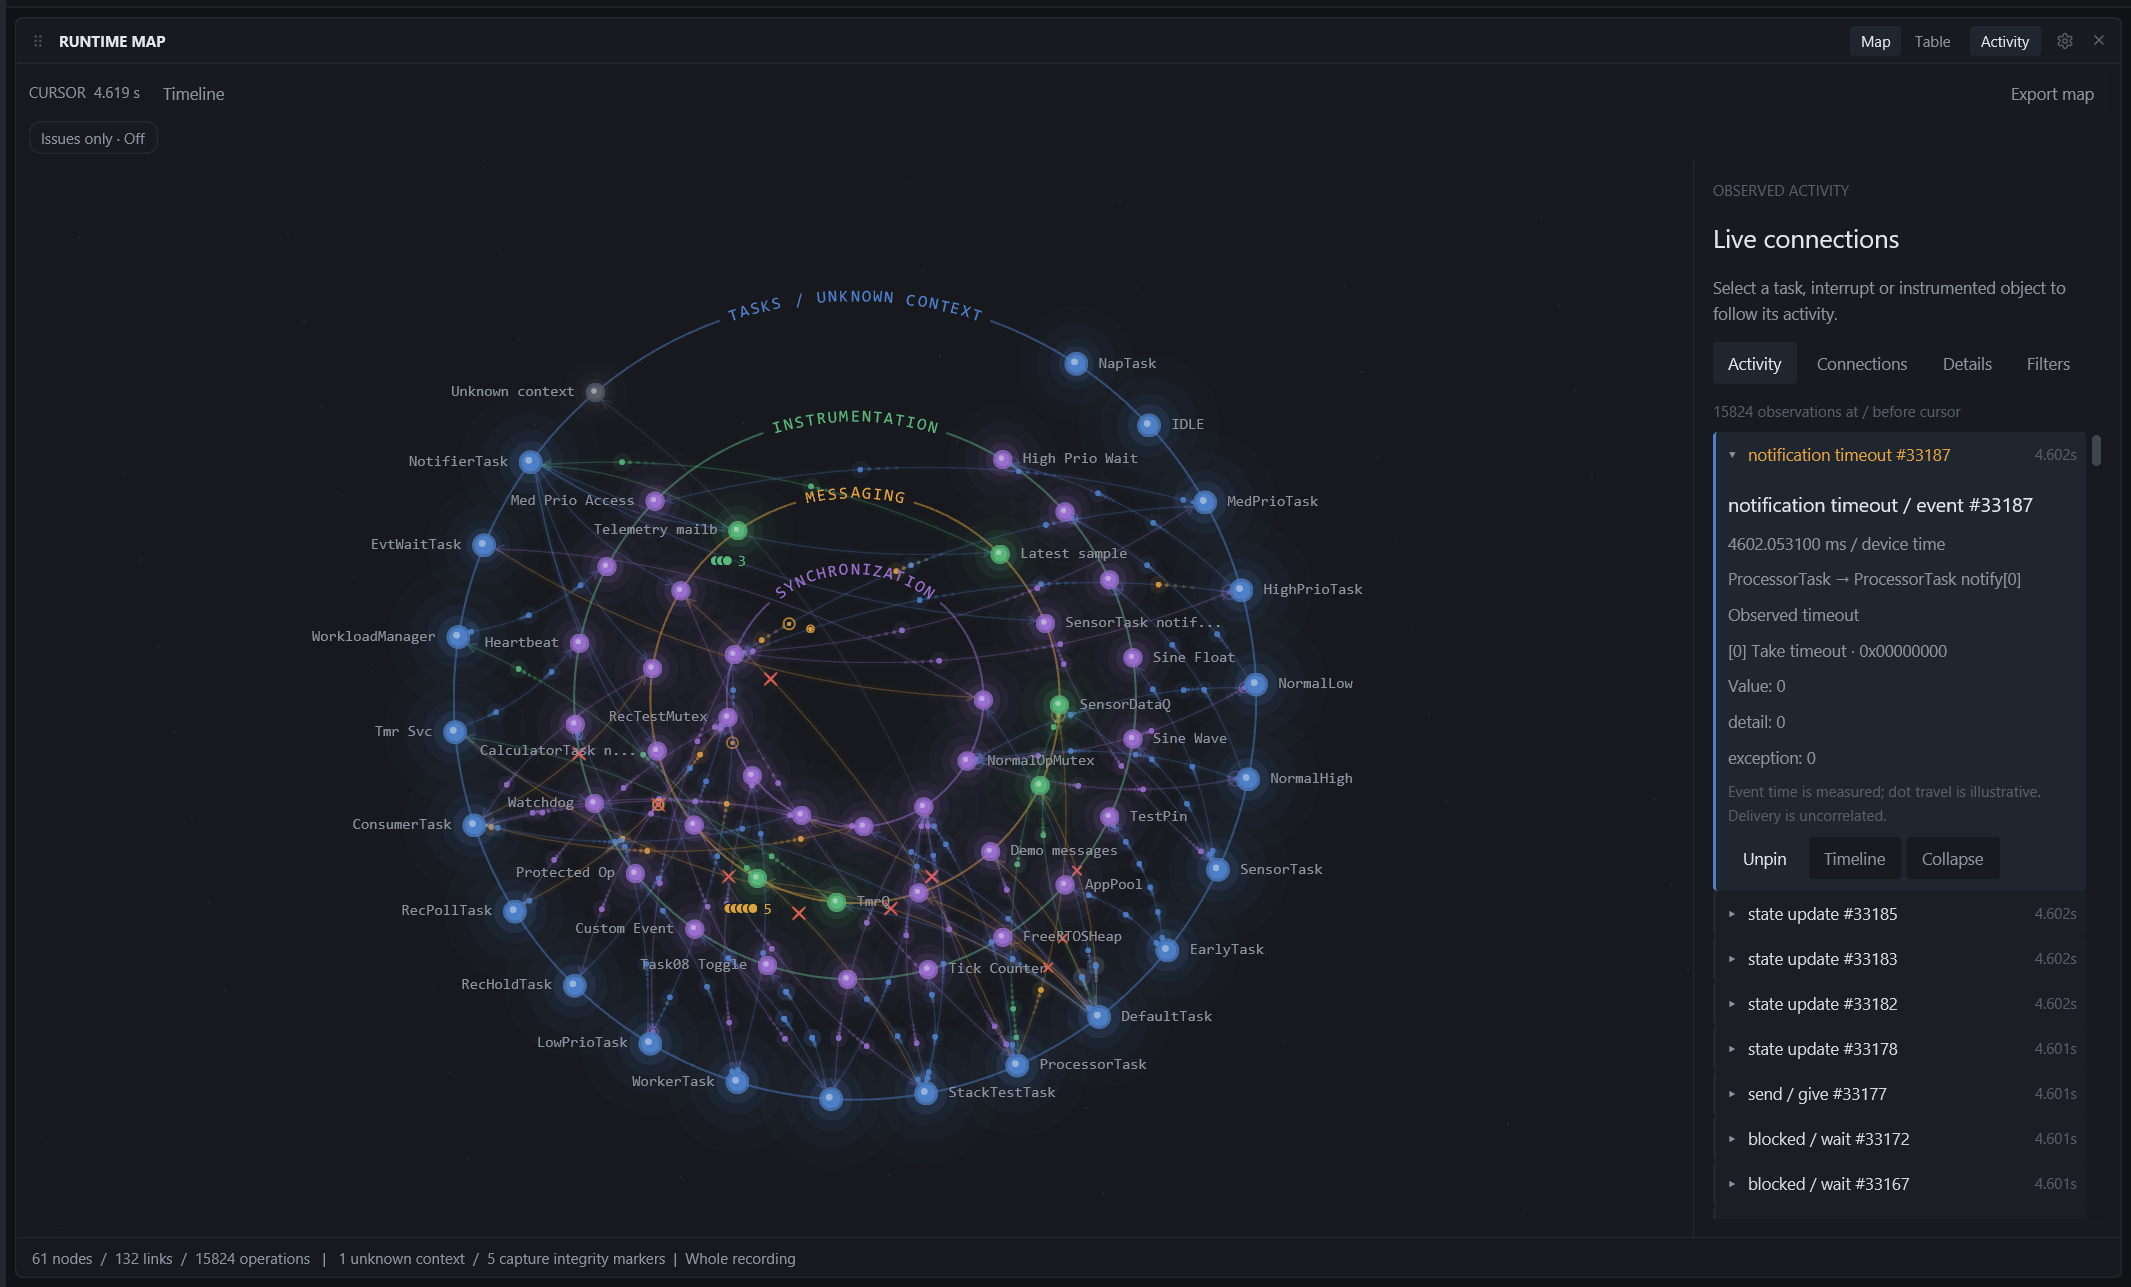
Expand an event in the Activity list to pin it on the map; the event is outlined where it happened.
Filters
Issues only (the chip at the top left) keeps failures, timeouts and contention across every object and hides the rest of the traffic. It pauses your saved object rules while it is on.
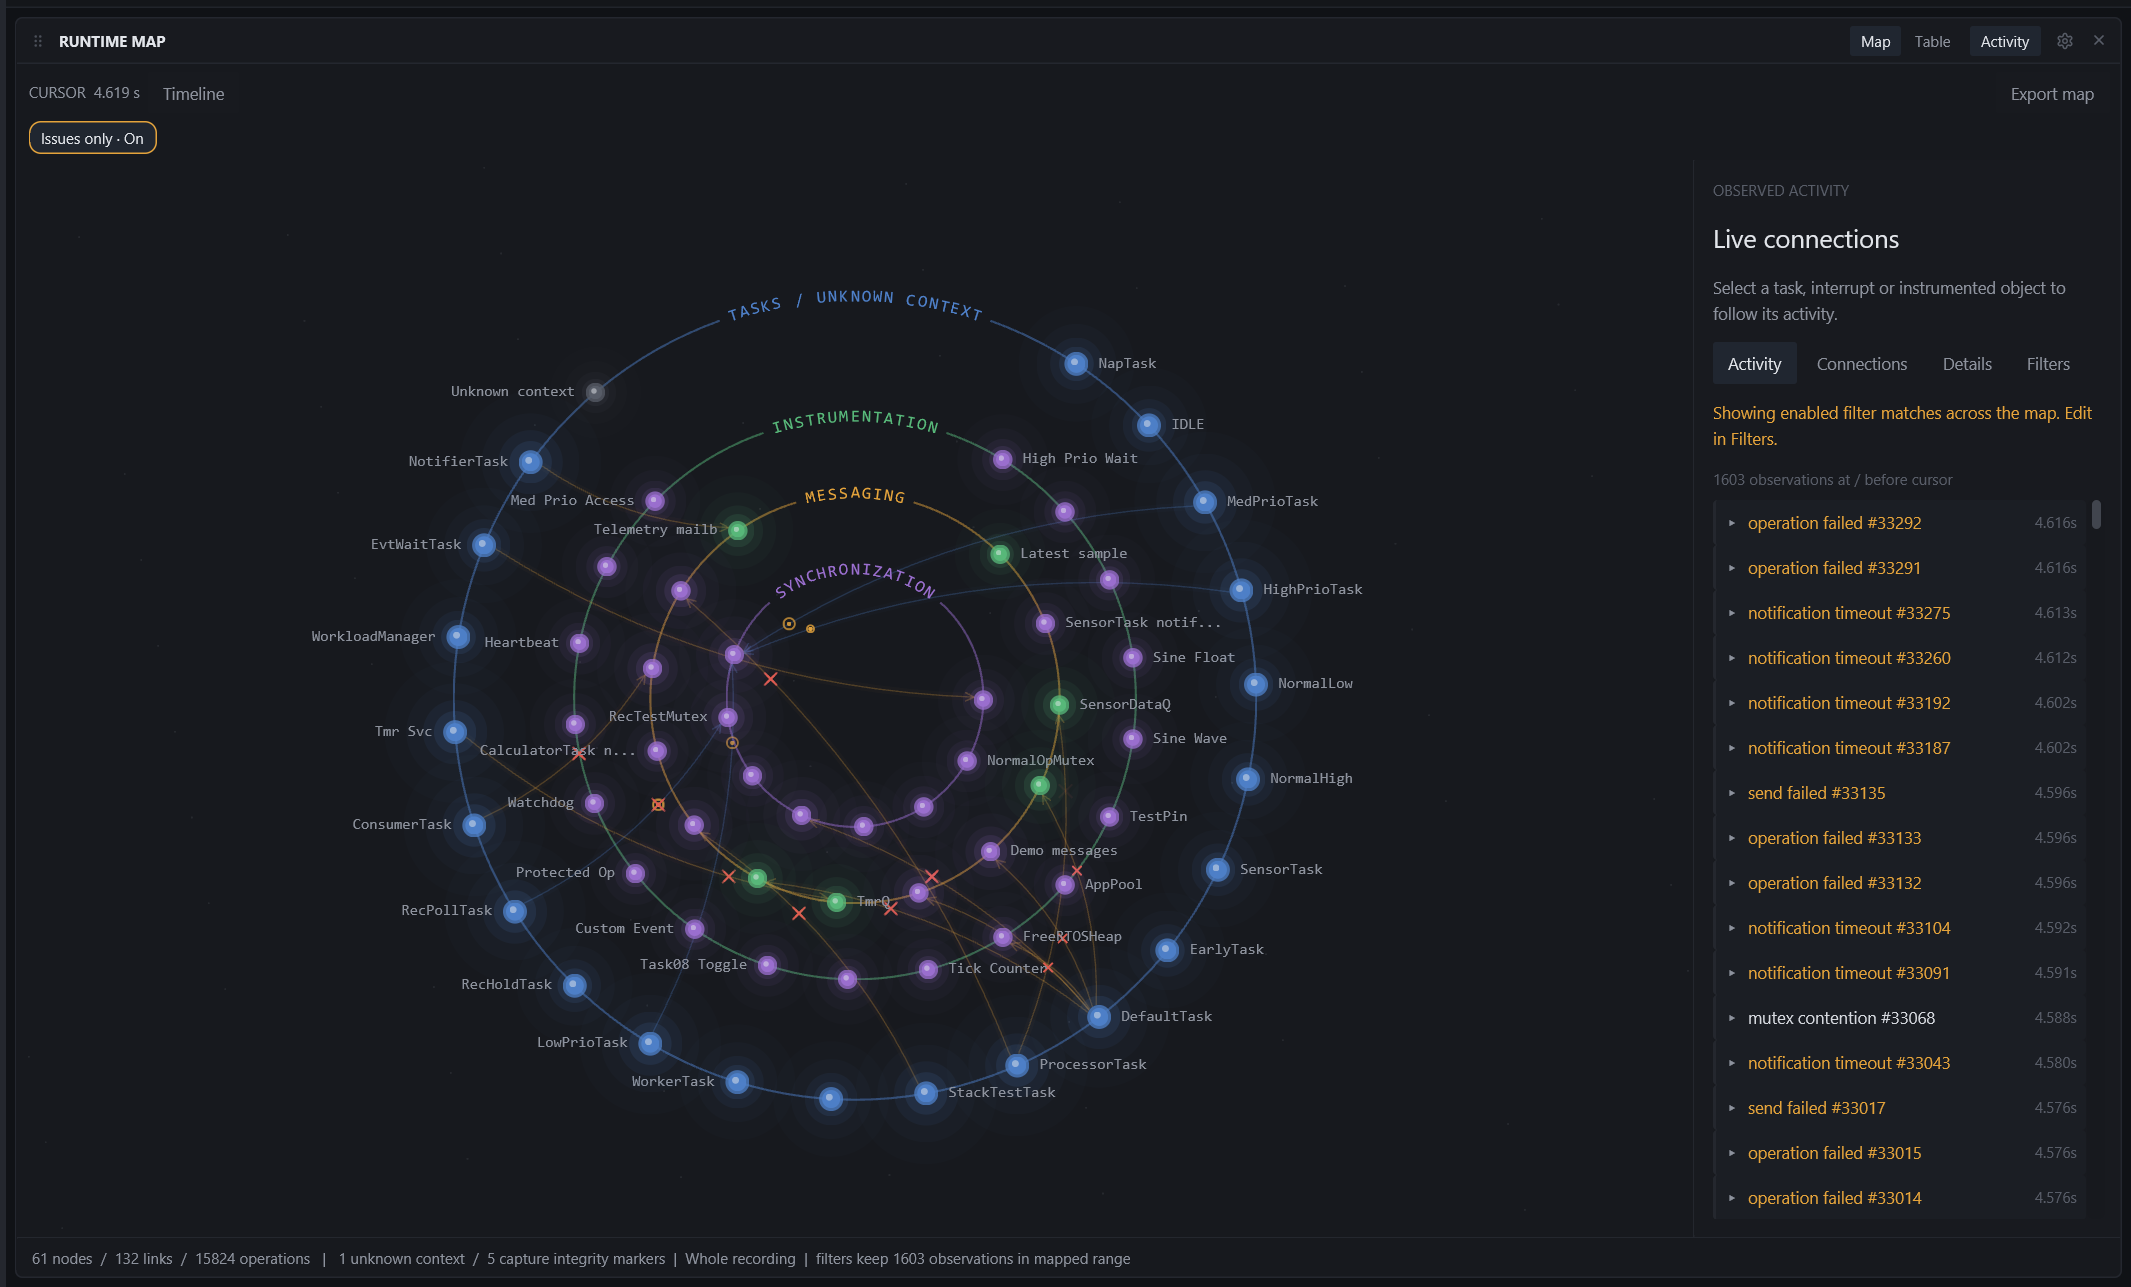
For one object, add it on the Filters tab and pick a mode:
- Isolate hides all other traffic. Several Isolate rules combine.
- Highlight emphasizes the matches and keeps everything else visible.
- Off keeps the rule saved without applying it.
Tags narrow a rule to Failed, Contended, Waiting or Other activity. Contended means the mutex was held when requested; Waiting means an observed blocked wait. Neither alone means the operation failed. Filters change this view only, never the capture or an export.
Table
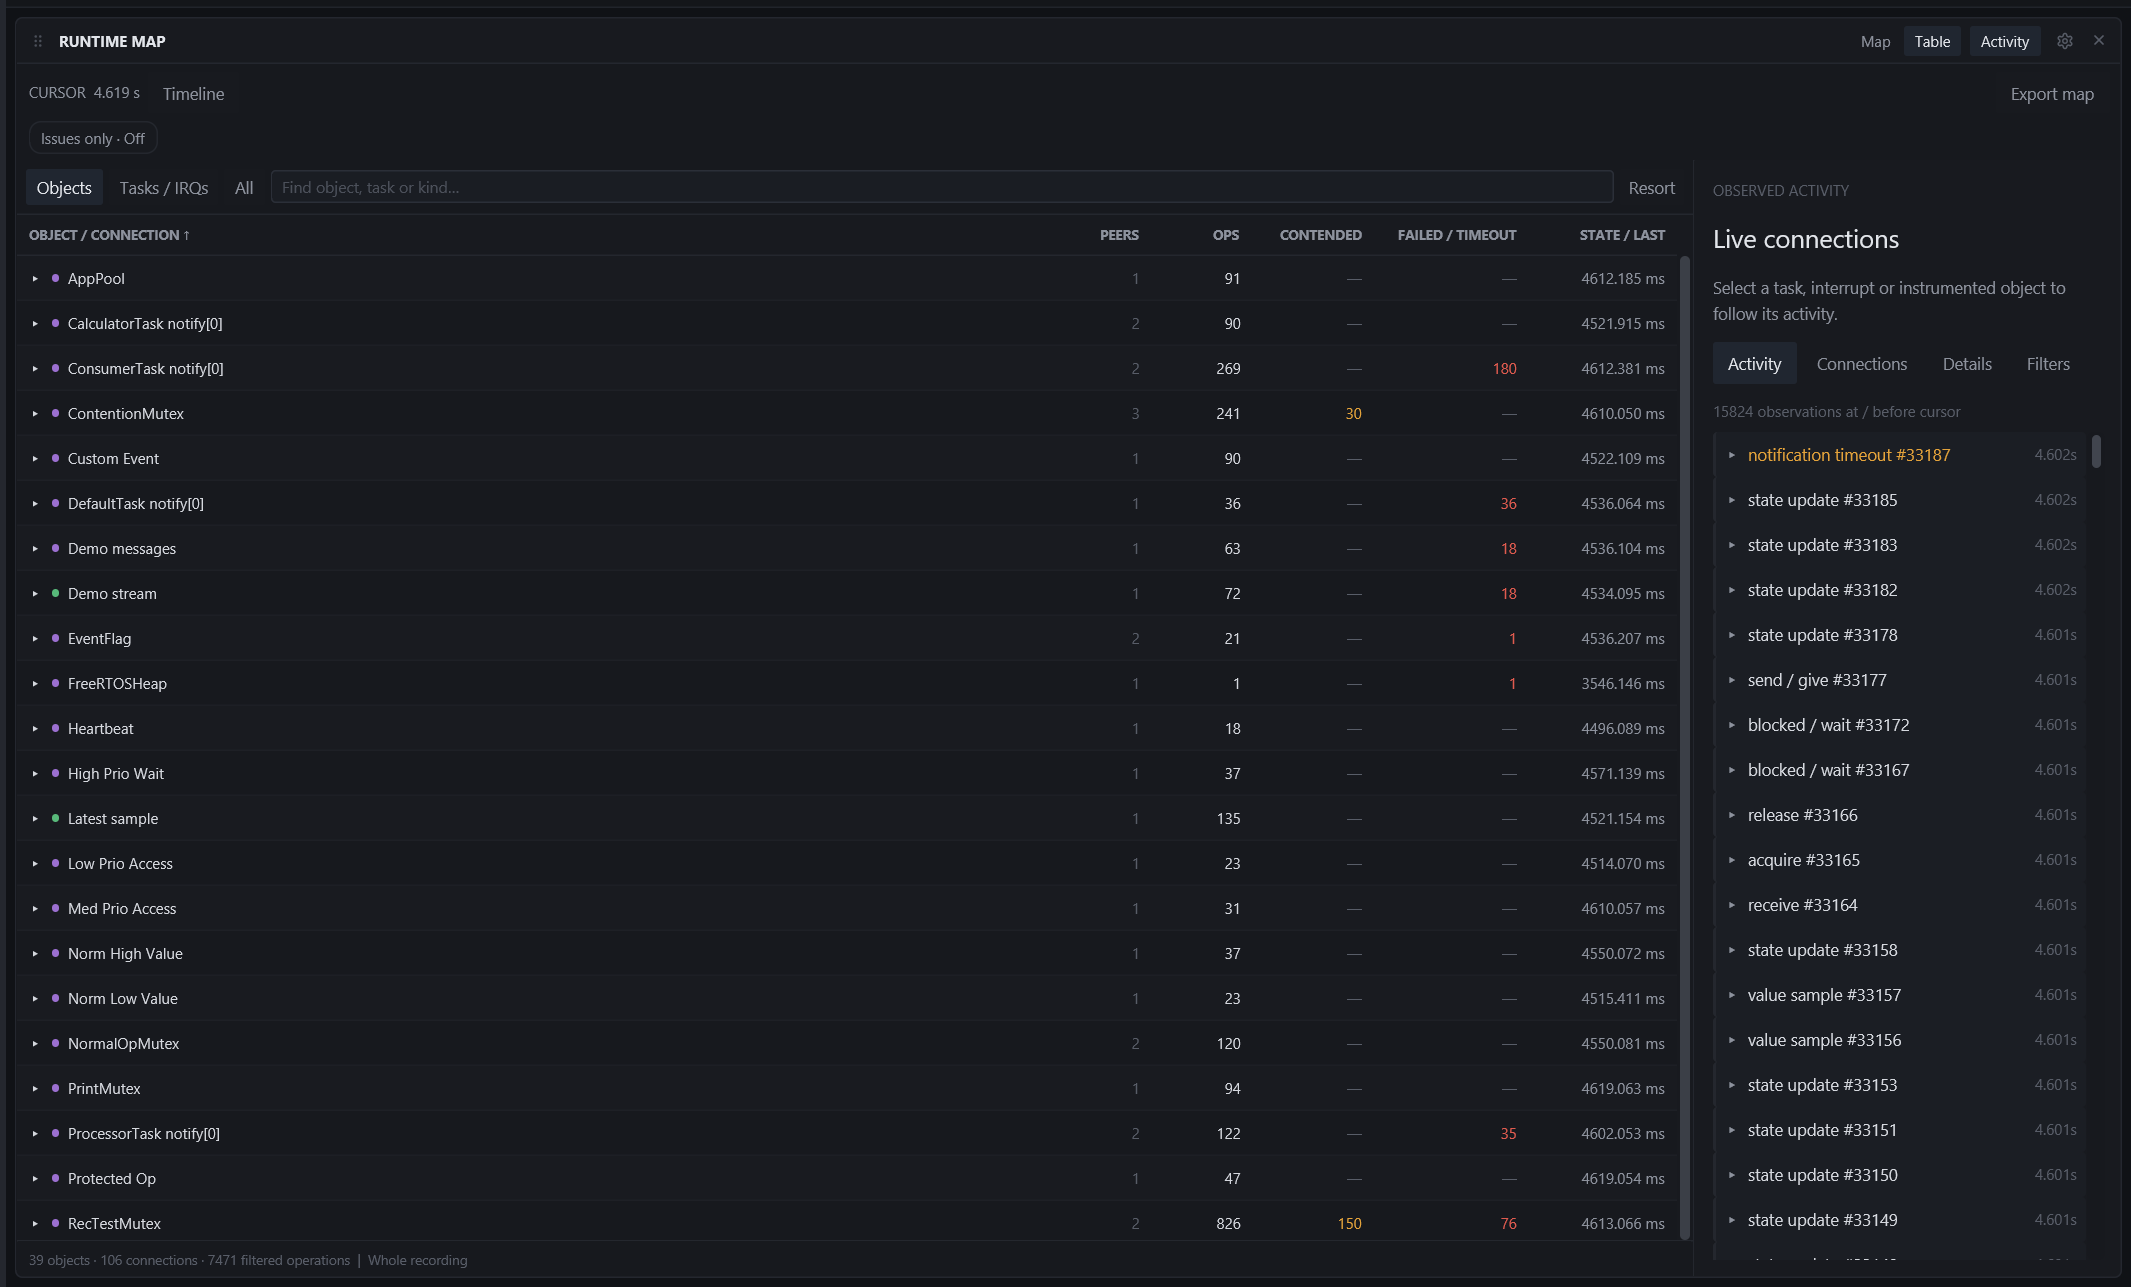
Table in the panel header shows the same data as rows: one per object (or per task and interrupt), with peers, operations, contended count, failed or timed-out count and the last activity. Expand a row for its connections. Sort by any column; search filters by name or kind.
Gear menu
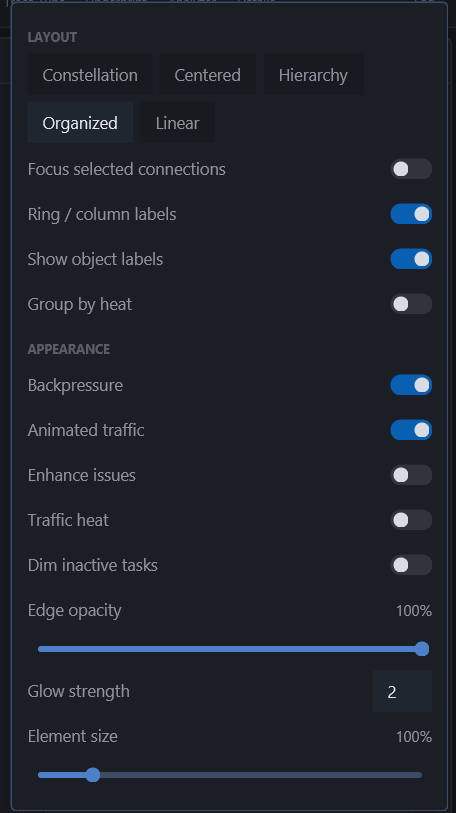
| SETTING | WHAT IT DOES |
|---|---|
| Layout | Constellation, Centered, Hierarchy, Organized or Linear (above). |
| Focus selected connections | With a node selected, dims everything that is not directly connected to it. |
| Ring / column labels | Shows the band names (Organized) and column names (Linear). |
| Show object labels | Shows the name beside every node. Turn it off on very large maps. |
| Group by heat | Arranges nodes by traffic heat (see Heat). |
| Backpressure | Shows pending queue items and notification counts as dots on the object. |
| Animated traffic | Moves dots along links for events near the cursor. Off gives a still picture. |
| Enhance issues | Makes failure, timeout and contention cues more prominent on a busy map, independent of glow. |
| Traffic heat | Colours links by traffic volume (see Heat). |
| Dim inactive tasks | Fades tasks observed sleeping, blocked, suspended or deleted at the cursor; tasks with no known state stay neutral. |
| Edge opacity | How strongly links are drawn. Lower it to see nodes through dense traffic. |
| Glow strength | Halo intensity around nodes, 0 to 4. |
| Element size | Scales nodes, dots and labels together without changing the zoom. |
Export map writes the current map as a .vamap file for sharing or for later comparison.
Replay
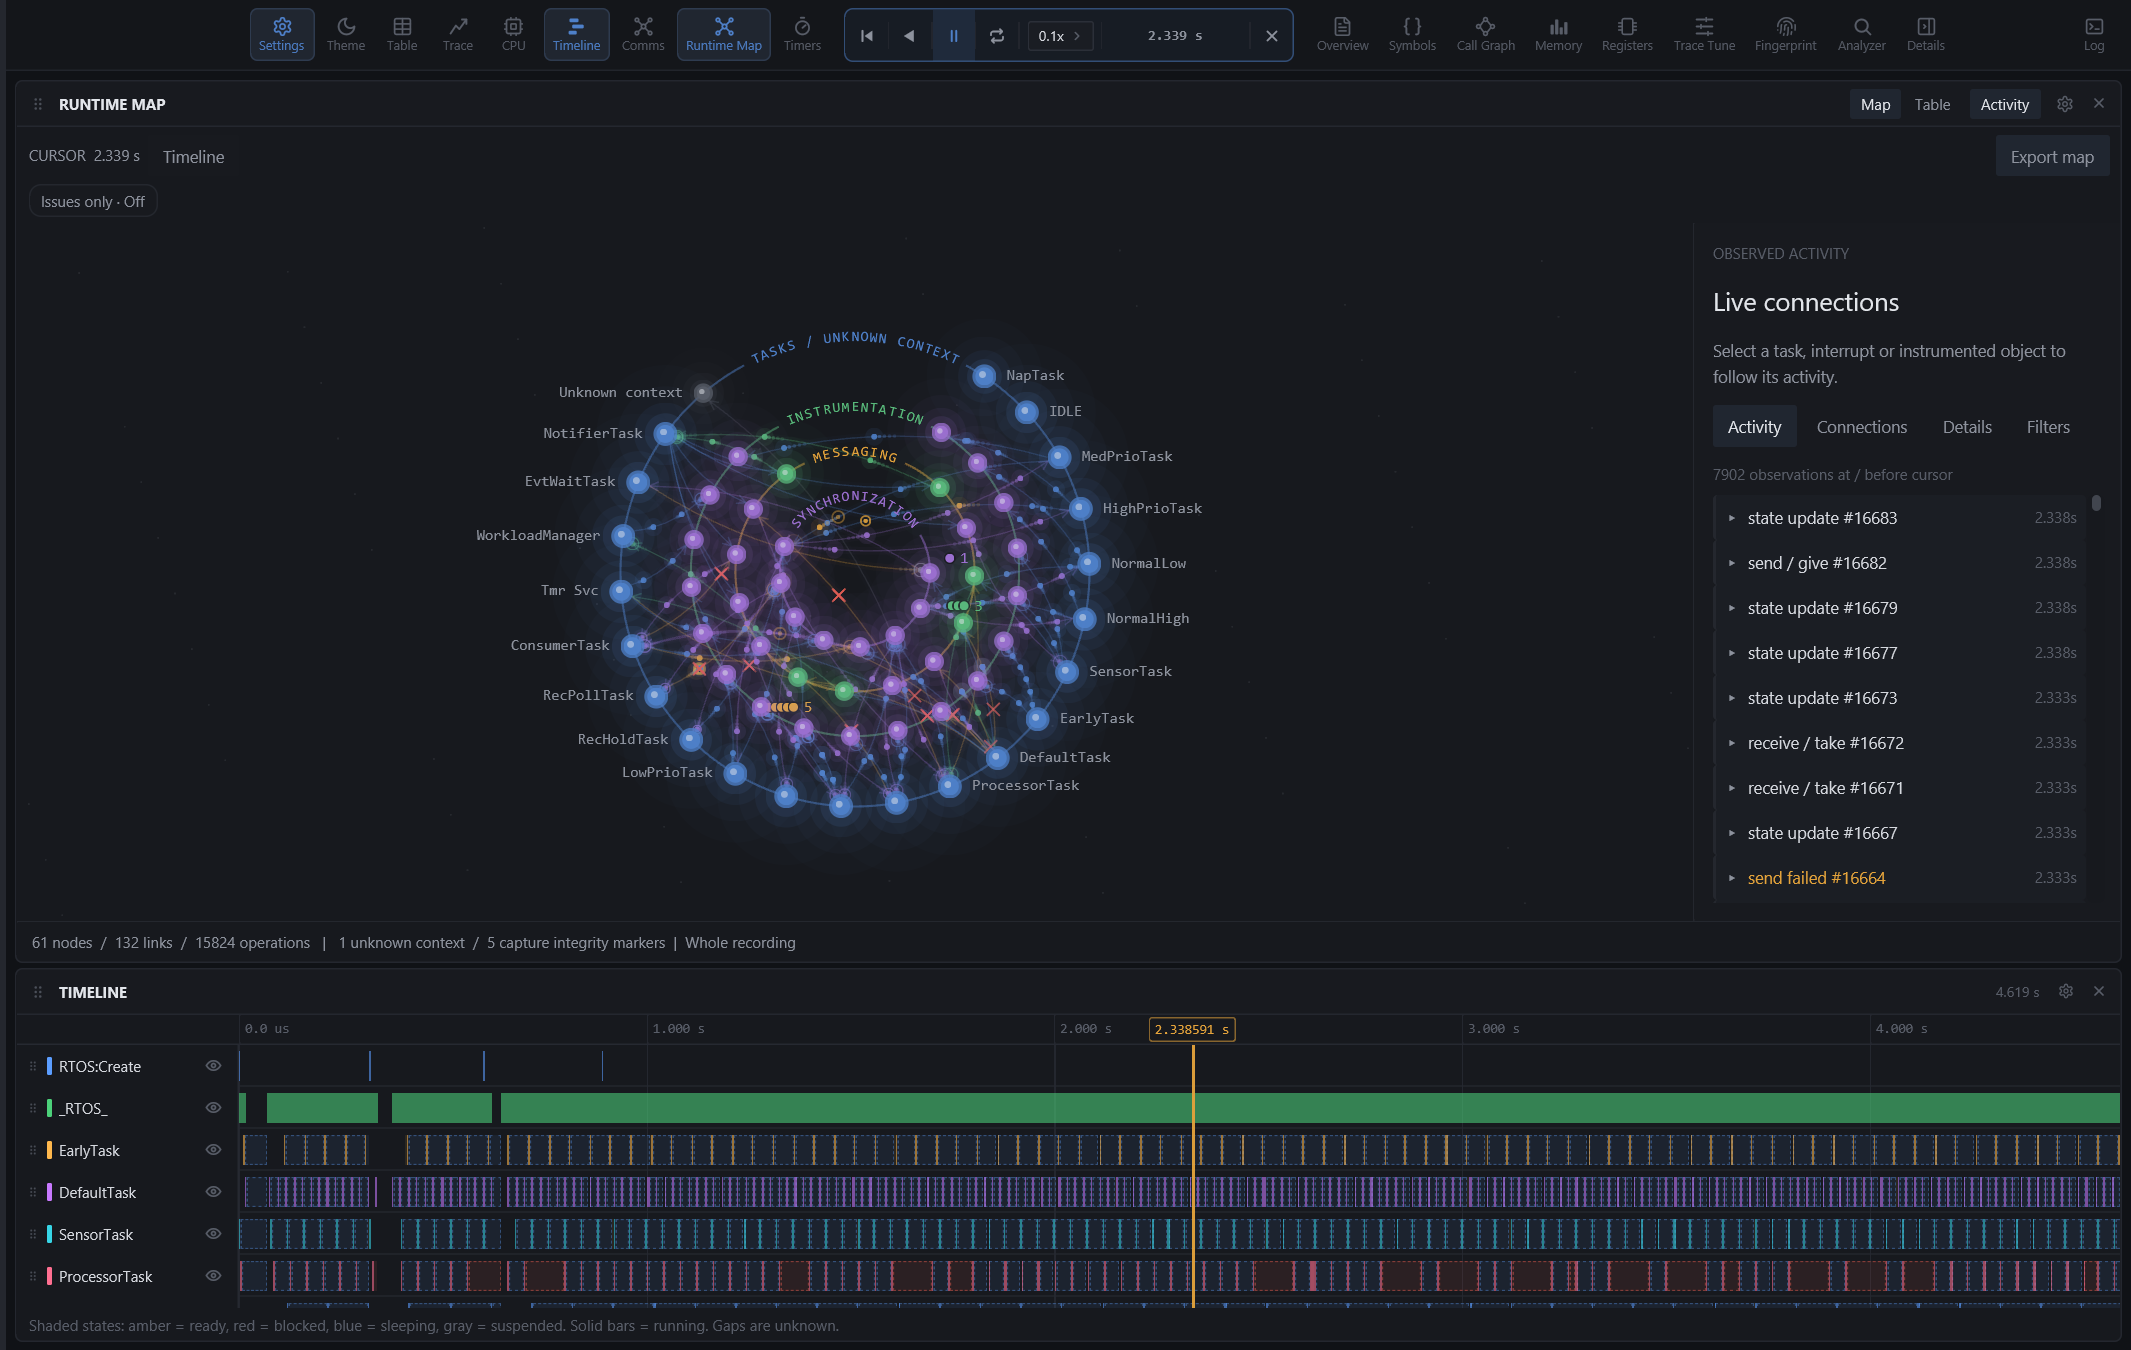
With a recording open, the capsule in the top bar shows REPLAY beside REC. Click it and the capsule turns into the replay controls:

| CONTROL | WHAT IT DOES |
|---|---|
| Restart | Moves the cursor back to the start of the recording (or of the selection) and keeps playing if it was. |
| Reverse | Plays backward; click again to pause. |
| Play / Pause | Plays forward from the cursor, or pauses. |
| Loop | Wraps around at the end instead of stopping. |
| Speed | 0.01x to 2x recording time. Slow speeds make individual events readable. |
| Time | The cursor time; hovering a control shows its name here instead. |
| Exit | Pauses and brings back REC, OPEN and SAVE. The cursor stays where playback stopped. |
Replay moves the shared cursor, so every cursor-linked view follows: the map, the Timeline, the charts and (with follow on) the Event Table. With a Timeline selection, replay stays inside it. Replay keeps running when the map is closed.