 DOCS/BKPT DEBUG/DATA WATCHPOINTS
BKPT DEBUG · VS CODE
DOCS/BKPT DEBUG/DATA WATCHPOINTS
BKPT DEBUG · VS CODE
Data watchpoints
A code breakpoint answers “when does execution reach this instruction?” A data watchpoint answers “which CPU access touched this variable or address?” Use it to catch an unexpected write, stop on a register read, or watch a small memory range without adding firmware logging.
Needs: a debug session and a target with suitable DWT watchpoint comparators. A halt watchpoint does not need SWO, ITM Console, or on-chip trace enabled. Supported sizes and access kinds depend on the actual core.
Catch a changing variable
- Open Views → Breakpoints and find Data watchpoints below code breakpoints.
- Pause. Enter a variable that your firmware writes, such as
uwTickin a HAL-based example. - Choose write, leave type size selected, and press add.
- Wait for Armed. Choose Continue.
- When the watchpoint hits, inspect the reported value and expand Last write hit for the stop PC, function, source link, and instruction.
- Uncheck the row to disable the watchpoint before continuing freely.
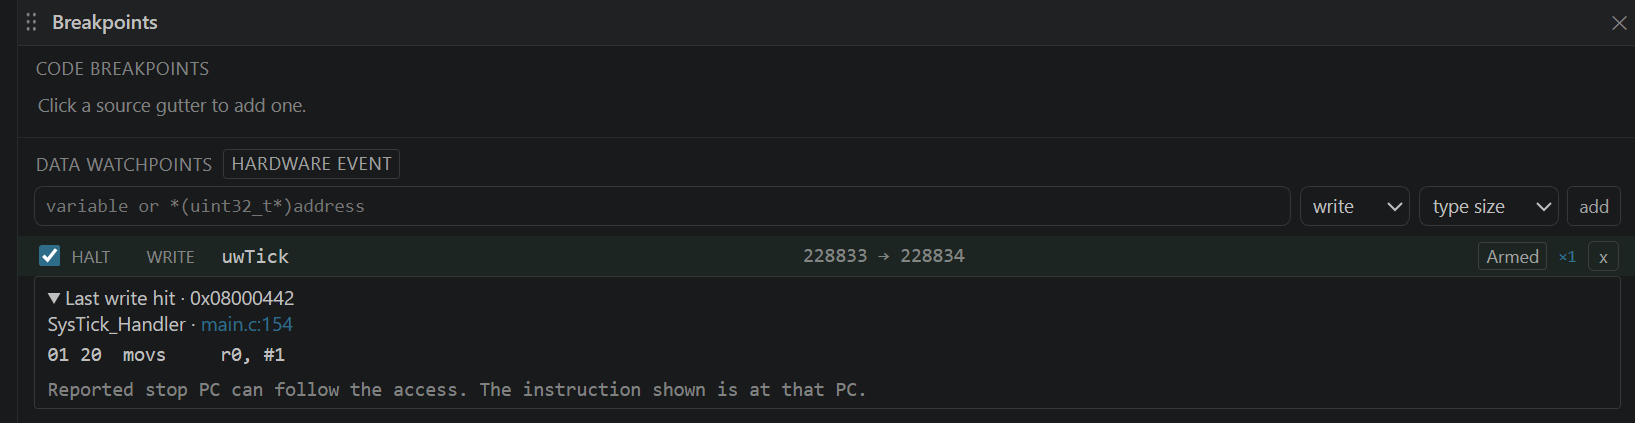
Check: the row says Halt and Armed before Continue. A row that says Saved, Pending, or Error is not confirmation that hardware is monitoring the address.
The add controls
| CONTROL | WHAT TO ENTER OR CHOOSE |
|---|---|
| Expression | A memory-backed variable or member, for example counter, state.flags, or buffer[0] |
| write | Stop for a watched write; GDB's value-watch semantics can suppress a write that leaves the value unchanged |
| read | Stop for a CPU read of the watched location, where the core supports it |
| access | Stop for CPU reads or writes; this is called read / write in the compact Break on… dropdown |
| type size | Infer the watched size from the expression's type |
| 1 B, 2 B, 4 B, 8 B, 16 B, 32 B | Request a contiguous range of that many bytes starting at the expression's address |
| add | Save the intent and apply it when the target can accept it |
For an address, use an explicit size with 0x20000100, or a typed memory expression such as *(uint32_t*)0x20000100. Replace this example address with valid memory in your firmware. A bare constant is not a variable with a meaningful inferred watch size.
An explicit range must be aligned to its size: a 4-byte range starts at an address divisible by 4; a 16-byte range starts at an address divisible by
- type size does not promise that every C type is watchable. The target
may reject a large range, unsupported access kind, or a register-only local. Try a supported member or smaller aligned range.
Add a watch where you are working
- Variables: use the row's Break on… dropdown.
- Code / symbol popup: use Break on… when the symbol resolves to a memory address.
- Memory: navigate to an address, choose the byte count next to Break on…, and select the access kind. The watch starts at the displayed memory window's address.
- Peripheral Registers: select Break on write, Break on read, or Break on access. The central list retains the readable SVD register name.
All of these lead to the same Data watchpoints list. A variable's expression is resolved again for each session and ELF; a local must exist in the current frame when it is resolved. A watch tracks the resolved memory location, not the lifetime of a C object after its stack storage is reused.
Saved intent and status badges
| BADGE | MEANING AND NEXT STEP |
|---|---|
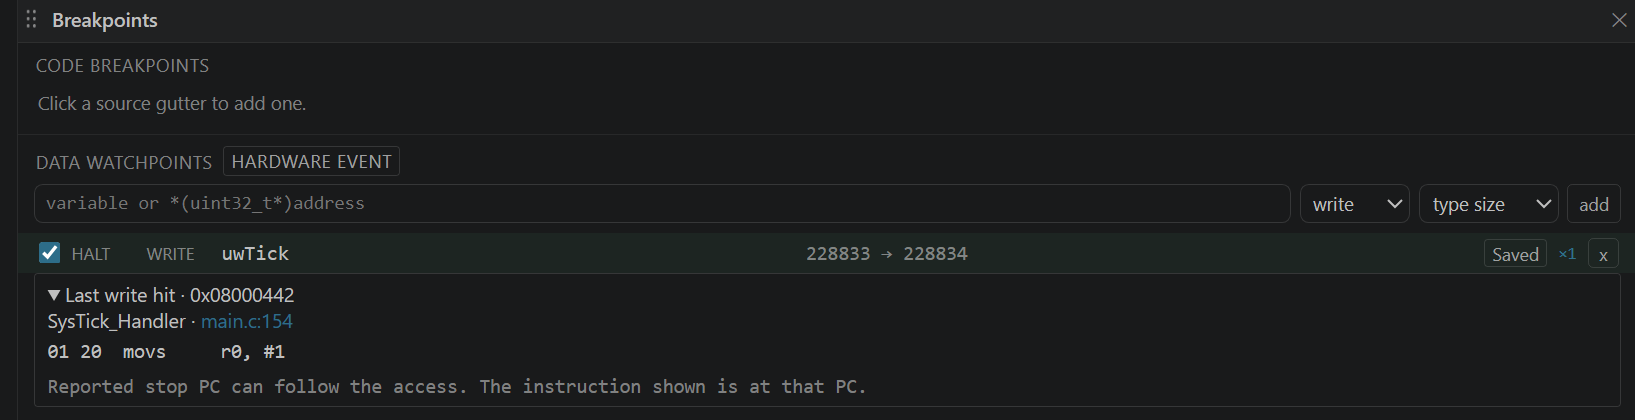
| Saved | The project remembers the request. Start or attach to apply it. |
| Pending | It has not yet been accepted. Pause if it is waiting for a halt; for a Trace row, also check the selected trace source. |
| Armed | The target accepted the watch. A Halt row stops the core; a Trace row streams matching accesses. |
| ! Error | Hover the badge for the specific reason. Fix the address, size, missing trace setup, or exhausted comparator pool, then retry. |
| Disabled | A halt definition is saved but inactive. Its checkbox enables it again. |
The definition stays visible when setup fails so you can see what you asked for. The Hardware event badge identifies the observation mechanism; it does not override the row's acceptance status. Hover the expression for its resolved address and the status badge for the reason. × removes a halt definition. A Trace row's edit returns to the view that owns its setting.
Halt versus Trace, and the DWT budget
DWT means Data Watchpoint and Trace, an on-chip debug block. Its comparators are a limited pool of address matchers. Halt watches and streamed Trace watches share this pool; neither gets an unlimited set. The Breakpoints header reports usage such as 2/4 DWT (1 halt). FPB is the separate instruction-breakpoint hardware, used for code breakpoints.
| REQUEST | RESULT | SWO REQUIRED? |
|---|---|---|
| Halt | A matching access stops execution for inspection | No |
| Trace | Matching accesses feed values/events to Traces while the CPU runs | Yes, with supported on-chip trace configured |
| Poll in Symbols or Peripheral Registers | Repeated probe reads observe sampled values | No; consumes probe traffic rather than DWT slots |
Streamed data packets can identify only the first four comparator slots. Additional comparators discovered on a target can still serve halt watchpoints. Some range requests use more resources or are refused; the displayed capability count is authoritative for the connected target. BKPT does not silently substitute a slow software watchpoint when hardware allocation fails.
Understand a hit
The row shows old and new values when GDB supplies them. ? means a value was not supplied, not zero. Read/access hits do not always have a useful before-and-after pair.
The expanded hit detail shows the reported stop PC. On Cortex-M this can be the instruction after the access. The displayed instruction is at that PC; use Mixed or Assembly to inspect nearby instructions before deciding which instruction performed the access. Instruction details load only when you open the hit; pause first if execution has resumed.
DWT monitors CPU accesses. DMA or a peripheral can change memory without a CPU access and without a DWT hit. Use a sampled watch to observe a persistent DMA result, and investigate its producer separately.
Keep or remove watches between sessions
Halt definitions are saved in bkptDebug.dataWatchpoints. Trace definitions belong to their Symbols, Peripheral Registers, or Hardware Trace settings. Stopping the session releases its live resources while retaining intent for the next session. Enable or disable a saved halt watch with its checkbox. After a probe loss, use the explicit recovery workflow before restoring setup.