 DOCS/TRACE DOMAINS/USBX ON THREADX · STM32U575
BKPT DEBUG & VIEWALYZER RS
DOCS/TRACE DOMAINS/USBX ON THREADX · STM32U575
BKPT DEBUG & VIEWALYZER RS
USBX on ThreadX · STM32U575
Follow USB traffic from the STM32U575 controller through USBX CDC ACM and the ThreadX application. This domain brings 37 sampled inputs and five derived channels into live cards, tables and traces, so you can tell a configured idle bridge from work that has stopped progressing.
Note: The screenshots show the earlier 24-input bridge view. The current download adds stack-error reports, a control queue and USBX allocator state: 37 inputs and 42 raw-plus-derived channels. See the engineering reference for every field, value dictionary and finding. The setup below remains applicable.
Before you start
Download the USBX on ThreadX domain. Install this same file in either product. It targets STM32U575 and the STM32Cube USBX CDC ACM on ThreadX example, including its application symbols. It is not a universal domain for every USBX firmware or STM32 device.
Have these items ready:
- A NUCLEO-U575ZI-Q running the matching USBX CDC ACM to USART1 bridge firmware, with ThreadX. The example is based on STM32CubeU5's
Ux_Device_CDC_ACMapplication. - Its Debug ELF with DWARF information, from the exact build on the board. Structured fields need member types and offsets, not just symbol names.
- The STM32U575 SVD matching the target. It supplies the OTG_FS registers and their RCC clock-enable precondition. Firmware-object-only sampling does not require these register reads.
- Two USB data connections: CN1 / ST-LINK for the probe and UART bridge, and CN15 / target USB-C for the firmware's CDC port. A probe connection alone does not connect the target's USB device to the host.
The example project keeps the descriptor in domains/stm32u575-usbx-threadx.vadomain. A local Debug build produces build/<OS>/threadx-debug/Nucleo_U575_USBX_ThreadX.elf. Select that actual output; another build directory may contain a different ELF. A downloaded descriptor contains no firmware or ELF.
Start in BKPT Debug
- Open the firmware project in VS Code and open the BKPT Debug layout. Select your probe and the matching Debug ELF.
- Open Peripheral Registers from Views, then Open SVD and select the STM32U575 SVD.
- Open Trace Domains. Choose Install custom trace domain…, select the downloaded file, and enable STM32U575 USBX CDC ACM on ThreadX for this workspace.
- Start or attach the debug session. If the target is halted, choose Continue. USB initialization and host enumeration require running firmware.
- Open Traces alongside Trace Domains. Once initialization completes with the target USB connected, expect 37 observed inputs, 0 unavailable, and 42 raw plus derived trace channels.
USB traffic is optional for this first check. You can see a configured device and valid controller/firmware values before opening either serial port. Flat traces are normal when their values are not changing.
Choose what to poll in BKPT Debug
Expand Settings inside this domain and set the requested polling rate from 1 to 1,000 Hz per input. The USBX descriptor supplies a 20 Hz default, which you can adjust for your capture. Observed shows the rate achieved with your probe and selected inputs; selecting fewer inputs can allow faster sampling.
Use All inputs, Registers only, Firmware objects only, or None, then adjust individual checkboxes. Firmware objects only selects 32 RAM inputs without peripheral reads. Registers only selects five controller inputs plus the required RCC clock guard. Required guards remain enabled while a selected input needs them.
Before applying a selection, Settings lists the derived values and checks it will disable, with their required input names. After Apply settings, those items say Disabled by settings. For example, disabling usb.gahbcfg disables Interrupt delivery and its interrupt-delivery check. Disabling only an optional evidence input leaves a check available with reduced evidence, clearly identified beside it.
Applying changes saves this workspace's choices, clears this domain's findings, and starts a fresh observation window. Re-enabled checks need fresh samples for their required duration; old samples cannot complete the new window. Existing trace history remains visible, while disabled inputs stop adding samples. Reset defaults restores the descriptor's rate and all inputs.
USB controller cards
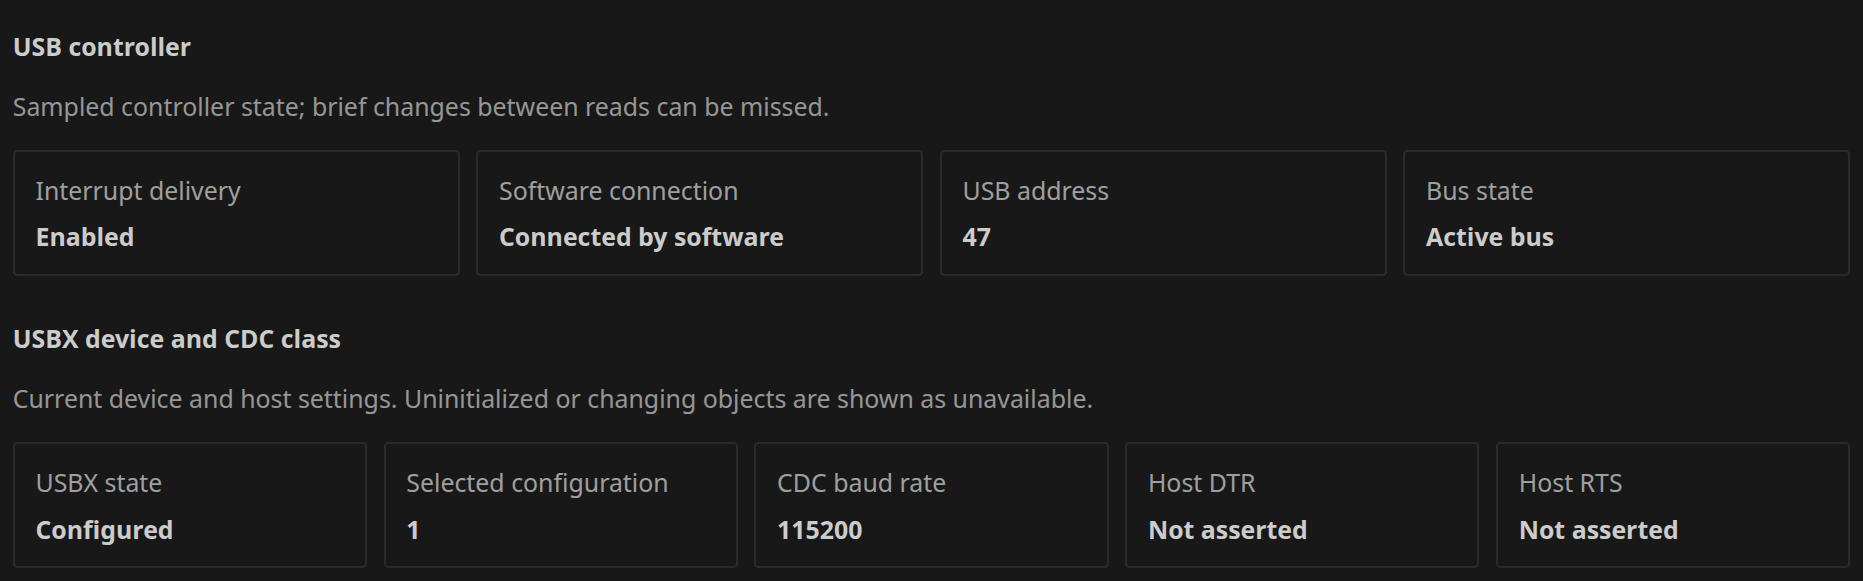
| CARD | MEANING | INTERPRET IT WITH |
|---|---|---|
| Interrupt delivery | The controller's global interrupt-enable bit. Enabled permits interrupt delivery; it does not prove that every individual interrupt is unmasked or serviced. | The raw usb.gintmsk mask, endpoint demand and application progress. |
| Software connection | The inverse of the controller's software-disconnect state. Connected by software means software is not holding the controller disconnected. | Host enumeration and USBX state. This card alone cannot prove a cable is present. |
| USB address | The device address field in the controller configuration. The host assigns an address during enumeration. | USBX state and selected configuration. The particular address varies between sessions. |
| Bus state | The sampled suspend-status bit: Active bus or Suspended. | Host power management and connection state. Suspension is not automatically an error. |
USBX device and CDC class cards
| CARD | MEANING | TYPICAL CONFIGURED OBSERVATION |
|---|---|---|
| USBX state | The software device-state field: Reset (0), Attached (1), Addressed (2), Configured (3), Suspended (4). | Configured means the stack has reached that state. It can remain Configured during an interrupt-delivery fault. |
| Selected configuration | The configuration selected by the host in USBX. | 1 for this example. It is a configuration value, not a transfer count. |
| CDC baud rate | The host's CDC line-coding baud rate stored in the class object. | 115200 in the demonstrated serial setup. It describes serial line coding, not USB bus speed. |
| Host DTR | The CDC data-terminal-ready control-line state. | May be Not asserted until a host application opens the port. |
| Host RTS | The CDC request-to-send control-line state. | Depends on the host application. An unasserted line by itself does not establish a fault. |
These fields come from live USBX objects. Before the class instance exists, the corresponding inputs can be unavailable. Once the pointer and members resolve, they join the observation stream.
CDC endpoint tables
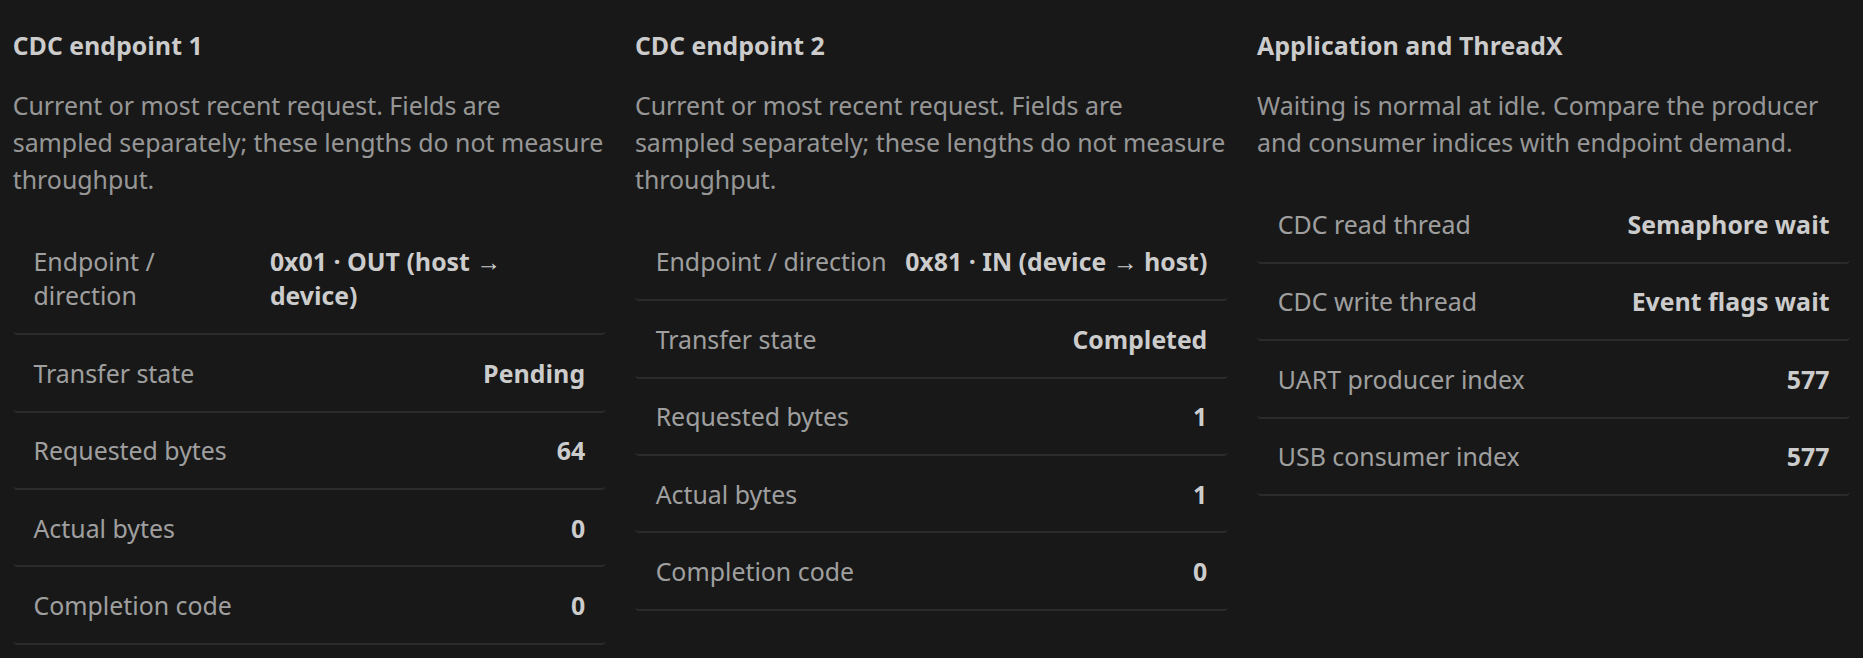
CDC endpoint 1 follows the first endpoint in the CDC interface's linked list; CDC endpoint 2 follows the next one. The numbers identify the descriptor's traversal order. Read Endpoint / direction to identify the actual USB endpoint.
In this bridge, the observed endpoints are 0x01 OUT, from host to device, and 0x81 IN, from device to host. USB direction is always relative to the host.
| ROW | WHAT IT MEANS |
|---|---|
| Endpoint / direction | The USB endpoint descriptor's address. Bit 7 indicates IN; a clear bit indicates OUT. |
| Transfer state | The current or most recent USBX transfer request: Not pending (0), Pending (1), Completed (2), or Aborted (4). |
| Requested bytes | The length requested for this transfer, not a cumulative byte counter. |
| Actual bytes | The actual-length field of that request. A waiting OUT read can show requested bytes with zero actual bytes until data arrives. |
| Completion code | The request's result field. Interpret it with transfer state; zero alone does not prove the request has completed. |
An OUT endpoint Pending on a 64-byte read while no host is sending data is a normal idle condition. An IN endpoint with no pending request can also be idle. Each field is sampled separately, so a request can change between reads. These tables do not count every USB transfer or measure throughput.
Application and ThreadX
| ROW | SOURCE | MEANING |
|---|---|---|
| CDC read thread | ux_cdc_read_thread.tx_thread_state | The ThreadX state of the thread handling USB OUT data. Semaphore wait (6) is normal while waiting for input. |
| CDC write thread | ux_cdc_write_thread.tx_thread_state | The ThreadX state of the USB IN writer. Event flags wait (7) is normal while waiting for UART data. |
| UART producer index | UserTxBufPtrIn | Where incoming UART data advances the ring's producer. |
| USB consumer index | UserTxBufPtrOut | Where the USB writer has consumed that ring. |
The two indices wrap in a 2048-byte ring; they are not lifetime byte counts. Under traffic they advance and wrap. At idle they can be equal and stop moving. Compare their progress with endpoint demand before diagnosing a stalled bridge. A waiting thread alone is not an error, and separate index samples do not guarantee an exact instantaneous queue length.
Make activity visible
This firmware bridges two serial ports. Data sent to the ST-LINK UART appears at the target's USB CDC port; data sent to the CDC port appears at the UART. It does not echo back to the same port.
Open both ports in serial terminals at 115200, 8-N-1, no flow control, and send data in both directions. Close those terminals before using the project's optional Python traffic helper, because the helper opens both ports itself.
For the example project that includes tools/domain_traffic.py, install its pyserial dependency and run the following from the project root. Replace the two port placeholders with your machine's UART and target CDC ports; Windows COM numbers and macOS/Linux device paths differ.
python -m pip install pyserial
python tools/domain_traffic.py --uart YOUR_UART_PORT --cdc YOUR_CDC_PORT --duration 60 --output usb-traffic.json --stop-file usb-traffic.stop
The helper sends test payloads in both directions and checks the received bytes. It stops after the requested duration, allowing an in-flight transfer to finish or time out. Ctrl+C stops it early. If a previous usb-traffic.stop file exists, remove that file before starting another run. Use the helper only when you own both serial ports and the board's test session.
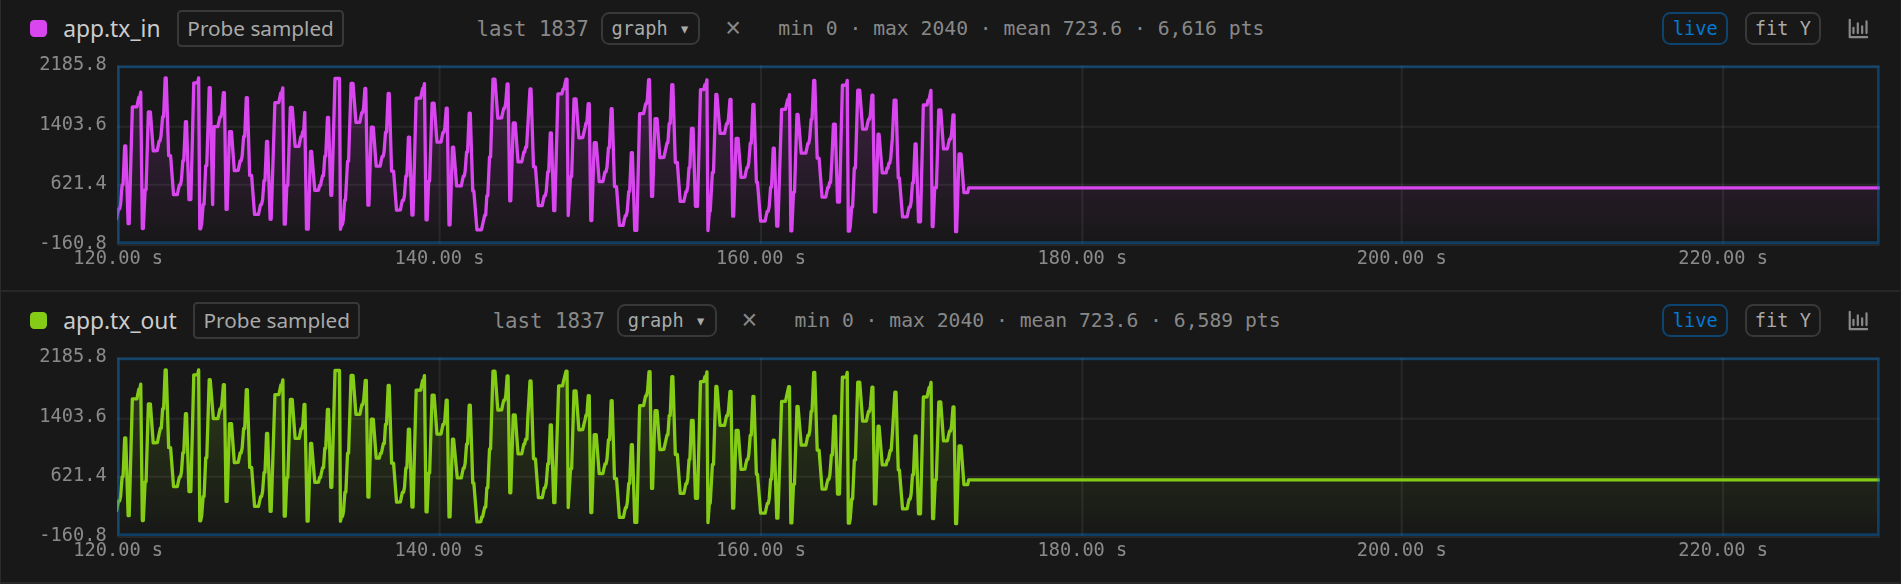
Watch the producer/consumer indices advance during UART-to-USB traffic, the endpoint request fields change, and DTR/RTS reflect the host's port settings. Some transfers complete between polls and will not be visible. When the helper exits and releases the ports, the indices should settle again; the domain can stay observed and Configured.
All registers and trace channels
The input list contains five controller registers, 30 structured firmware fields and two application variables. Five decoded fields bring the available channel total to 42. Select Graph for the histories you want displayed; other values remain in the domain view. The RCC clock guard is an additional prerequisite read, not an additional displayed trace. Use the domain's Settings in BKPT Debug to choose the polling rate and active inputs.
Raw controller registers
All five come from OTG_FS in the STM32U575 SVD. They are declared read-safe configuration/status inputs; reading them does not acknowledge an interrupt.
| TRACE | SVD REGISTER | PURPOSE |
|---|---|---|
usb.gahbcfg | OTG_FS.GAHBCFG | AHB configuration; bit 0 is the global interrupt-enable bit used by this domain. |
usb.dctl | OTG_FS.DCTL | Device control; bit 1 is software disconnect. |
usb.dsts | OTG_FS.DSTS | Device status; bit 0 is suspend status and bits 2:1 encode enumerated speed. |
usb.dcfg | OTG_FS.DCFG | Device configuration; bits 10:4 hold the device address. |
usb.gintmsk | OTG_FS.GINTMSK | Individual interrupt mask. This is distinct from the global enable bit in GAHBCFG. |
The five controller inputs require RCC.RCC_AHB2ENR1 OTGEN, mask 0x4000. When this clock is disabled, those register inputs are unavailable; firmware-object sampling can remain available. It does not represent unavailable values as zero.
USBX and ThreadX inputs
| TRACE | FIRMWARE VALUE RESOLVED THROUGH THE ELF |
|---|---|
usbx.device_state | _ux_system_slave → device → state |
usbx.configuration | _ux_system_slave → device → selected configuration |
usbx.baud | cdc_acm → baud rate |
usbx.dtr | cdc_acm → DTR state |
usbx.rts | cdc_acm → RTS state |
usbx.ep1.address | First CDC endpoint → descriptor → address |
usbx.ep1.status | First CDC endpoint → transfer request → status |
usbx.ep1.requested_length | First CDC endpoint → transfer request → requested length |
usbx.ep1.actual_length | First CDC endpoint → transfer request → actual length |
usbx.ep1.completion_code | First CDC endpoint → transfer request → completion code |
usbx.ep2.address | Next CDC endpoint → descriptor → address |
usbx.ep2.status | Next CDC endpoint → transfer request → status |
usbx.ep2.requested_length | Next CDC endpoint → transfer request → requested length |
usbx.ep2.actual_length | Next CDC endpoint → transfer request → actual length |
usbx.ep2.completion_code | Next CDC endpoint → transfer request → completion code |
threadx.read_state | ux_cdc_read_thread → tx_thread_state |
threadx.write_state | ux_cdc_write_thread → tx_thread_state |
Member offsets come from the matching ELF's debug information. Pointer slots are reread, so null, invalid or changing object paths can produce gaps rather than stale values. This validation cannot detect every lifetime race, including reuse of the same memory address.
The current descriptor also observes usbx.last_error, usbx.error_count, five app.control_queue.* fields and six usbx.memory.* fields. Their cards show retained error reports, USB start/stop queue occupancy and allocator free/total values. These are distinct from CDC payload buffering. The engineering reference documents their exact paths, units, pressure thresholds and limitations.
Application inputs and derived traces
| TRACE | SOURCE OR CALCULATION | INTERPRETATION |
|---|---|---|
app.tx_in | UserTxBufPtrIn | UART producer ring index. |
app.tx_out | UserTxBufPtrOut | USB consumer ring index. |
usb.interrupts_enabled | usb.gahbcfg & 1 | Disabled (0) / Enabled (1). |
usb.soft_disconnect | (usb.dctl >> 1) & 1 | Connected by software (0) / Software disconnected (1). |
usb.suspended | usb.dsts & 1 | Active bus (0) / Suspended (1). |
usb.address | (usb.dcfg >> 4) & 0x7f | Device address, 0–127. |
usb.enumerated_speed | (usb.dsts >> 1) & 3 | The SVD's encoded speed. This full-speed example normally reports Full speed (48 MHz PHY), value 3. |
The two application values are raw polled inputs. The five usb.* values in the last five rows are Derived channels. Enumerated speed is available in Traces even though it is not one of the controller cards.

Findings and their limits
The current descriptor also checks additional USBX error reports, recognized endpoint error codes, control-queue free slots and allocator free space. See the complete finding reference. The original controller checks used in this walkthrough are:
| FINDING | TRIGGER | WHAT TO INVESTIGATE |
|---|---|---|
| USB interrupt delivery disabled · error | Global enable remains clear for at least 500 ms of valid observation while the USB clock is enabled. | Controller startup and interrupt-masking paths. Compare endpoint pending work and ring progress: USBX can still say Configured. This rule assumes this example's interrupt-driven driver. |
| USB device held in software disconnect · warning | Software disconnect remains set for at least 500 ms of valid observation. | Intentional disconnect, startup and power-management paths. It does not prove that a cable is absent or a ThreadX thread is faulty. |
In BKPT Debug, expand a finding for its explanation and evidence. Show evidence in Traces brings the supporting signals into view. Acquisition problems belong in Health and input availability; subsystem findings describe conditions in the observed USB state.
If your example firmware includes the optional B1 button fault demo, a short press after enumeration deliberately disables interrupt delivery for three seconds of running target time, then restores it. The interrupt-enable trace falls to zero and the finding appears after the sustained interval. Halting the CPU pauses the firmware's recovery timer. This demo is a property of that firmware build, not something installing a domain adds to arbitrary firmware.
Use the same domain in ViewAlyzer RS
- End the BKPT Debug session to release the probe. Open ViewAlyzer RS and configure the same target with the matching ELF and SVD. Turn Software Trace off for domain-only capture. The app polls domain inputs without a recorder control block. Enable Software Trace only when also collecting compatible recorder data; RAM snapshots require recorder firmware.
- In the sidebar's Trace Domains section, choose Load Domain File and select the same
.vadomain. Enable it before starting a capture. - Start capture with the target running, and open the domain's sidebar gear to inspect its live cards and tables. Collapse sections you are not inspecting, and enable Graph for the values you want in Trace. The pencil opens the JSON editor.
- Stop capture to review the derived series, completed findings and their evidence. A finding describes its interval in the recording; it need not indicate a fault is still active now.
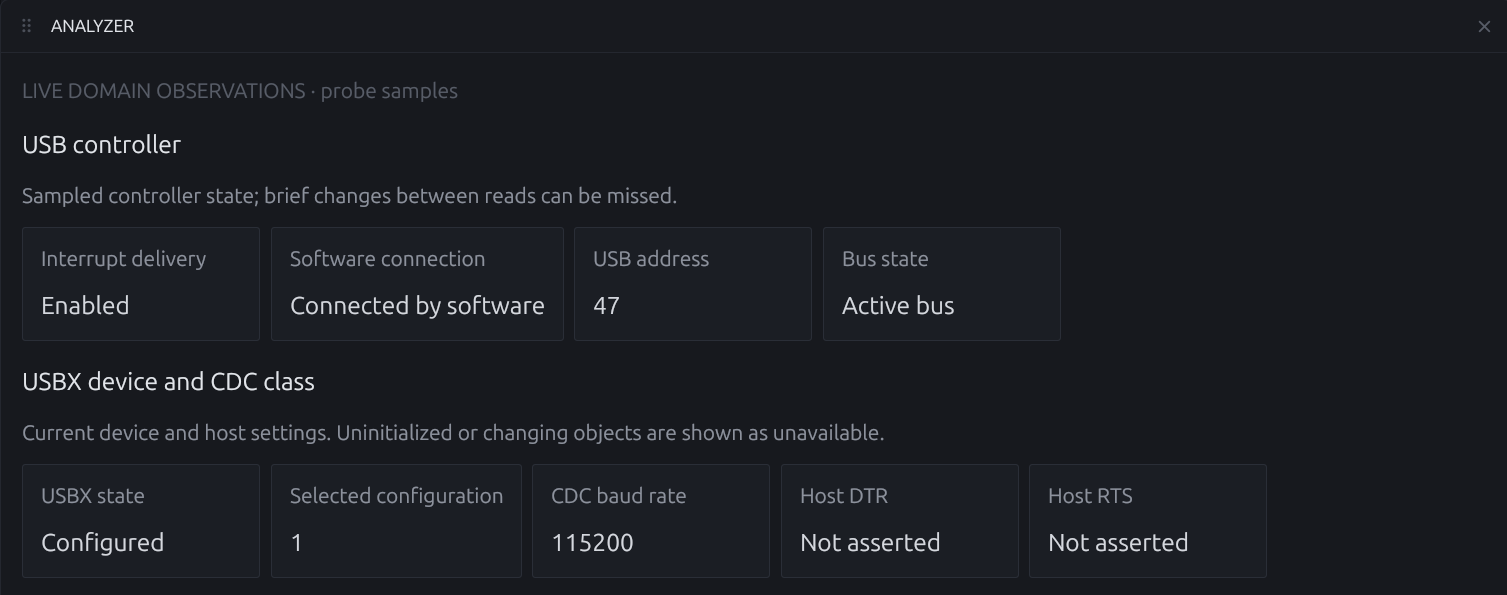
The same domain supplies the channel names, derived fields and rules in both products. Their views and timing of report evaluation differ. Installing the domain into the desktop app does not install it into BKPT Debug, and opening a recording does not read new state from the board.
When the view looks empty or unavailable
| WHAT YOU SEE | WHAT IT MEANS AND WHAT TO DO |
|---|---|
| Waiting, no session | Start or attach debugging, or start the desktop capture. Enable the domain before acquisition. |
| Inputs unavailable, Traces empty | Expand Input channels and read the reason. Controller registers need the STM32U575 SVD and their RCC clock guard; firmware objects need the matching Debug ELF. Also check which inputs are enabled in Settings. |
| Target paused before initialization | Continue. USBX objects and endpoint pointers may not exist yet. A halted CPU also cannot enumerate or move bridge data. |
| Clock precondition fails | Check firmware startup and whether USB was intentionally stopped. The pack waits for OTGEN; do not force unrelated register writes just to populate a card. |
| Registers present, some software fields unavailable | Check the exact flashed ELF, DWARF member information and the expected USBX/application symbols. Null class or endpoint pointers can also be normal during initialization or disconnect. |
| 37 observed, Configured, flat traces | Observation is working. Send serial traffic if you want to see progress. Constant register values are expected in steady operation. |
| Configured but no data arrives | Confirm both serial ports and both data cables, then check DTR/RTS, endpoint direction, interrupt delivery and ring progress. Send to one port and receive from the other. |
| Domain refuses to install | Read the validation error, check that the download is a complete JSON file, and use a product build that includes Trace Domains. |
For format details, see the Trace Domain reference. For the broader debug workflow, see BKPT Debug getting started.