 DOCS/VIEWALYZER/GETTING STARTED
VIEWALYZER · GPUI EDITION
DOCS/VIEWALYZER/GETTING STARTED
VIEWALYZER · GPUI EDITION
Getting started
This page is the path from a firmware that records nothing to a recording on screen. Do the steps in order; each one has a way to check it worked before you move on.
- 1. Put the recorder in the firmware
- 2. Install and start ViewAlyzer
- 3. Describe the connection
- 4. Record
- 5. Open, save and share recordings
- 6. Give the app your ELF
- 7. Read your first recording
- 8. Snapshots: recording without a cable
- Troubleshooting
1. Put the recorder in the firmware
ViewAlyzer's recorder is a few C files you compile into your firmware. It has no library, package manager or build step of its own. There are three integration paths, and the choice is made by what your firmware runs on:
| YOUR FIRMWARE | RECORDER PATH | WHAT YOU GET WITHOUT WRITING TRACE CALLS |
|---|---|---|
| Bare metal (no RTOS) | core/ | ISR events and your own user traces and events |
| FreeRTOS | core/ + the FreeRTOS adapter | Task switches, task creation, notifications, queues, semaphores, mutexes, timers, stack usage |
| Zephyr | the Zephyr module | The same kernel objects through Zephyr's tracing hooks, plus k_work |
The recorder sources and the per-path READMEs live in the ViewAlyzerRecorder directory of the ViewAlyzer repository. The integration in one sentence: compile the recorder's .c files into your firmware, add its two include paths, set a handful of defines (VA_ENABLED, the RTOS selection, the transport), and call VA_Init(cpu_freq) once at startup with the real CPU clock.
Pick a transport
The transport is how trace bytes leave the chip. Set it with the VA_TRANSPORT define (Zephyr: Kconfig) and remember which one you chose, because the app must be told the same thing in step 3.
| TRANSPORT | USE IT WHEN | NOTES |
|---|---|---|
| RAM buffer (recommended) | You have any debug probe, including the ST-LINK built into every Nucleo / Discovery board | The recorder writes a ring in target RAM and the host drains it through plain memory reads. No extra pins, no SEGGER sources, best sustained throughput in practice, and it enables post-mortem snapshots (step 8). |
| ITM / SWO | Your board routes the SWO pin to the probe | Classic ARM trace. Not available on Cortex-M0/M0+/M23 (no ITM). Needs the SWO frequency to match on both sides. |
| SEGGER RTT | The board's probe runs J-Link firmware | Works over ST-LINK too through the app's native driver. Give the recorder its own RTT channel with a large buffer. |
| UDP / serial | Desktop or simulation builds, or a firmware with its own link | The recorder emits bytes through a callback you provide. |
Or start from a working example
The ViewAlyzer-Examples repository has complete, buildable projects for Zephyr, FreeRTOS and bare metal on common Nucleo boards, each with a build.py that builds and flashes, and each shipping the .vacf connection config that matches it. If you own one of those boards, flashing an example is the quickest way to see a real recording before touching your own code. Every example is also a reference to diff your own project against; the repository's AI_INTEGRATION.md is the one-page integration recipe.
Check: the firmware builds and runs with the recorder enabled. Keep the matching ELF for the capture; default RAM-buffer recording requires it.
2. Install and start ViewAlyzer
ViewAlyzer is a single executable on Windows, macOS and Linux. If you were given a package, install it and start it. To build it from source you need a Rust toolchain and, on Windows, the Microsoft C++ Build Tools; then run python build_app.py build in the ViewAlyzer-RS checkout and start target/debug/viewalyzer (viewalyzer.exe on Windows). The README in that checkout has the per-platform build notes.
Probe access
- Windows: ST-LINK needs the ST-LINK USB driver from ST (or WinUSB); J-Link needs the SEGGER J-Link software. Both are the normal vendor installs you already have if the board's IDE works.
- Linux: add the udev rules for your probe so it is accessible without root (ST and SEGGER both publish rule files; probe-rs documents a combined set). Replug the probe after installing them.
- macOS: nothing to install; the probe is a plain USB device.
The app stores its settings, recordings and installed domains in a per-user folder:
| OS | FOLDER |
|---|---|
| Windows | %APPDATA%\ViewAlyzer-GPUI\ |
| macOS | ~/Library/Application Support/ViewAlyzer-GPUI/ |
| Linux | $XDG_CONFIG_HOME/ViewAlyzer-GPUI/ (default ~/.config/ViewAlyzer-GPUI/) |
Recordings you make land in recordings/ under that folder until you save them somewhere else.
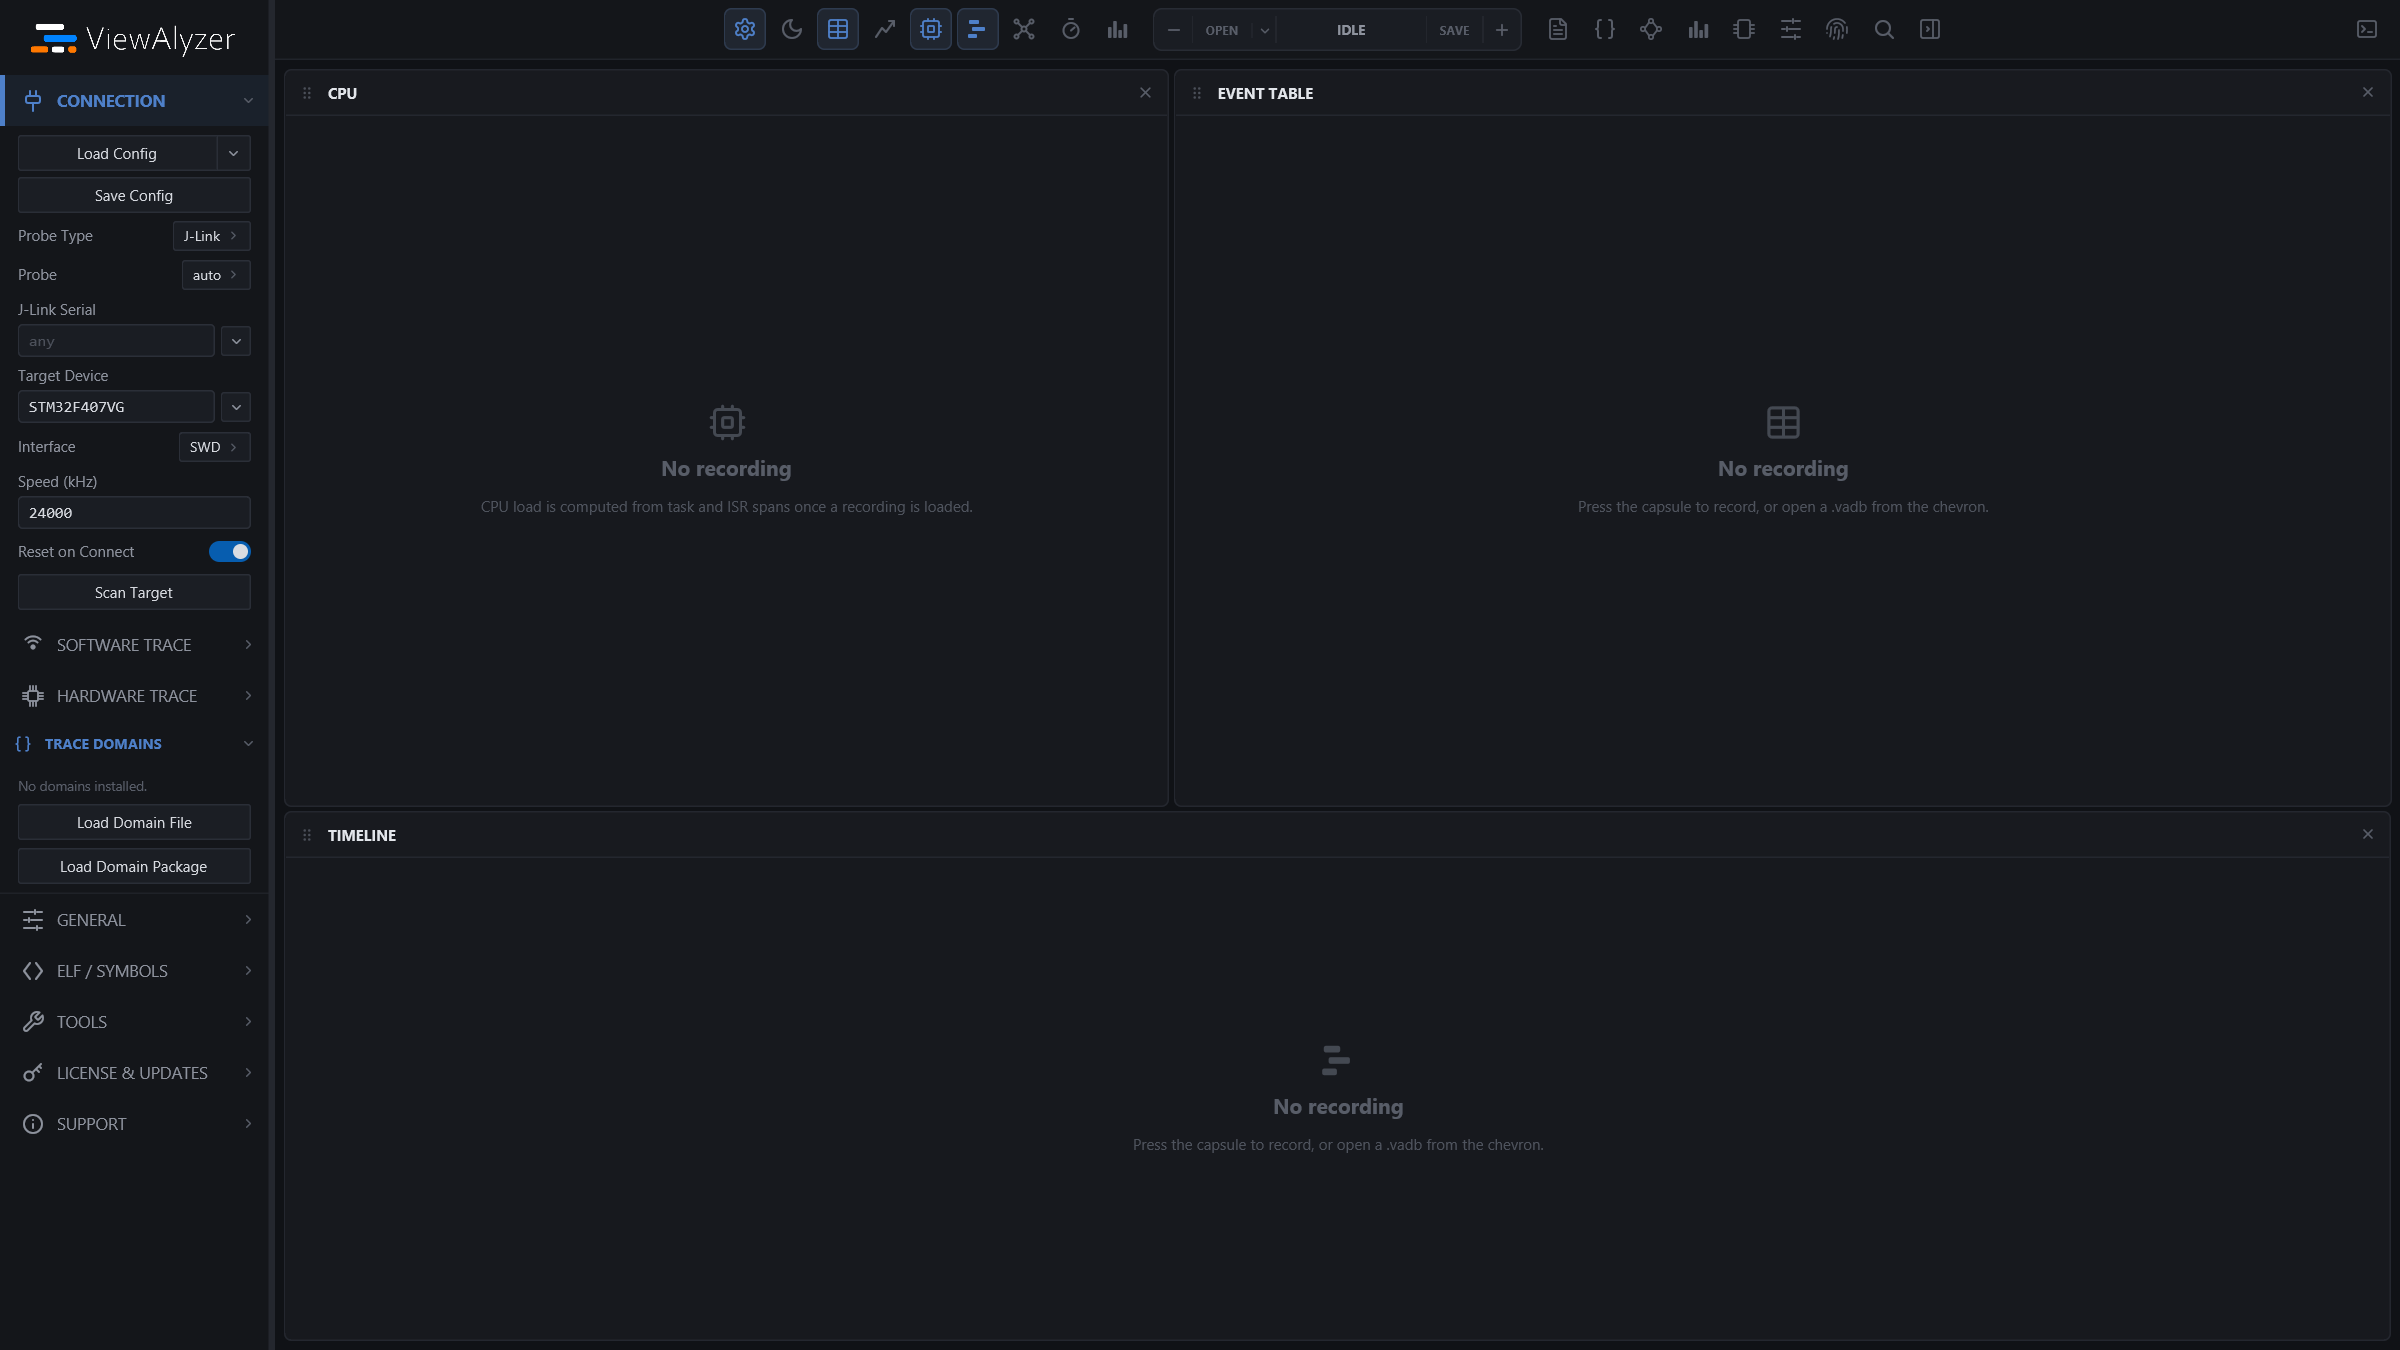
Check: the window opens with the sidebar on the left, the row of view cards across the top, and a capsule in the middle with a red REC button.
3. Describe the connection
Everything the app needs to reach the target lives in the sidebar. The two sections for a first capture are Connection and Software Trace. For default RAM-buffer capture, also select the matching firmware under ELF / Symbols > ELF File before pressing Record. See RAM metadata attachment.
Connection
| FIELD | WHAT TO ENTER |
|---|---|
| Probe Type | ST-Link, J-Link, UDP or Serial. The fields below change to match. |
| Probe | auto picks the only probe of that kind. With several attached, pick the serial in ST-Link Serial / J-Link Serial: the chevron beside the field lists the probes found on USB, with Rescan after a replug (the app refuses to guess between two). |
| Target Device | The chip's name as the probe driver knows it, for example STM32G474RE. viewalyzer-cli targets --filter STM32G4 lists valid names. |
| Interface, Speed (kHz) | SWD at 4000 kHz is a safe start. |
| Reset on Connect | On: the target is reset after attach and the recording starts from boot. Off: attach to the running firmware and record from now (a hot attach). |
| UDP Listen IP / Port, Serial Port / Baud Rate | For the network and serial transports. |
Software Trace
| FIELD | WHAT TO ENTER |
|---|---|
| ViewAlyzer Trace | On. This is the firmware-side recorder. |
| Trace Source | Must match the firmware's VA_TRANSPORT: RAM Buffer, RTT or SWO (ITM). Non-ARM targets offer RAM Buffer and RTT. |
| RAM Buffer Address / Scan Start / Scan Size | Default RAM metadata capture uses the matching ELF to locate recorder memory. With VA_METADATA=0, use a ring address or leave it empty to scan the specified RAM window. |
| RTT Up Channel / RTT Address | The channel the recorder writes to, and optionally the address of _SEGGER_RTT to skip the search. |
| Trace Clock (MHz), SWO Freq (kHz), ITM Port | SWO only. The trace clock drives the TPIU prescaler and ITM timestamp decoder; both clock and SWO frequency must match the target. RAM Buffer and RTT carry the recorder timestamp frequency in-band, so these fields stay hidden for them. |
| COBS Framing | For UDP / serial senders that frame packets with COBS. |
PC sampling and hardware trace are configured by BKPT Debug, not by the standalone ViewAlyzer capture controls. Open the resulting .vadb here when you want to profile or analyze those events.
Save the connection
Save Config writes all of this to a .vacf file; Load Config reads one back. Commit one per board next to your firmware, and nobody re-enters probe settings again. The same file drives the command line (viewalyzer-cli capture --config board.vacf ...), and the example projects ship theirs.
Check: with the probe plugged in and the board powered, the capsule turns to LINK for a moment when you start a capture in the next step, not straight back to REC with an error toast.
4. Record
The capsule in the middle of the top bar is the record button:

- Click REC to start. It shows LINK while the probe attaches, then REC 00:12 counting up with the data rate. Click again to stop; SAVING appears while the file is finalised, then every view fills in.
- - and + set a timed capture in 30-second steps (the centre shows the duration,
REC 01:30). At plainRECthe capture runs until you stop it. - The card icons around the capsule open and close the views; the capsule's hover text names the card under the pointer.
While recording, the Trace panel is live; the other views show "Recording" and fill in when the capture stops.
Everything the app does during a session (attach, ring found, losses, warnings) goes to the log sidebar, opened with the panel icon at the far right of the top bar. When something looks wrong, read the log first.
Check: after stopping, the Event Table shows events and the Timeline shows task or ISR lanes. If the file was written but holds no events, see Troubleshooting: a successful attach with zero events is the most common first-run problem, and always has a specific cause.
5. Open, save and share recordings
- OPEN on the capsule opens a recording from disk; the chevron beside it lists the recordings you opened or saved most recently. Open Recording at the top of the sidebar's Software Trace section is the same control in a more visible place.
viewalyzer <file.vadb>on the command line opens one at startup. - SAVE writes the current recording to a location of your choice. It lights up blue when the recording in memory has not been saved yet.
- A recording is a single
.vadbfile (SQLite inside). It carries the raw capture, the decoded events, and derived tables (task stats, timers, communication paths), so it is self-contained: send the file to a colleague and they see exactly what you see, including anything you derived in Trace Tune and saved into it. - Recordings made by the app and by
viewalyzer-clishare the samerecordings/folder and index (viewalyzer-cli recordingslists them).
6. Give the app your ELF
Several views need to know the firmware's symbols, and all of them read the same file: ELF / Symbols > ELF File in the sidebar (the button beside the field browses for it, the chevron lists recent ELFs). Set it once per project and it persists. Load Config has the same chevron for recent .vacf files.
Default RAM metadata capture requires this ELF before recording. It also enables:
- Symbols: browse variables and mark them for polling over the debug port, with no firmware change.
- Memory: flash and RAM usage of the build, section by section.
- Timers: k_work handlers named by symbol instead of address.
- Overview: the memory summary section.
A stale ELF (from a different build than the one on the board) resolves symbols to the wrong addresses. Rebuild both together, or keep the ELF next to the firmware image it belongs to.
7. Read your first recording
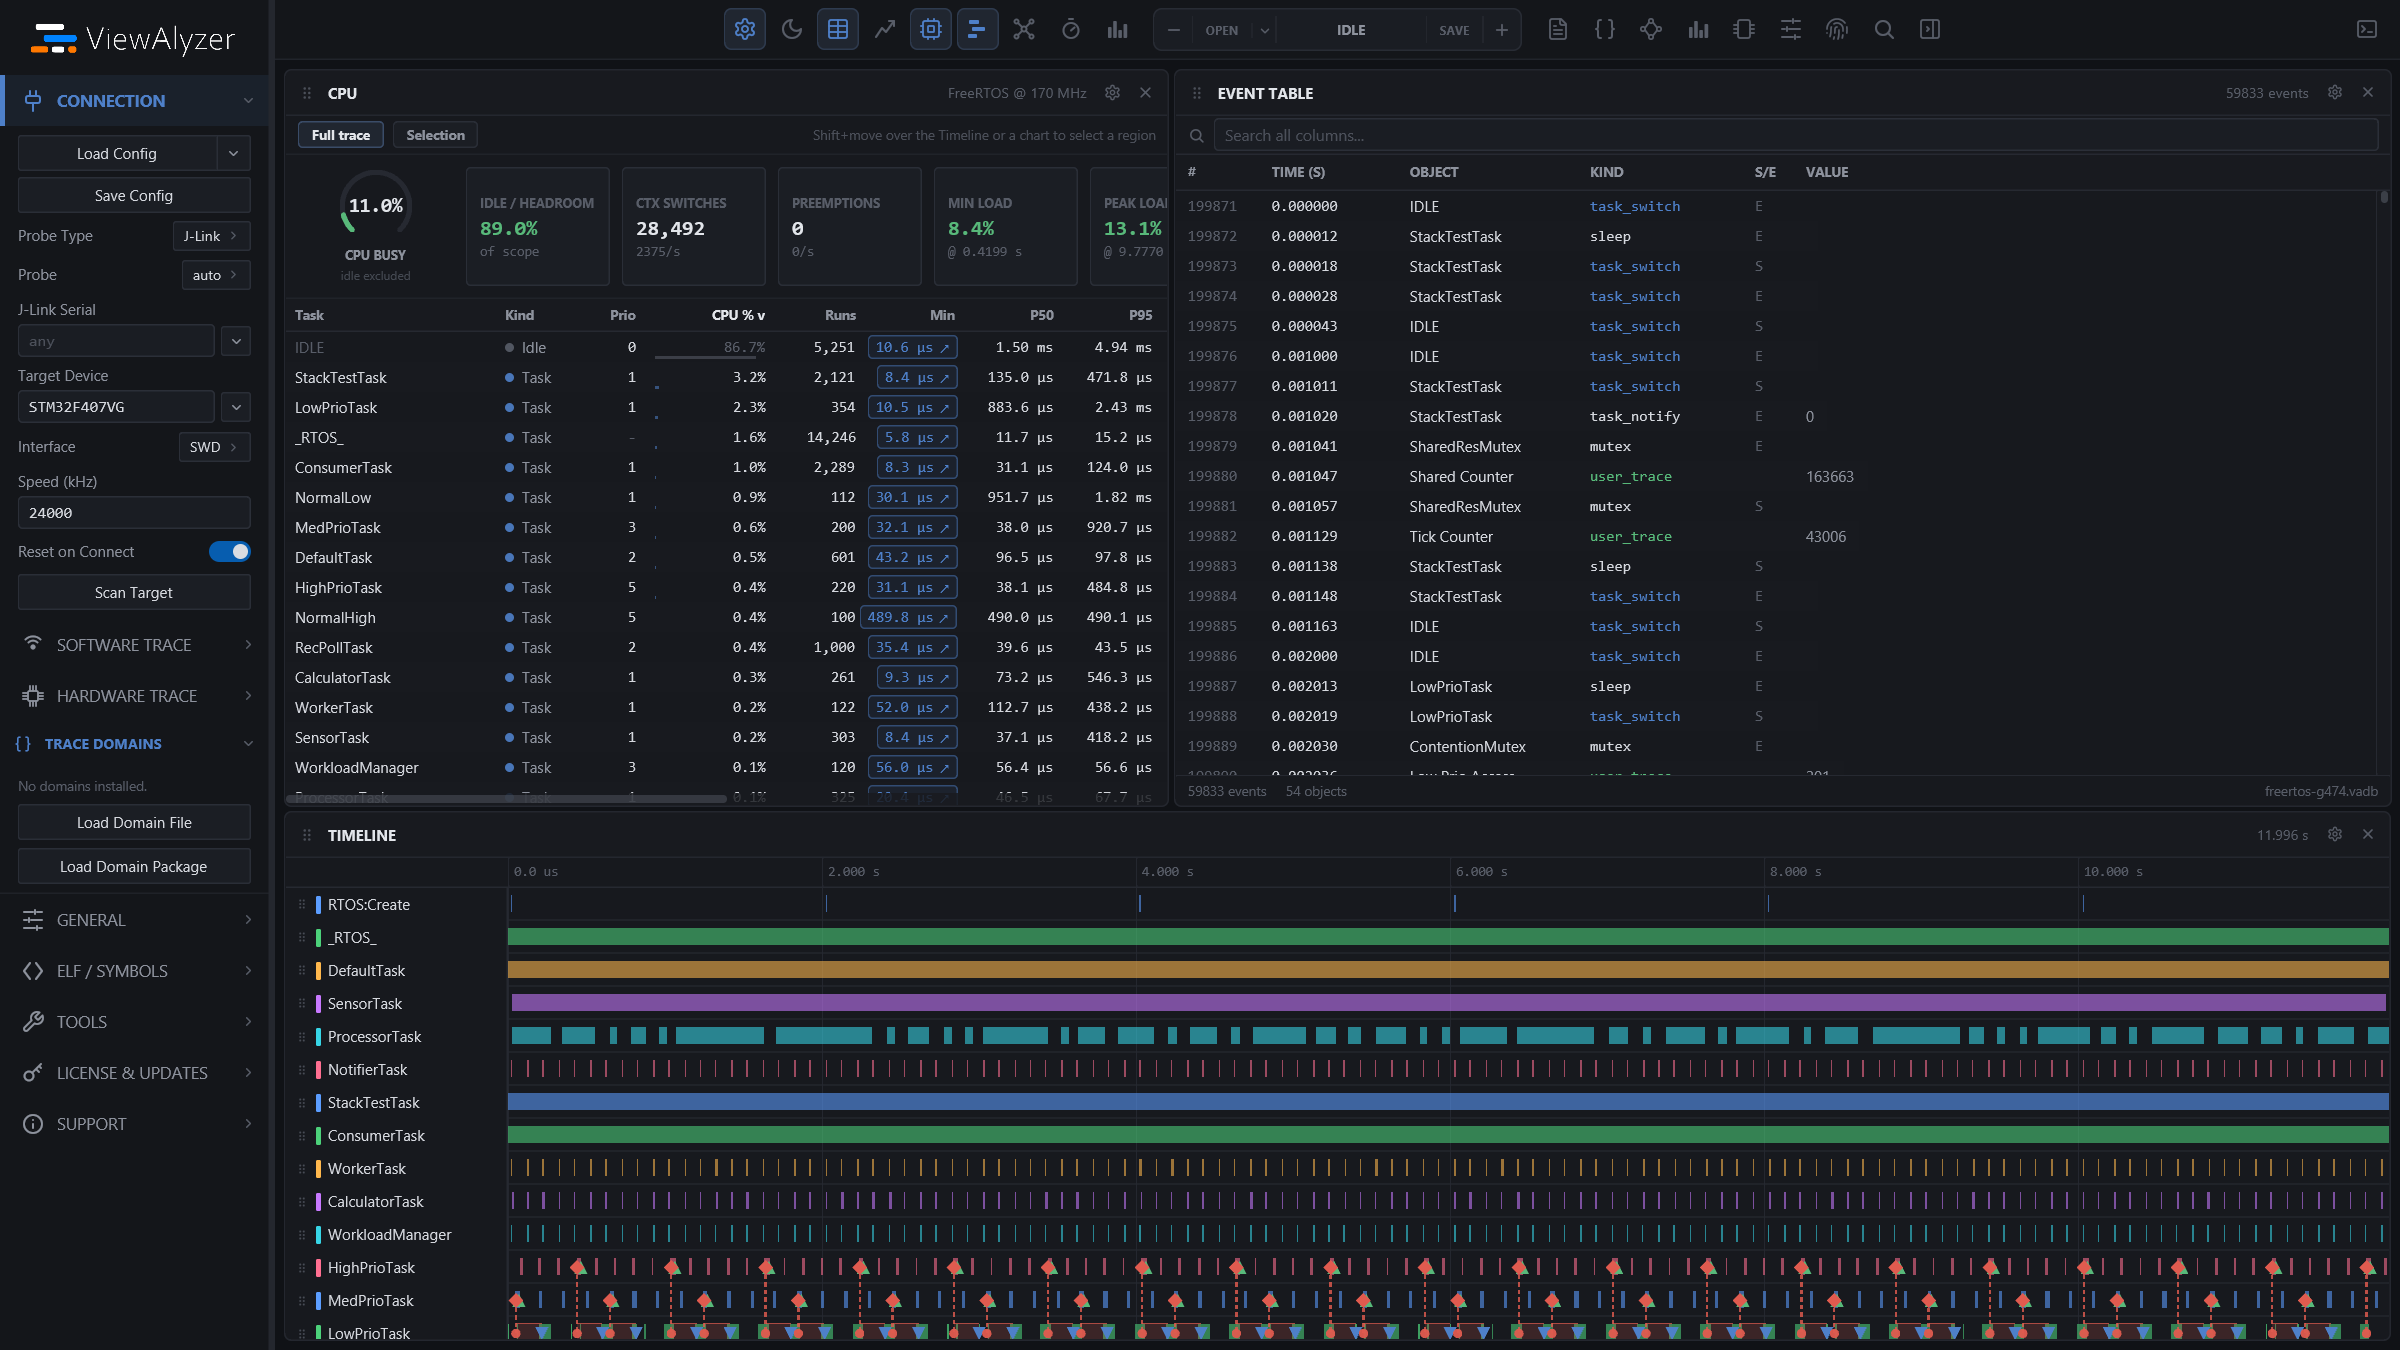
The first-run layout puts CPU and the Event Table above the Timeline. A good first pass through a fresh recording:
- Overview for the headline numbers: duration, event count, CPU load, tasks, stack headroom. Its Copy button puts the whole report on the clipboard as Markdown, which makes a good first line in a bug report.
- Timeline to see the shape of the run. Zoom with Ctrl+wheel (Cmd on macOS), drag to pan, hover to move the cursor. Click a slice: the Details panel describes that task instance.
- Analyzer for what the app already found: priority inversions, jitter outliers, failed kernel operations. Click a finding and the Timeline jumps there.
- Trace for your own channels, Timers and Comms for kernel timers and message paths.
The views share one time model: one zoom window, one hover cursor, one pinned cursor and one selected region, described in The workspace. Zooming the Timeline zooms the charts; pinning the cursor in a chart selects the row in the Event Table.
8. Snapshots: recording without a cable
With the RAM buffer transport the recorder keeps the most recent trace window in the ring at all times. Take Snapshot (Software Trace section) reads that ring out through the probe without resetting the target, so a board that ran unattended for an hour still gives you the seconds before it stopped. Firmware can freeze the ring from a fault handler (VA_SnapshotFreeze()), which keeps the moment of the crash intact until you get to the board. The snapshot opens as a recording like any other.
Troubleshooting
The capsule goes LINK then back to REC with an error. The probe could not attach. Check the log sidebar: a wrong Target Device name, a probe in use by another program (an IDE debug session, ST-LINK server), or a missing driver / udev rule are the usual causes. viewalyzer-cli probes lists what the app can see.
The recording has zero events. The attach worked but no trace bytes arrived. In order of likelihood:
- Trace Source does not match the firmware's
VA_TRANSPORT. - The recorder is compiled out (
VA_ENABLEDnot set) orVA_Init()is never reached. On FreeRTOS the recorder's defines must be visible to the kernel sources too, not just to your application files. - RAM buffer: the ring was not found. Give RAM Buffer Address the address of
_VA_RAMBUFfrom the map file, or widen the scan window. - SWO: SWO Freq (kHz) or Trace Clock (MHz) differ from the target.
- The target is halted (a breakpoint left by a debugger survives sessions). Power-cycle the board.
- For default RAM metadata capture, select the matching ELF and keep firmware service (
VA_TickOverflowCheck()) running during idle periods. Check the log for metadata overflow or checkpoint timeout. With metadata disabled, allow the setup retransmission interval (2 s by default).
Events arrive but timestamps look wrong. On SWO, Trace Clock (MHz) is wrong. On RAM Buffer or RTT, the recorder's timestamp source or reported tick frequency is wrong (the recorder reports ERR:TS_DEAD in the log when the source is not running).
Losses reported in the log. The transport cannot keep up. Trace less (the recorder's selective tracing defines), lower the rate of user traces, or on RTT give the recorder its own channel with a bigger buffer.
The Symbols / Memory views say "No ELF loaded". Step 6.
A view says "No recording" while the capsule reads REC. Expected: only the Trace view streams live. Stop the capture and the view fills in.