 DOCS/VIEWALYZER/CPU
VIEWALYZER · GPUI EDITION
DOCS/VIEWALYZER/CPU
VIEWALYZER · GPUI EDITION
VIEWALYZER · VIEWS
CPU
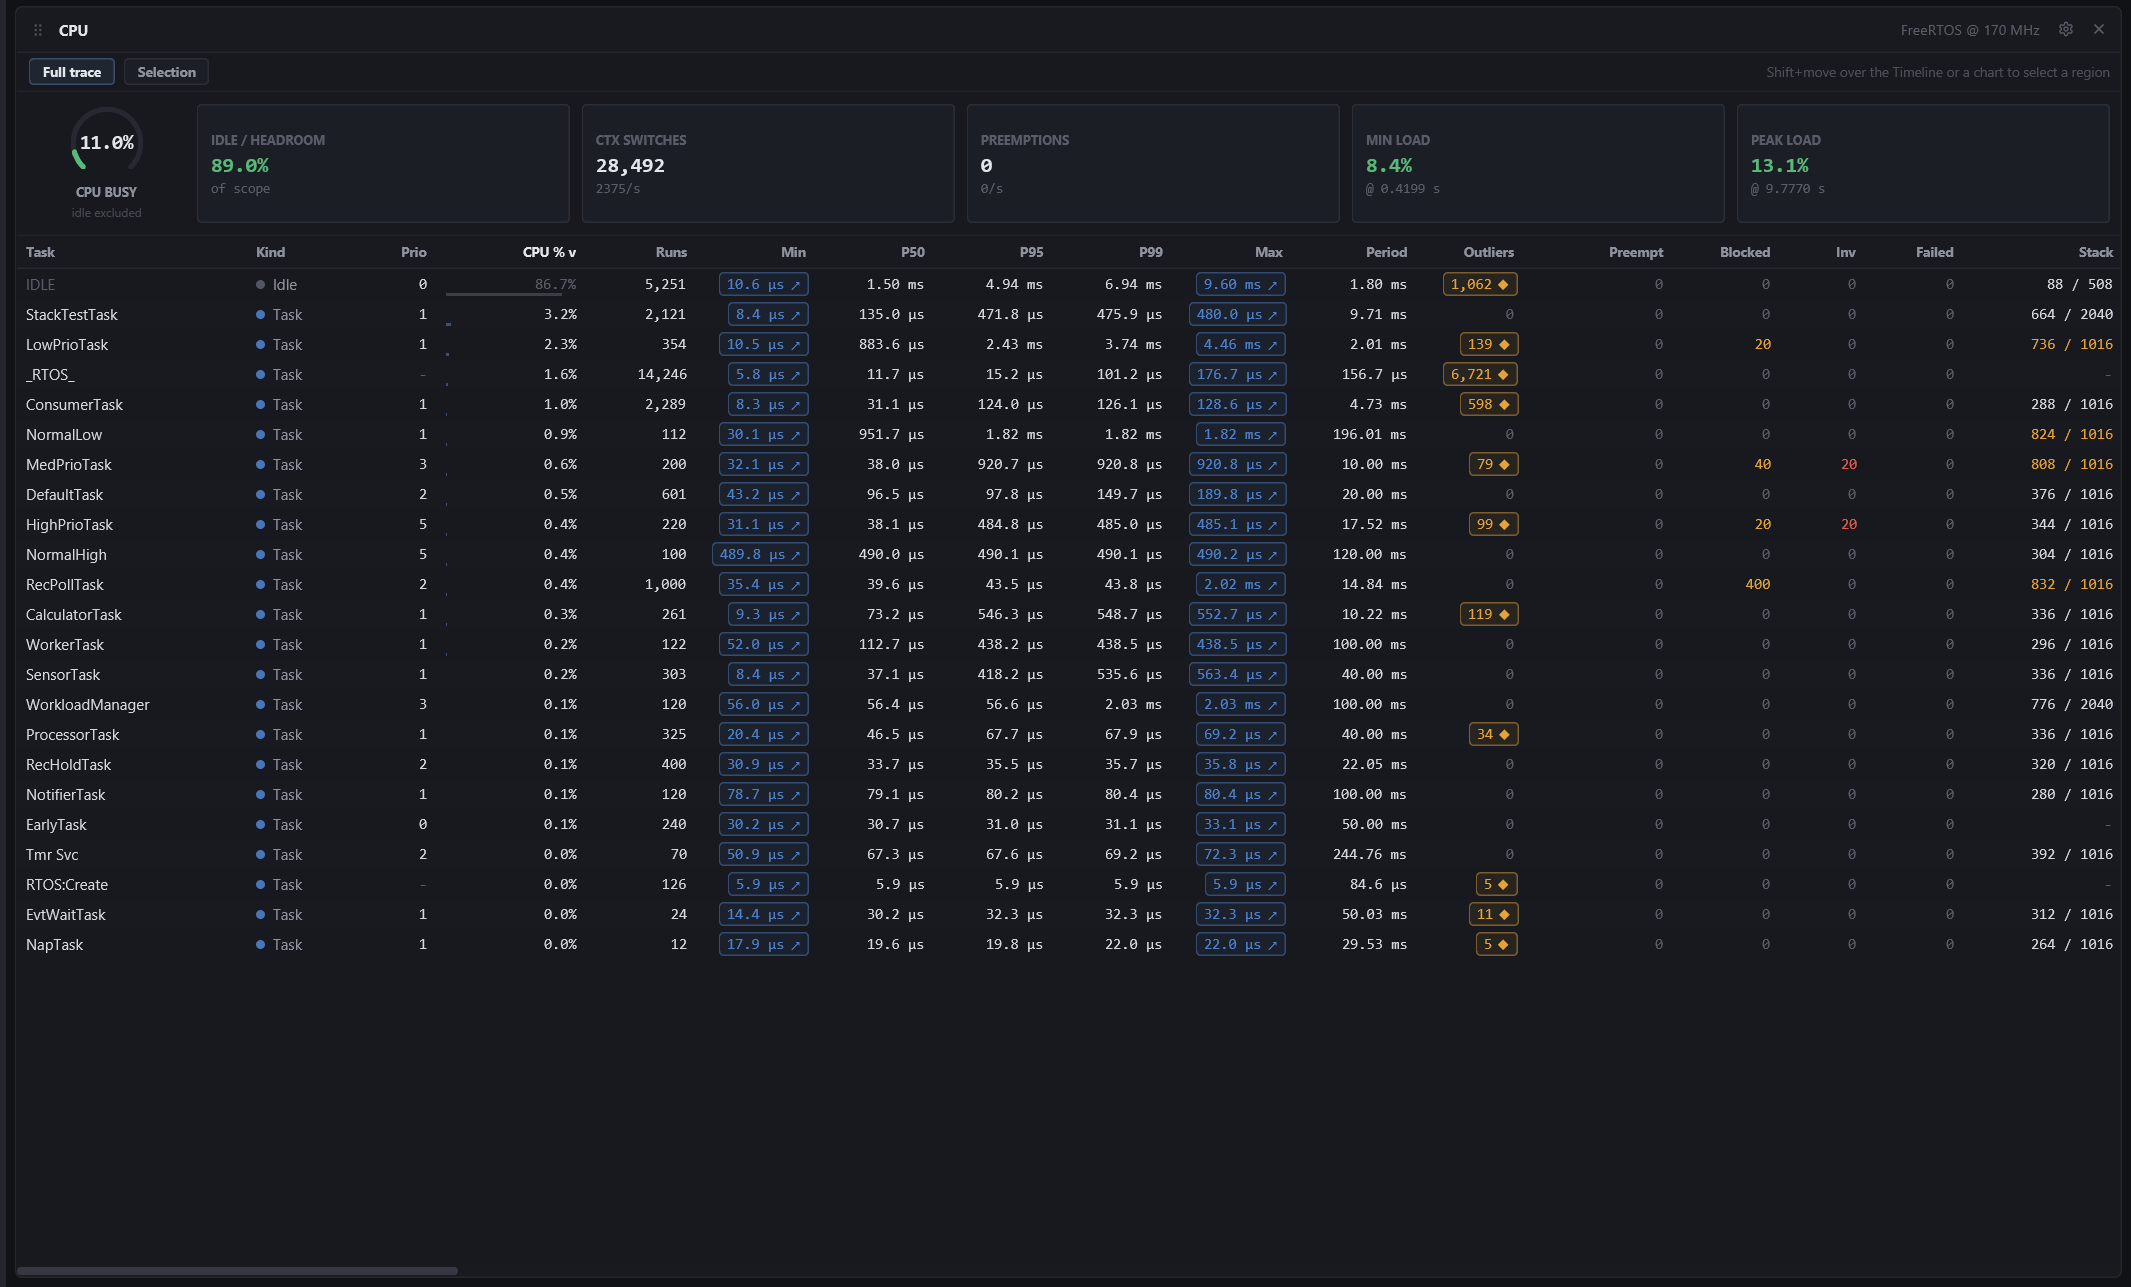
The CPU and scheduler workbench: how busy the processor is, who uses it, and how each task behaves, over the whole recording or over a region you select.
Needs: a recording (fills in when a capture stops).
Scope
The toolbar's Full trace / Selection pills choose the window the numbers describe. Sweep a region with Shift+move over the Timeline or a chart, then press Selection: every figure below recomputes for just that region, and the hint on the right names it. The Analyzer shares the scope and says so in its header.
The strip
- A dial with the CPU busy percentage (idle time excluded).
- Idle / headroom, context switches and preemptions with their rates per second.
- Min load and peak load: the quietest and busiest 500 ms window, each with its time. Click a tile to jump the Timeline there.
The table
One row per task and interrupt (idle tasks in grey, interrupts marked red):
| COLUMN | MEANING |
|---|---|
| CPU % | Share of the scope, with a bar |
| Runs | Number of slices |
| P50 / P95 / P99 / Max | Slice duration percentiles |
| Period | Median activation period (blank when the task is not periodic) |
| Outliers | Activations far off the median period |
| Preempt | Times the task was preempted, and the time lost to it |
| Blocked | Times it blocked on a kernel object |
| Inv | Priority inversions it took part in |
| Failed | Kernel operations that failed (timeouts, full queues) |
| Stack | Used / size, amber above 70 %, red above 85 % |
Click a header to sort. The gear in the tile header hides columns. Double-click a row to filter the Event Table to that task's raw events.
Tips
- The CPU % column is exact within the scope: it is the union of the task's slices divided by the scope length, not a sampled estimate.
- A task with a Period but a large P99 or many Outliers is the first thing to look at in the Timeline; the Analyzer lists those activations as jitter findings you can click.