 DOCS/VIEWALYZER/TRACE
VIEWALYZER · GPUI EDITION
DOCS/VIEWALYZER/TRACE
VIEWALYZER · GPUI EDITION
Trace
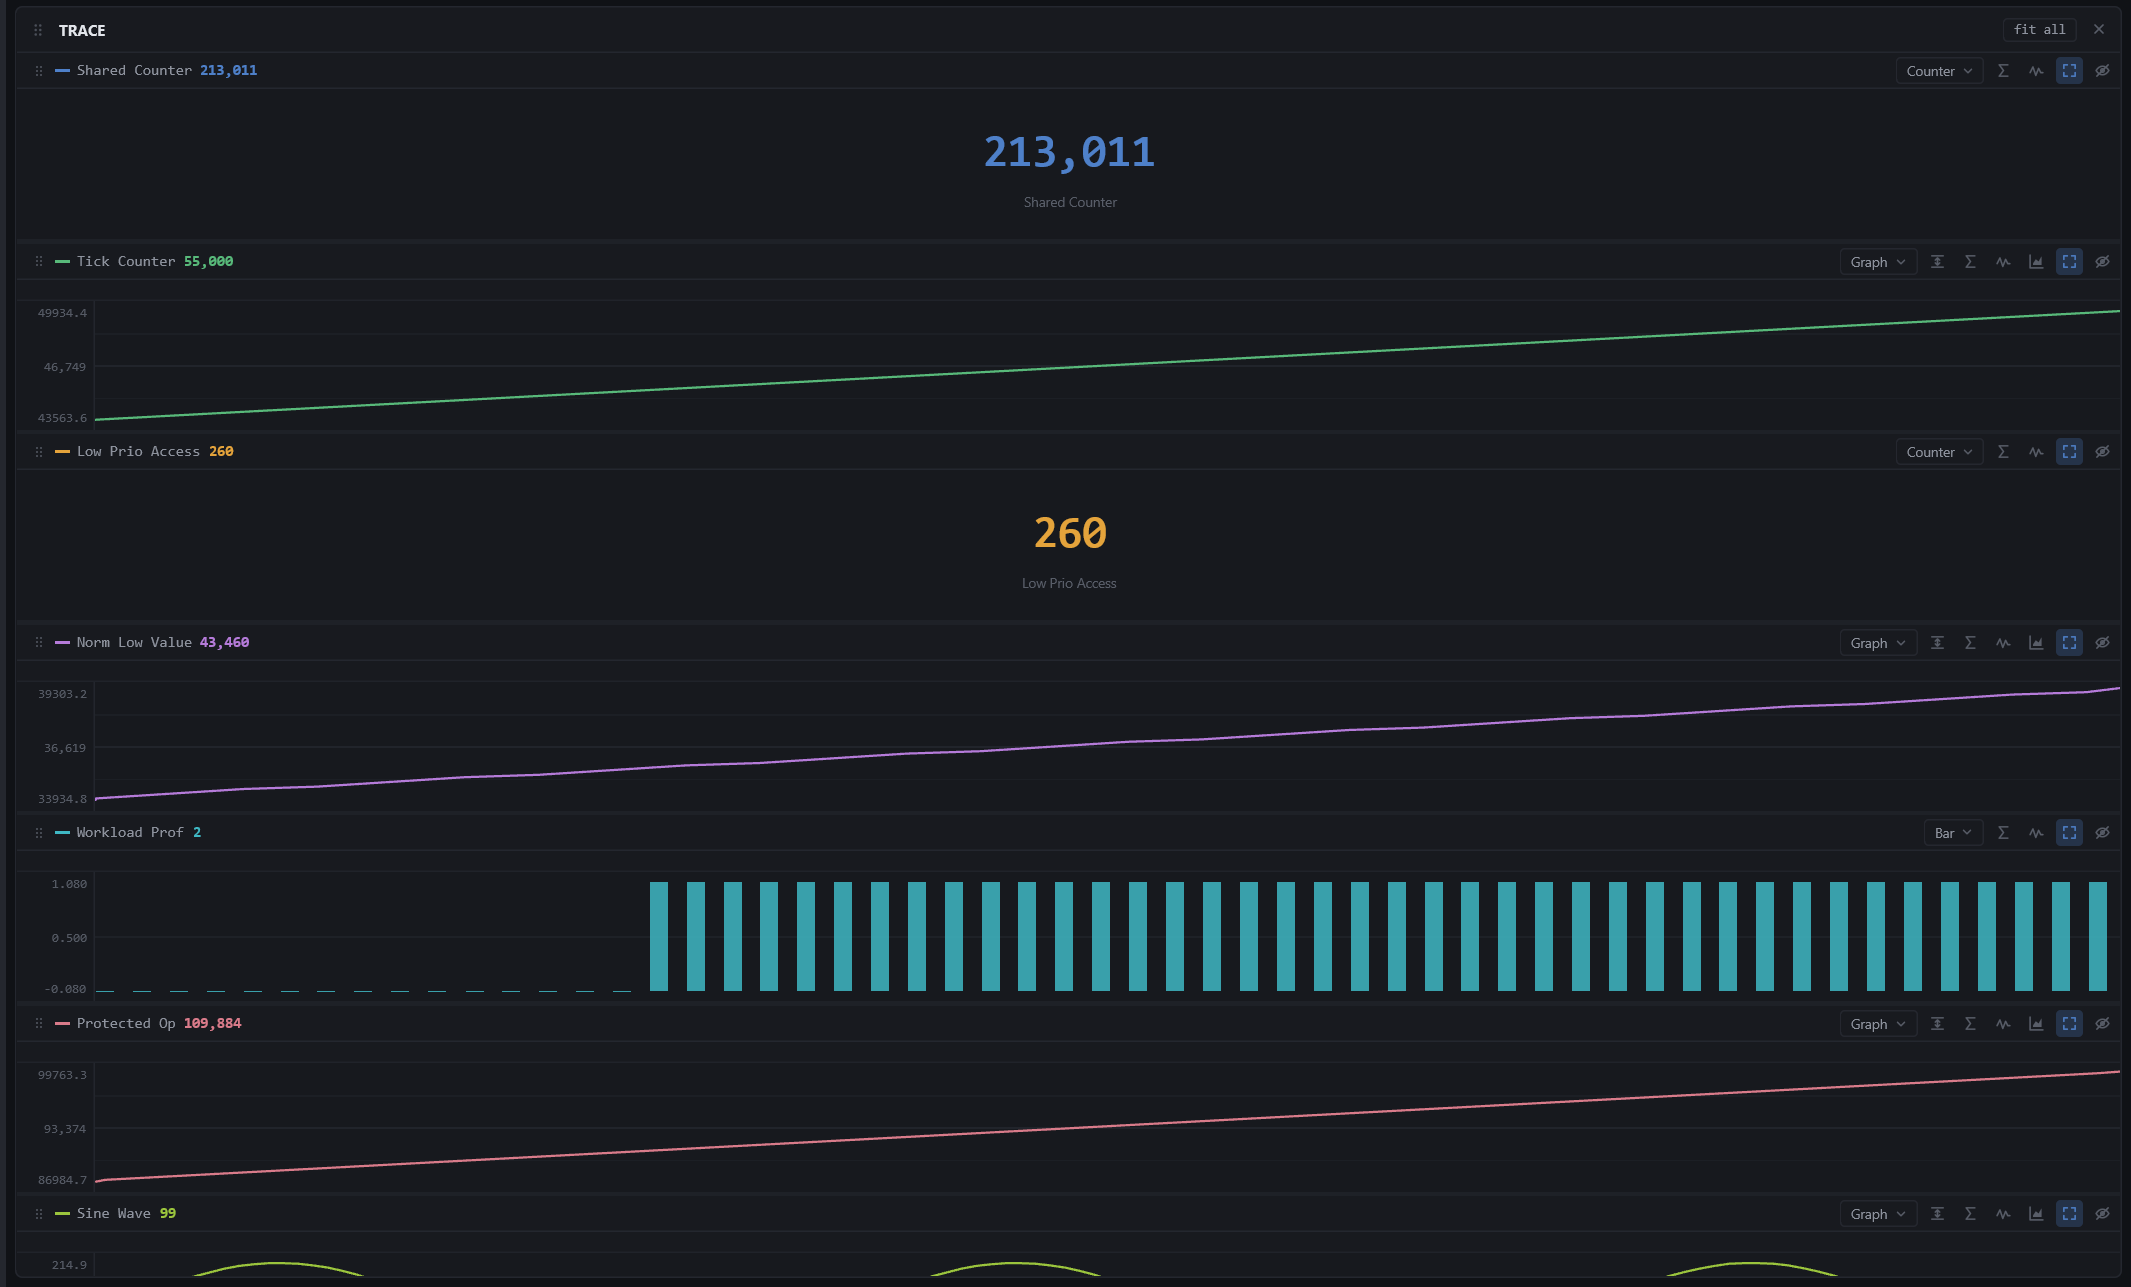
Your firmware's own channels, drawn as charts: values you log with VA_LogUserTrace, GPIO states, heap gauges, counters, symbols you poll from the Symbols view, channels a Trace Domain declares, and anything you derive in Trace Tune. This is the one view that streams while recording.
Needs: a recording with trace channels, or a live capture.
Charts
Each trace gets a chart with its own control bar and Y axis. The bar holds, left to right:
| CONTROL | WHAT IT DOES |
|---|---|
| Grip | Drag the chart onto another chart's left / right / top / bottom band to split the area and dock it there; drop it on the centre to overlay it on that chart (overlaid traces share the Y scale, and a click on a trace's chip makes the axis follow that trace) |
| Name and value | The trace name and the value at the cursor |
| Normalise | Scale overlaid traces to a common range |
| Statistics | Last, min, max, mean and RMS of the visible window, with reference lines |
| Step / linear | Interpolation between samples. The firmware's registration can set the default |
| Gradient | Area fill under the line, or the line alone |
| Fit Y | Fit the Y axis to the data in view |
| Hide | Hides the chart; it becomes a chip in the row under the charts, and comes back on click |
Dividers between charts resize them.
Display types
The firmware declares a display hint when it registers a trace, and the chart follows it: graph (line), bar, gauge (dial), counter (big number), table, histogram, toggle (on / off state), register (bit field) and angle. All of them read the same samples; only the drawing differs.
Time
- Ctrl+wheel (Cmd on macOS) zooms around the pointer, Shift+wheel or a horizontal wheel pans, dragging pans; the window is shared with the Timeline.
- Hovering moves the shared cursor and shows the value at the cursor on each chart; a click pins it when Sticky Cursor is on; Shift+move sweeps the selected region.
- Below the bottom-most charts a time axis labels the window; a chip on it follows the cursor.
- When the window holds more samples than there are pixel columns, a chart draws the min / max envelope per column instead of every point, so nothing is hidden by decimation.
Live
While recording, the window's right edge glides on the wall clock and the charts fill from the right, keeping the recent history on screen; zooming in still works. When the capture stops, the charts switch to the finished recording, which holds the whole session.
Tips
- Polled symbols and Trace Tune outputs appear here as ordinary channels: you can overlay a filtered signal on its raw input to judge the filter.
- Overlay a task's slices with a trace by tiling the Timeline next to the Trace panel; both follow the same window and cursor.