 DOCS/BKPT DEBUG/ETM EXECUTION HISTORY
BKPT DEBUG · VS CODE
DOCS/BKPT DEBUG/ETM EXECUTION HISTORY
BKPT DEBUG · VS CODE
ETM execution history
ETM records execution information in the processor's trace hardware. On a supported target, BKPT Debug saves the recent path when you pause, hit a breakpoint, or catch a fault. You can then explore calls and executed instructions leading up to that stop.
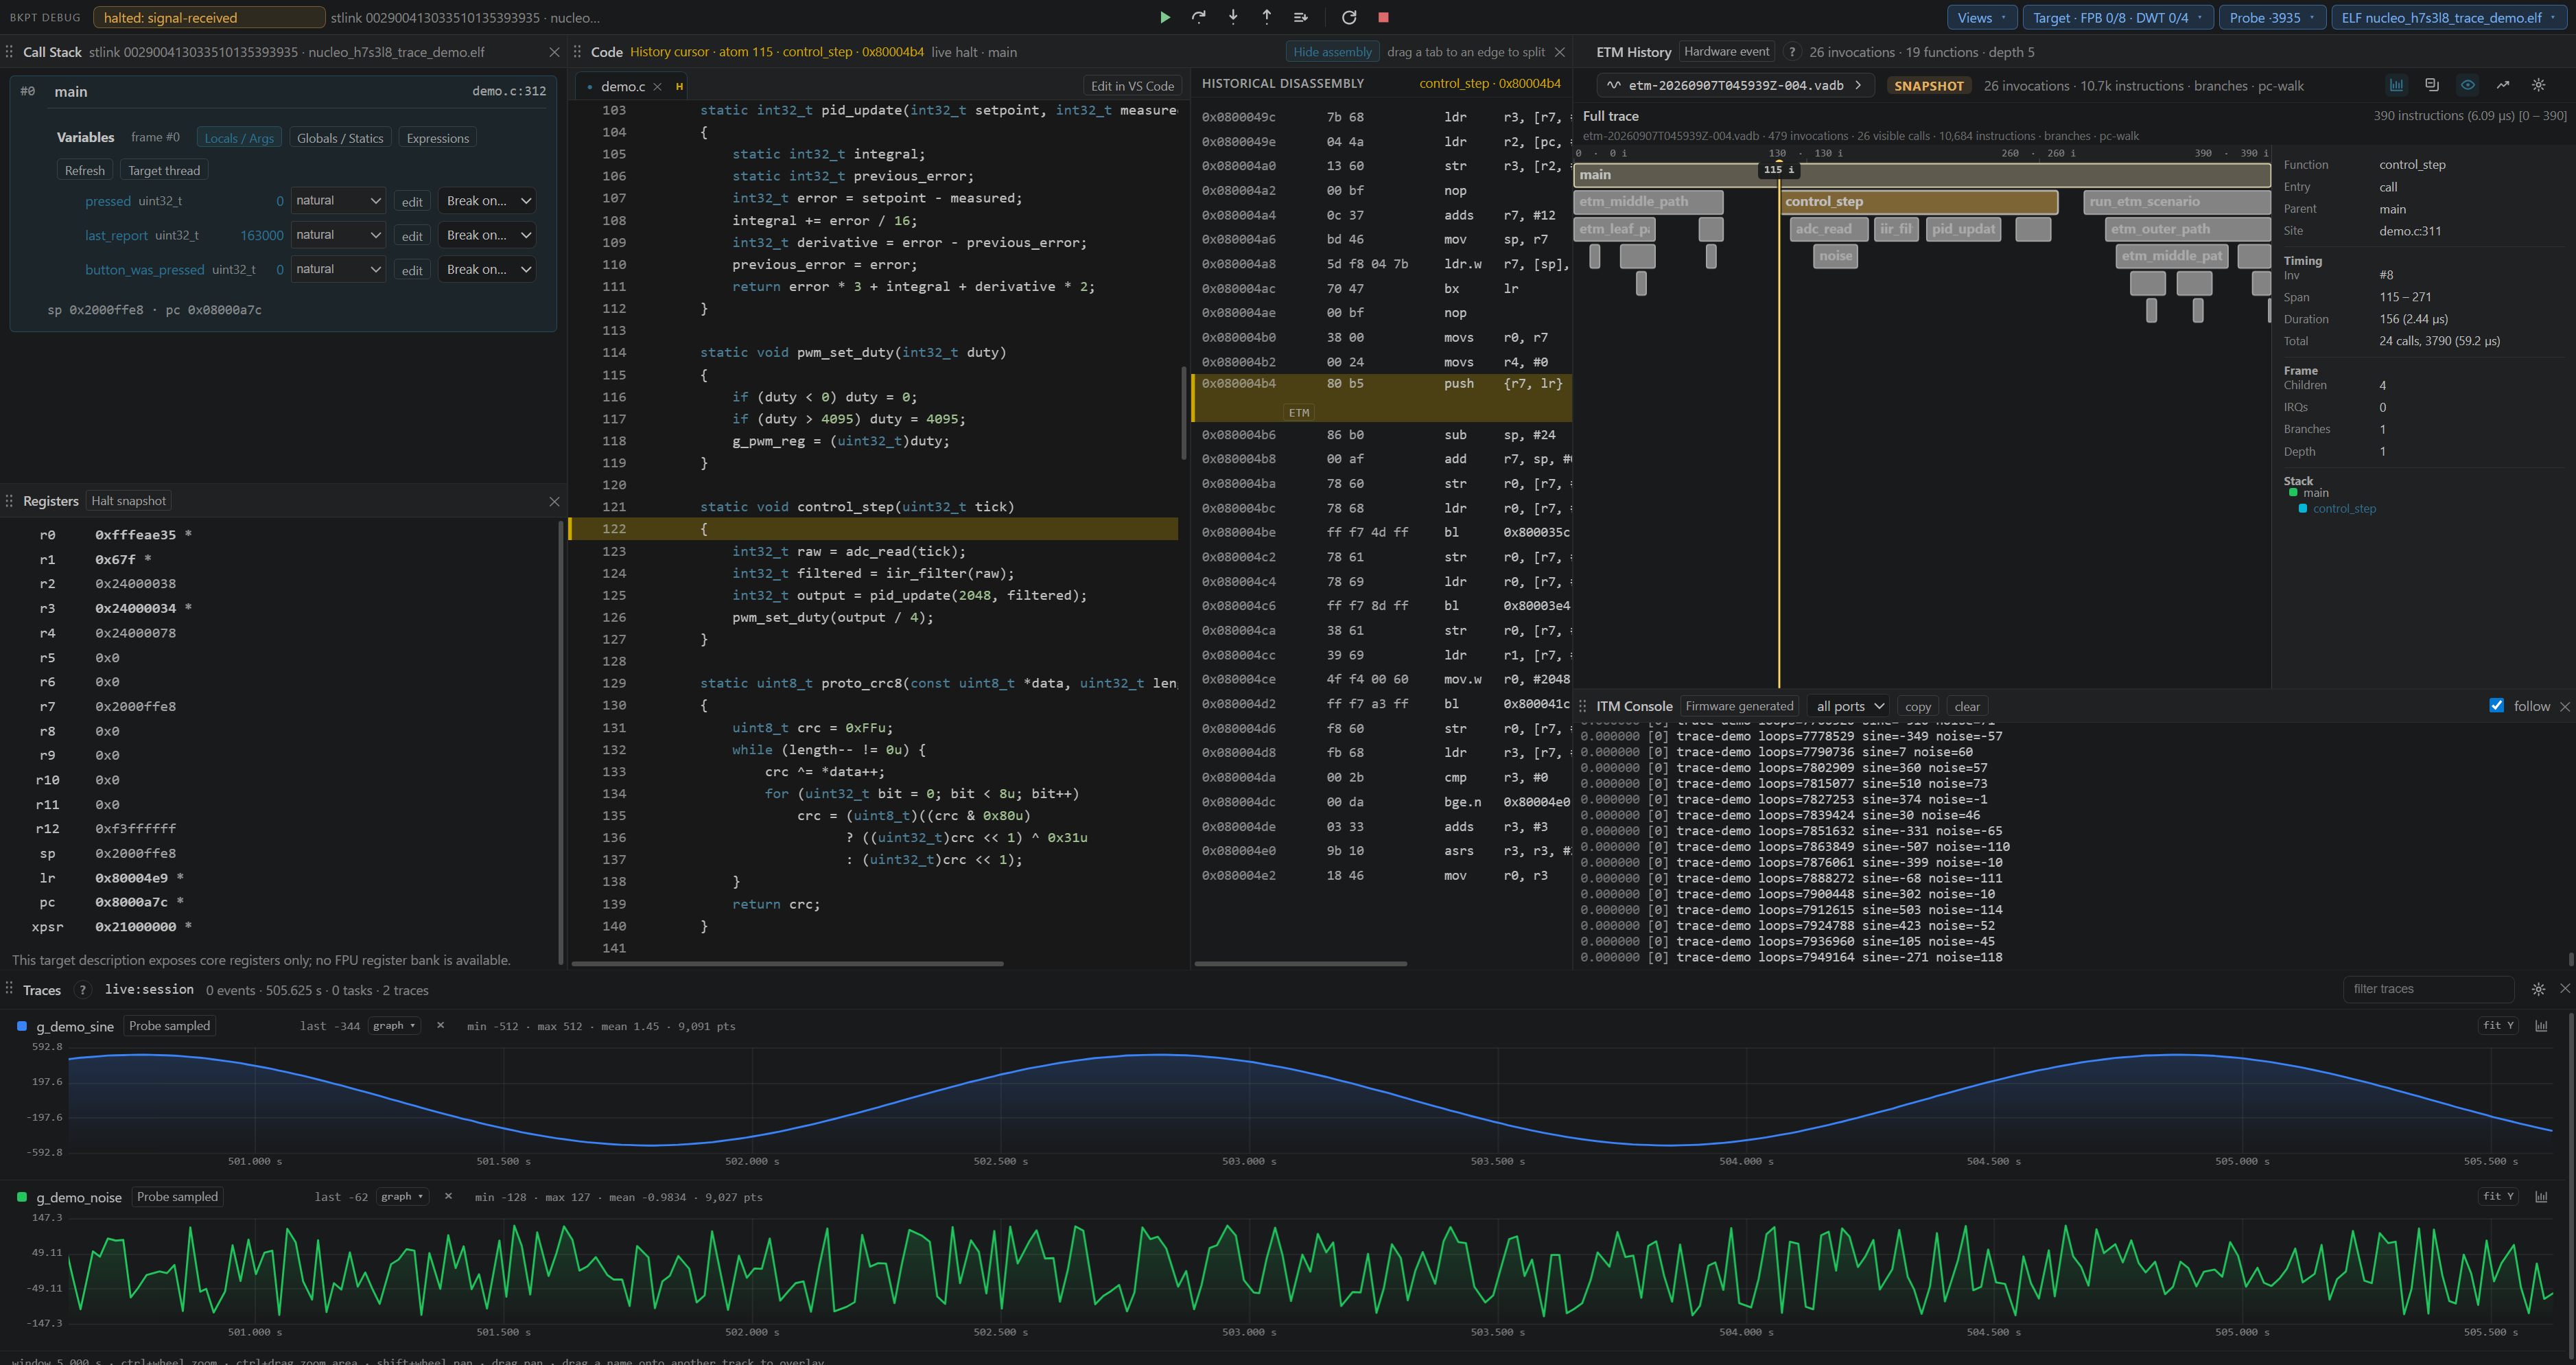
Note: this is execution history, not reverse execution. Moving the history cursor does not run the CPU backward, move its live PC, or recover old variable, register, or memory values.
What you need
- A target with a supported ETM instruction source, trace sink, and route between them. Having a Cortex-M7 or an SWO pin alone is insufficient; run Target → Scan and read the discovered capabilities.
- A supported, connected probe and a normal debug session. The fixed-buffer example here uses a NUCLEO-H7S3L8, its local ST-Link, and the on-chip ETF. The probe reads this buffer over the debug connection.
- The exact ELF for the firmware on the board. Keep its debug information and matching source files for function names and source navigation. The decoder also needs the executable code bytes to reconstruct instructions.
- For a programmable ETR sink only: a deliberately reserved, correctly aligned RAM buffer accepted by the target's displayed storage policy.
You do not need ITM print calls or a ViewAlyzer recorder to get this ETM history. ITM & DWT → Capture mode and ETM setup → On are separate controls. You can use ETM while the ITM/DWT capture mode is Off. Conversely, enabling ITM does not arm ETM. The demonstration also enables ITM port 0 for firmware prints and ordinary probe watches for the two graphs.
Capture your first history
- Program the board with your firmware, open its project, and select the matching Probe and ELF. Set the real Core clock in Target.
- Run Target → Scan for the connected target. Choose Attach and Halt from the Command Palette, or pause your existing session.
- Open Views → Hardware Trace, then select ETM setup.
- Leave Storage at Auto (fixed FIFO first), or select a discovered ETF. On the H7S example it provides 2,048 bytes of fixed on-chip storage; no application RAM address is required.
- Under Decode and reveal at, keep Manual pause and Breakpoint enabled. Select On and wait for Intent: On · hardware: armed. A selected On radio alone is not evidence that the hardware accepted it.
- Press Continue, let the interesting code execute, then Pause. BKPT drains the sink, saves a raw snapshot, rearms as appropriate, and decodes the recording. ETM History opens when decoding is ready.
- Check Decoder: ready, instruction/invocation counts, and the Last stop health line in ETM setup before exploring the graph.
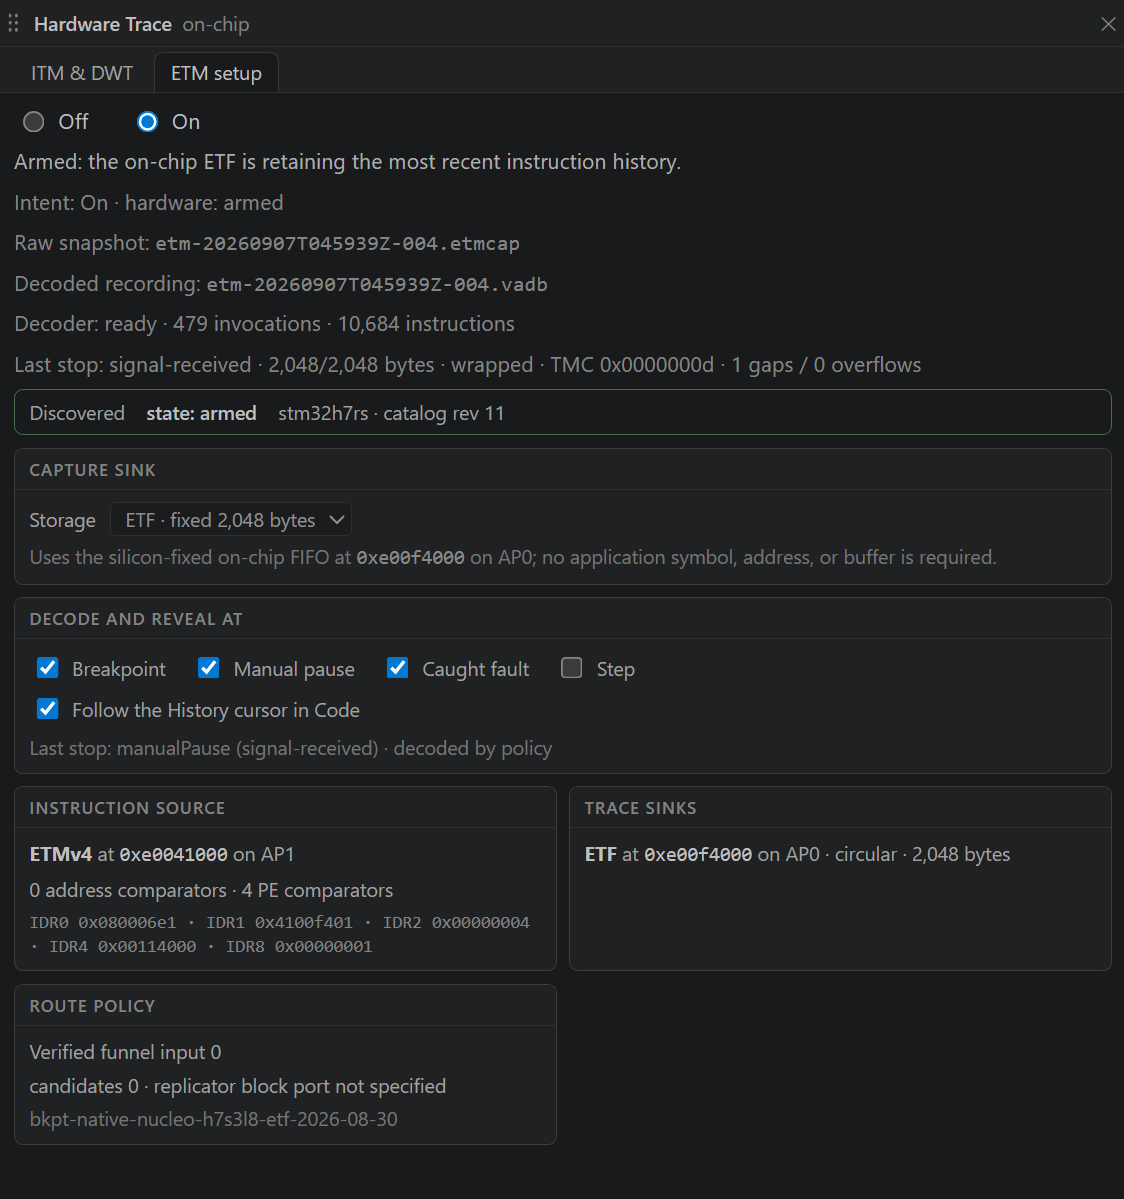
Check: use a short run first. An empty graph or an On selection without an armed status is not a successful capture. Read the refusal or decode error shown in the same setup view.
Storage and stop policies
| CONTROL | WHAT TO CHOOSE AND WHY |
|---|---|
| Auto (fixed FIFO first) | Prefer fixed on-chip storage where the discovered target supports it |
| ETF | Use the fixed on-chip buffer; its capacity is hardware-defined |
| ETR | Use a programmable RAM sink, only when the target supports it and your firmware reserves its buffer |
| ELF reservation | Give start/end linker symbols bounding that reserved buffer; the end is exclusive |
| Start + end / Start + size | Advanced address overrides, offered only when target policy allows them; sizes are bytes |
| Breakpoint | Decode when a code breakpoint stops the target |
| Manual pause | Decode when you explicitly pause |
| Caught fault | Decode when a configured fault catch stops execution; enable the relevant catch in Fault Analyzer too |
| Step | Also update history on step stops; leave this off for ordinary stepping with less decode/display work |
| Rapid-step display debounce | With Step enabled, choose Off, 100 ms, 250 ms, 500 ms, or 1 s to coalesce display work during rapid stepping |
| Follow the History cursor in Code | Navigate Code to the selected historical instruction/source location |
The stop policy controls which stops update the displayed recording. It does not install a breakpoint or enable fault catching by itself. A stop excluded by the policy can leave the previous recording on screen; read the recording name and Last stop rather than assuming it is new.
Warning: an allowed RAM range is not a guarantee that it is unused. Reserve an ETR buffer in your linker/application, outside code, stack, heap, and other data. Disarm ETM before editing the buffer contract. Use the target's discovered symbols, bounds, and alignment requirements; do not copy an address from another board's screenshot.
Read the flame view
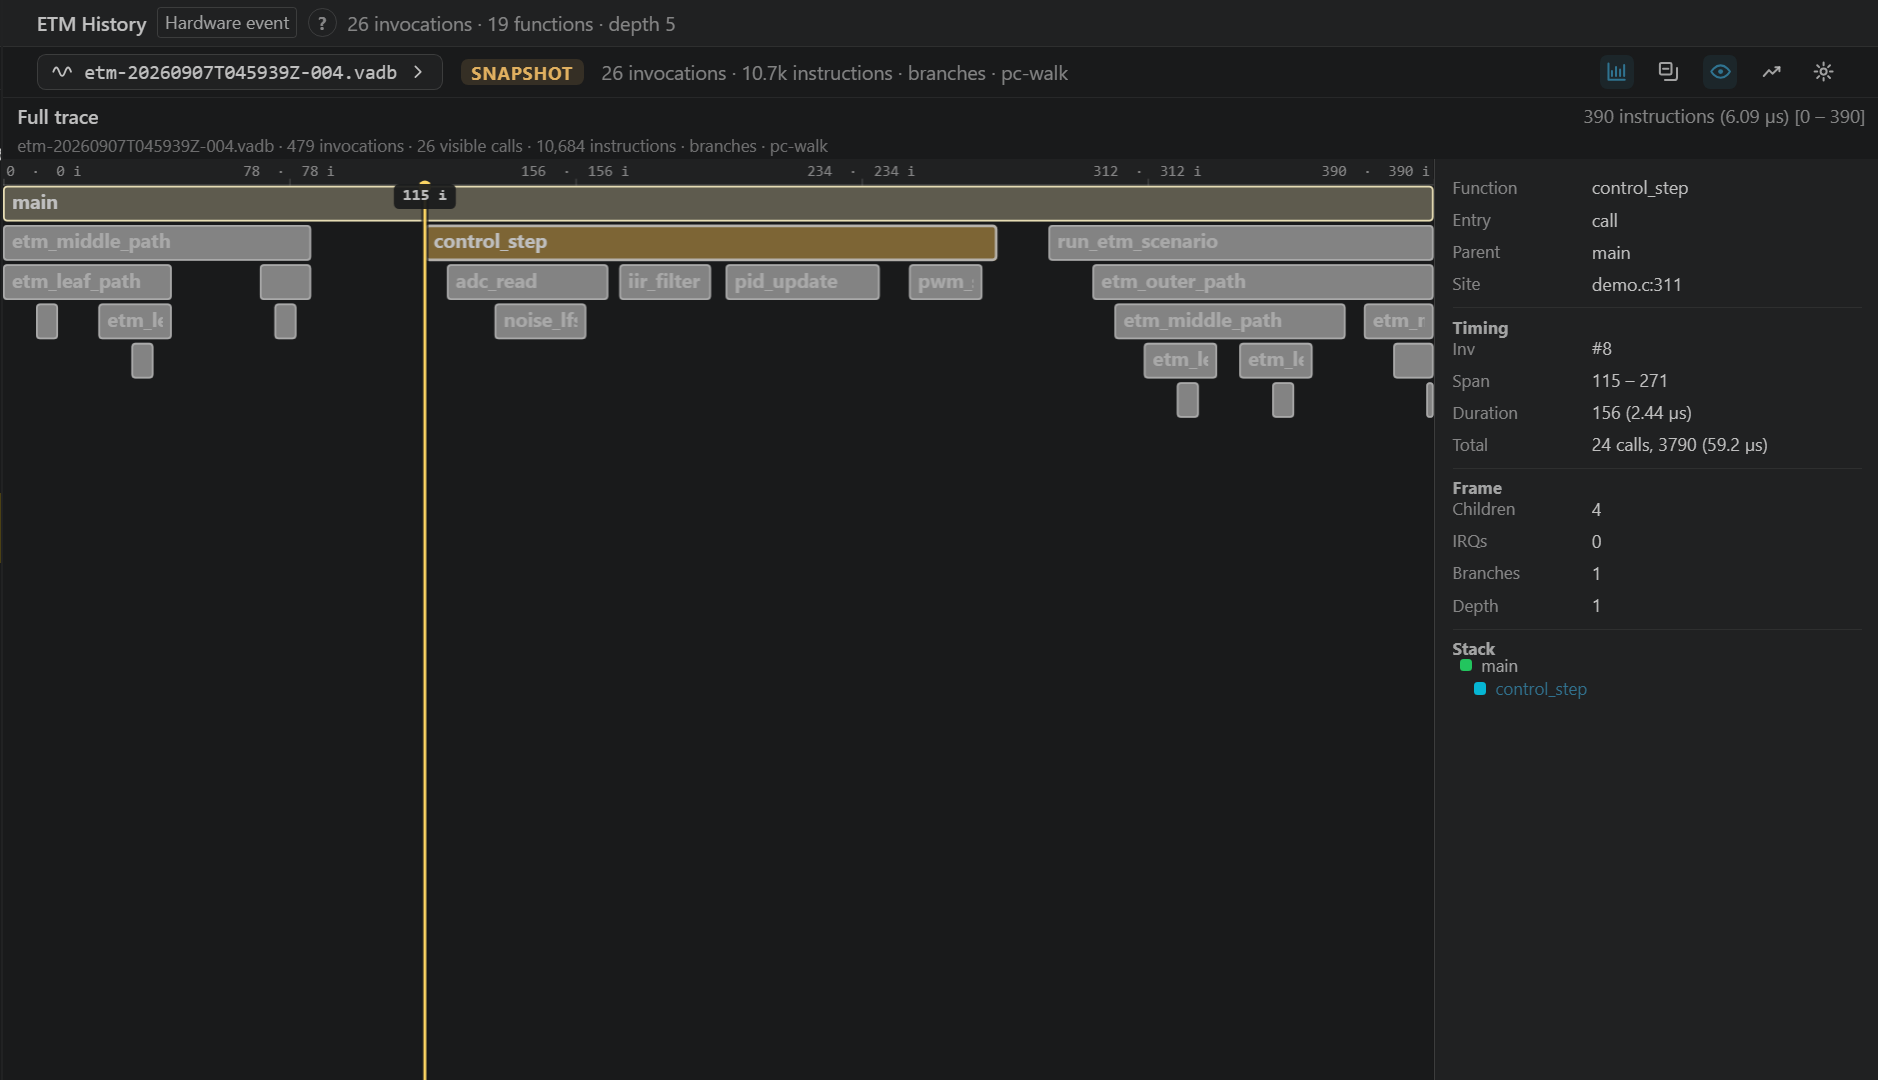
Each rectangle represents a function invocation or an explicitly reduced group of calls. Calls nest downward. Horizontal position follows execution order; the width describes the recorded span in the displayed unit. It is not a wall-clock CPU utilization graph.
- Hover a block for its function and invocation details.
- Hold Shift and move the pointer across the flame graph to scrub recorded execution in Code. Release Shift to leave the history cursor at that position.
- Click a block to select it and reveal that execution position in Code. The inspector shows its parent, call site, children, and recorded stack. This historical stack is separate from the live Call Stack tile.
- Double-click a block to focus on its invocation. Use Full trace or the breadcrumb/back control to leave that focus.
- Ctrl/Cmd + wheel zooms around the pointer. Ctrl/Cmd + drag selects a horizontal zoom range. Ordinary drag pans; ordinary wheel scrolls the call-depth rows.
The gray blocks shown when zoomed out are often decimated display blocks: calls have been reduced to fit the available pixels. Zoom in to inspect individual calls. Decimation and a trace gap are different things. The header distinguishes recording invocation totals, visible calls, and LOD cells (the reduced blocks currently drawn).
Toolbar and view settings
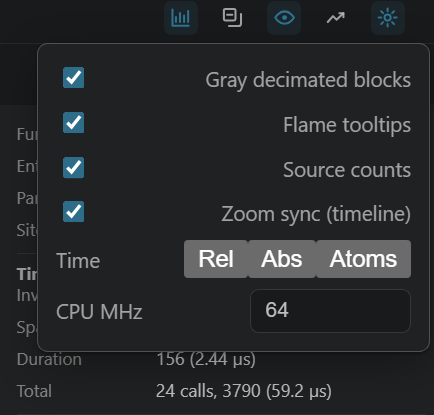
Hover an icon for its name. These controls change how an existing capture is displayed; they do not program the target's capture hardware.
| CONTROL | EFFECT |
|---|---|
| Recording name dropdown | Choose a saved recording; entries include modification time, size, and whether a raw capture accompanies it |
| Depth heat colors / By-function colors | Color by call depth or function identity; color alone is not timing accuracy or error status |
| Collapse recursion | Simplify repeated recursive frames in the display |
| Inspector panel | Show/hide the selected invocation's details and historical stack |
| DWT data-trace overlay | Choose compatible data-trace information present in that recording; a separate live probe graph is not automatically part of the ETM snapshot |
| View settings → Gray decimated blocks | Mark reduced blocks in gray when calls cannot all fit individually |
| Flame tooltips | Enable hover details |
| Source counts | Control available ETM source-count annotations |
| Zoom sync (timeline) | Synchronize the shared ETM timeline viewport where available |
| Sync with VA views (fused) | Offered for a recording containing compatible combined ViewAlyzer data; an ETM-only snapshot does not supply RTOS scheduling data |
| Time → Rel / Abs / Atoms | Display relative time, absolute trace time, or the recording's native positions; for these captures the native unit is instructions |
| CPU MHz | Override the clock used for time conversion in the view; this does not change the CPU clock or improve the capture's timing evidence |
Note: ETM instructions are not all one CPU cycle. In a bounded snapshot without reliable timing anchors, displayed microseconds are estimates. Abs does not create a real-world timestamp. Prefer Atoms and the instruction count for execution-order questions, and use appropriately timestamped measurements for exact durations.
Source, assembly, and the live halt
With Follow the History cursor in Code enabled, selecting recorded execution adds History cursor · atom … · function · address to Code. The separate live halt · function label still identifies the stopped CPU's location. The source highlight for history can therefore differ from the live halt highlight.
History browsing is temporary during a debug session. Continue returns Code to the live context; Step follows the newly stopped instruction. The recording stays loaded, so hold Shift over the flame again to resume browsing history. An unchanged halted refresh does not move you away from the history position.
Choose Show assembly to place Historical disassembly beside the source; drag its divider to resize it. Hide assembly closes that split. The ETM marker identifies the selected executed instruction. Surrounding ELF instructions provide context; the whole disassembly listing is not a claim that every row executed. Missing source can make historical disassembly the primary display.
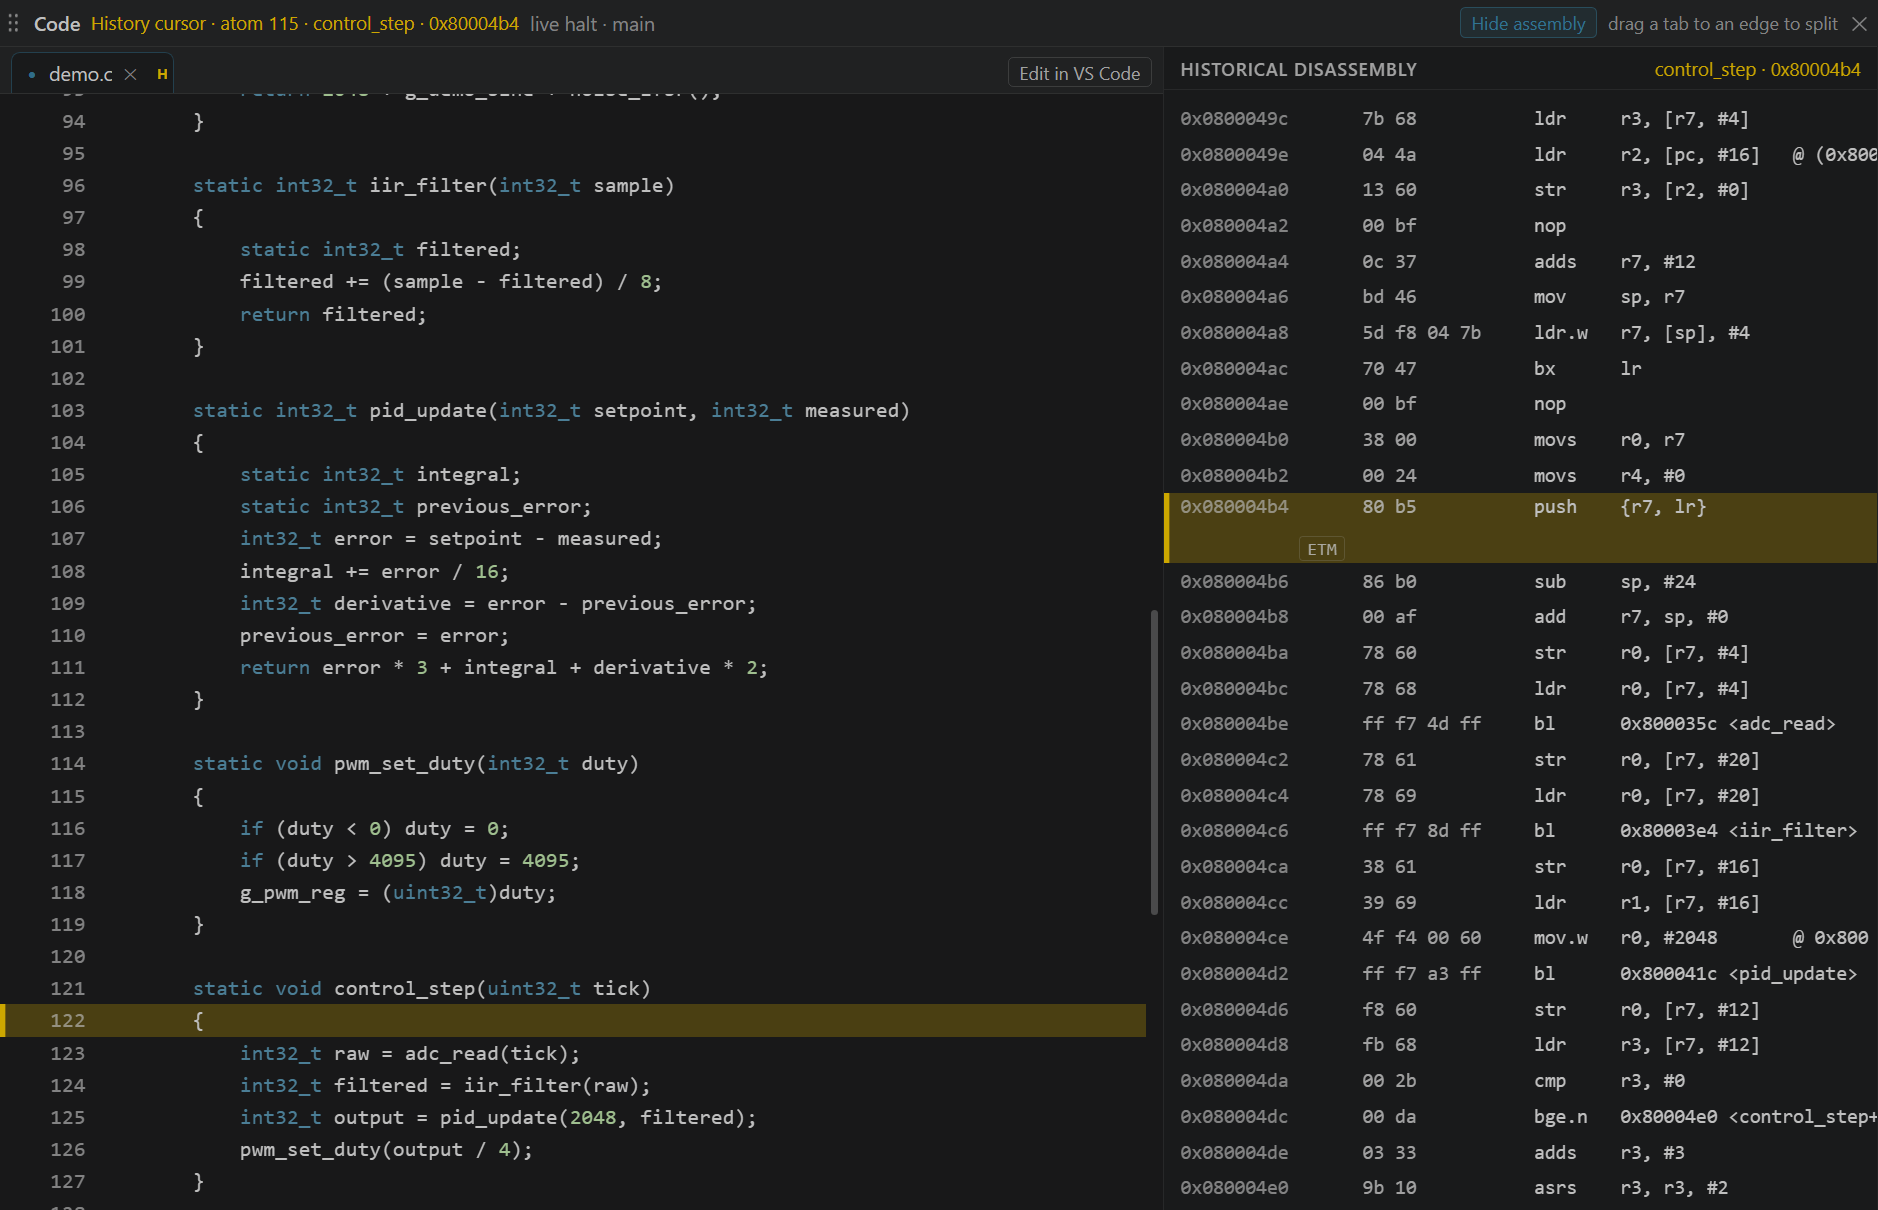
The normal Code Source / Mixed / Assembly selector and instruction stepping operate on the live debugger context. They are explained in Source and assembly. Registers, Variables, and Memory keep their live-halt meaning while you inspect history. ETM does not supply their past values, and historical navigation does not modify them.
Wrapped captures and health
The H7S ETF is a circular 2 KiB buffer. When it fills, newer trace replaces older trace. A longer run then changes which recent execution is retained; it does not retain the entire run.
SNAPSHOT indicates the loaded capture wrapped. Last stop in ETM setup reports bytes/capacity, wrapping, gaps, and overflows. A gap marks an incomplete/discontinuous decoded region. An overflow reports lost trace information. Do not infer missing execution across either.
The screenshots intentionally show an actual bounded capture, including its health status. A nonzero instruction count does not make a recording lossless. ITM/DWT SWO health is a separate stream's health; an ETM capture with zero reported FIFO overflows does not clear an SWO overflow warning.
Saved recordings and performance
Debug-session history is saved beneath the project's .va/etm-history/: .etmcap is the raw snapshot and .vadb is its decoded database. Keep the matching ELF and source revision with captures you need to investigate later. Use the filename dropdown in ETM History to reopen available recordings. Some shared picker tooltips still say .va/etm; the setup view's raw/decoded filename tooltips show the actual paths for this session.
The dropdown's × deletes the recording and its associated raw capture; copy anything you want to retain before using it. Selecting a saved file does not move the target to that execution state.
For a responsive debugging session, enable the stop events you need and leave Step decoding off unless you are investigating stepping itself. Closing ETM History avoids its drawing work, but does not turn off armed hardware or the configured capture policy. Choose ETM setup → Off to disarm, and check hardware: not armed; changes made while running can wait for the next halt. A matching future stop can reveal the tile again when ETM remains enabled.
Troubleshooting
| SYMPTOM | NEXT CHECK |
|---|---|
| On is unavailable or refused | Read the reason; verify the selected target, current Target Scan, discovered ETM/sink, and supported route |
| On intent, hardware not armed | Pause and inspect the reason; an intent saved offline or while running is not an armed capture |
| No new recording after a stop | Check the enabled stop events, Decoder state, actual raw/decoded paths, and any decode error |
| Only a small tail of execution is present | Check wrapping and capacity; the fixed buffer retains recent execution, not the entire run |
| Wrong function, source line, or assembly | Verify the exact flashed image, ELF, and source revision before interpreting the result |
| Possible ELF mismatch above the history | The decoder reconstructed an unusually large number of call frames. Nesting and source locations may be unreliable. Use the matching flashed image and ELF, then capture again; deep recursion alone does not trigger this warning |
| Flat/no variable overlay | Check whether the recording actually contains compatible DWT data; use separate live watches for ordinary probe samples |
| No RTOS tasks in the history | Instruction history alone does not invent scheduler events or saved task contexts |
| UI feels busy during repeated steps | Disable Step decoding or increase its display debounce; close unused views and disable unnecessary acquisition |