 DOCS/VIEWALYZER/MEMORY
VIEWALYZER · GPUI EDITION
DOCS/VIEWALYZER/MEMORY
VIEWALYZER · GPUI EDITION
VIEWALYZER · VIEWS
Memory
How much flash and RAM the build uses, and where it goes, read from the ELF. No recording needed.
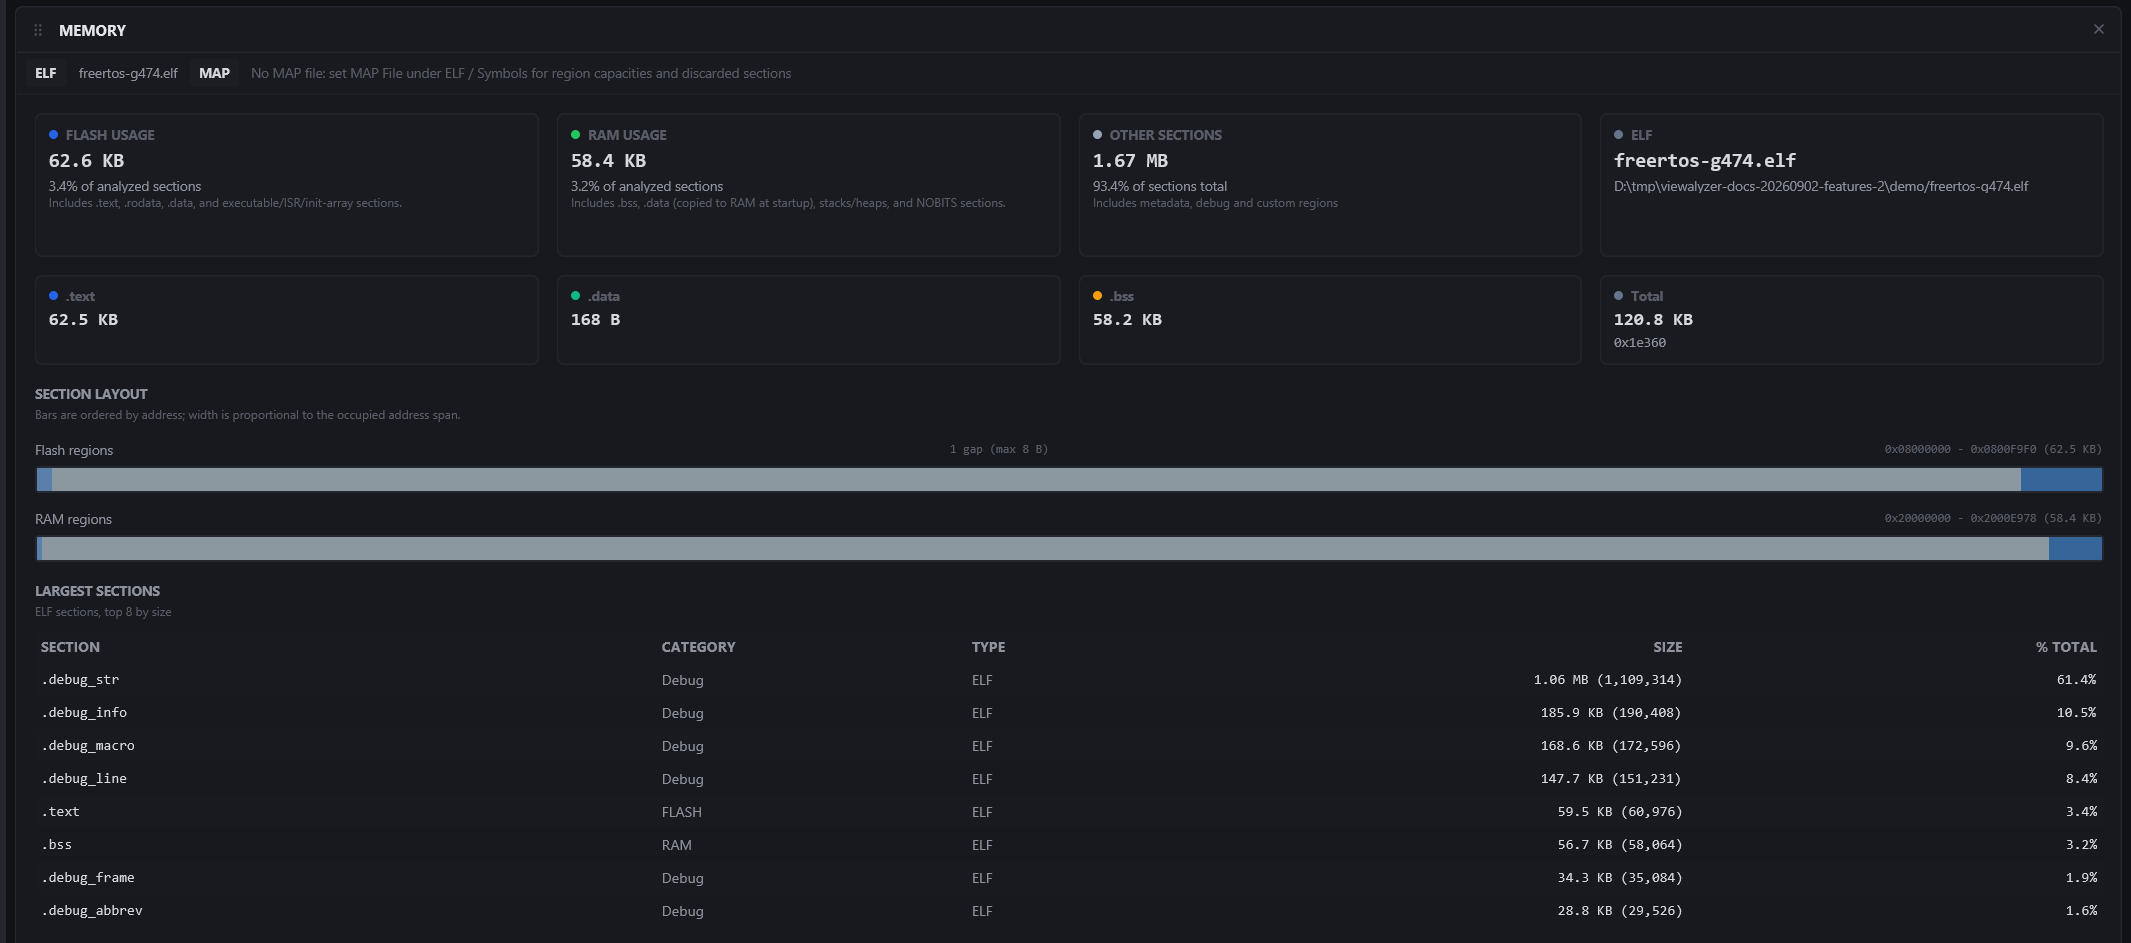
Needs: the ELF File (ELF / Symbols). Add the MAP File (the GNU ld linker map, -Wl,-Map=...) and the view also knows each memory region's capacity and what the linker threw away.
What it shows
- Four cards: Flash usage, RAM usage, Other sections (what is neither), and the ELF the figures come from.
- With a MAP file: one card per linker memory region (
FLASH,RAM,DTCM, ...) with its size, how much of it is used and how much is free, turning red past 90 %; and a strip listing how many input sections the linker discarded (--gc-sections) and the largest of them. Sections the ELF alone could not place are re-categorised by the region they fall in. - The
.text/.data/.bssbreakdown: code, initialised data (which costs flash and RAM, since it is copied at boot) and zeroed data. - Address-ordered layout bars for flash and RAM, one block per section, so a gap or an oversized block is visible at a glance.
- The largest-sections table.
Section names are taken as the linker wrote them, so a Zephyr build with dot-less section names is categorised the same way as a GNU build; tables that live in flash but are marked writable are not counted as RAM.