 DOCS/BKPT DEBUG/RTOS TASK ACTIVITY
BKPT DEBUG · VS CODE
DOCS/BKPT DEBUG/RTOS TASK ACTIVITY
BKPT DEBUG · VS CODE
RTOS task activity
Inspect FreeRTOS tasks and stacks, then follow task activity in the Timeline without adding recorder hooks to your firmware.
Experimental: Currently supports FreeRTOS, including 10.3 and 10.4+ kernel layouts. Other RTOS kernels are not supported yet. The free version records 5 seconds per task recording, shared by Samples and DWT events. Task and stack inspection is unlimited. DWT mode uses two comparators. For full RTOS event tracing, use ViewAlyzer.
Inspect your tasks
- Select the probe and the ELF that matches your programmed firmware, then start or attach using the Debug Layout controls. See Getting started.
- Open Views → RTOS. Let the firmware run far enough to start the scheduler and create its tasks, then Pause.
- Choose Inspect tasks. The table shows the current task, task states, priorities, and available stack information. Use the filter to find a task; select its name for details.
- Enable Auto refresh on halt if you want a fresh task snapshot each time you pause. This is optional; Refresh tasks reads one snapshot on demand.
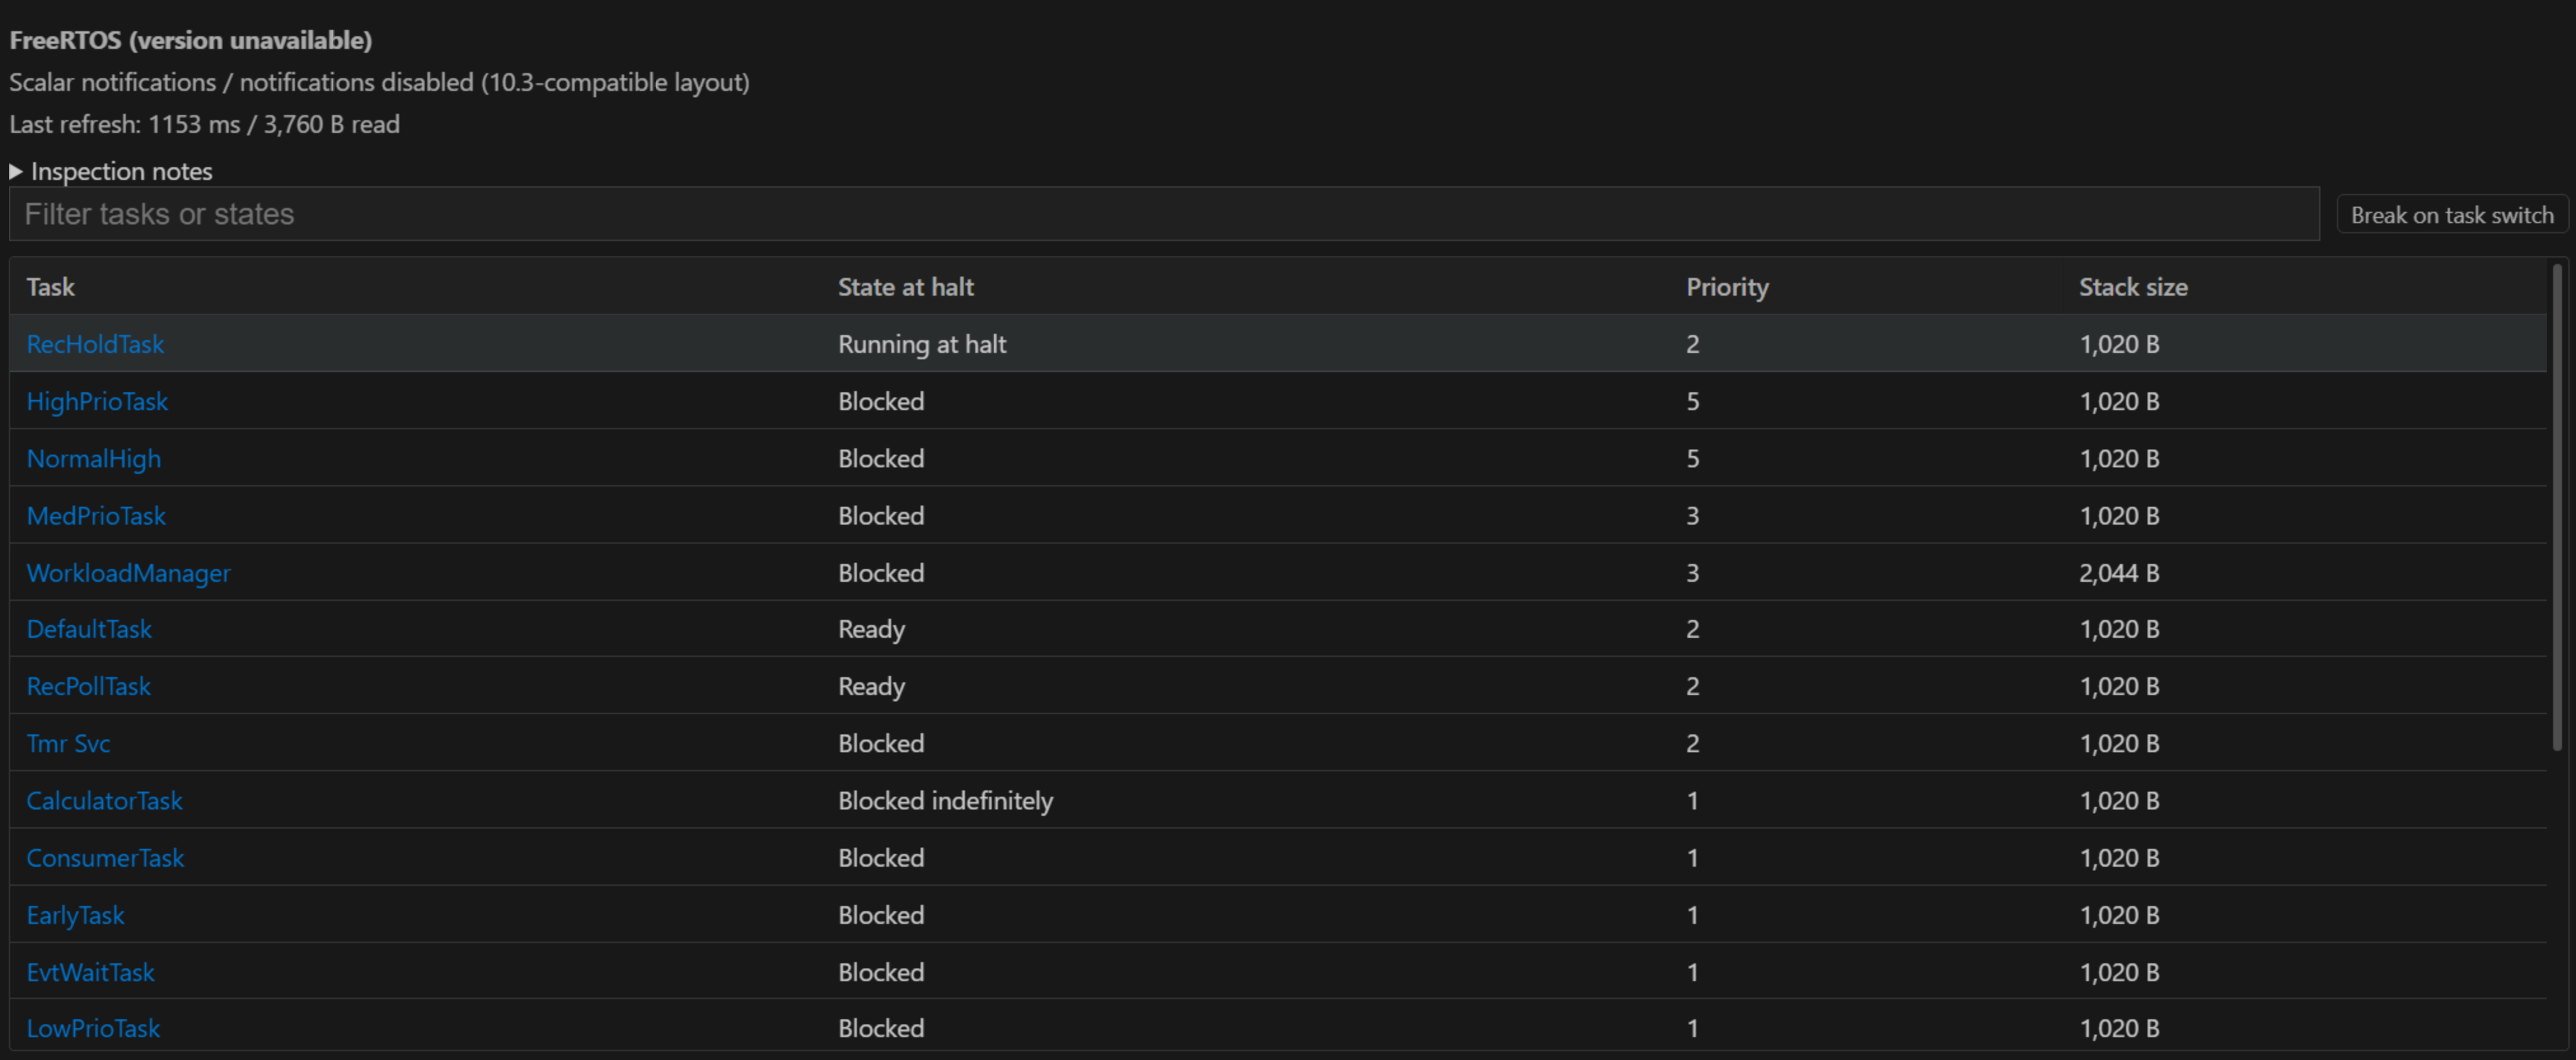
The ELF must contain FreeRTOS kernel symbols and debug type information. A stripped ELF, optimized-away kernel data, or a kernel layout the inspector cannot recognize may prevent discovery. Follow the prerequisite message in the view and rebuild the firmware and matching ELF when needed.
Selecting a task opens its saved details. Call Stack and Variables continue to show the halted core; selecting a task does not switch those views to that task's saved context. The active task's saved stack pointer can be stale.
Check stack usage
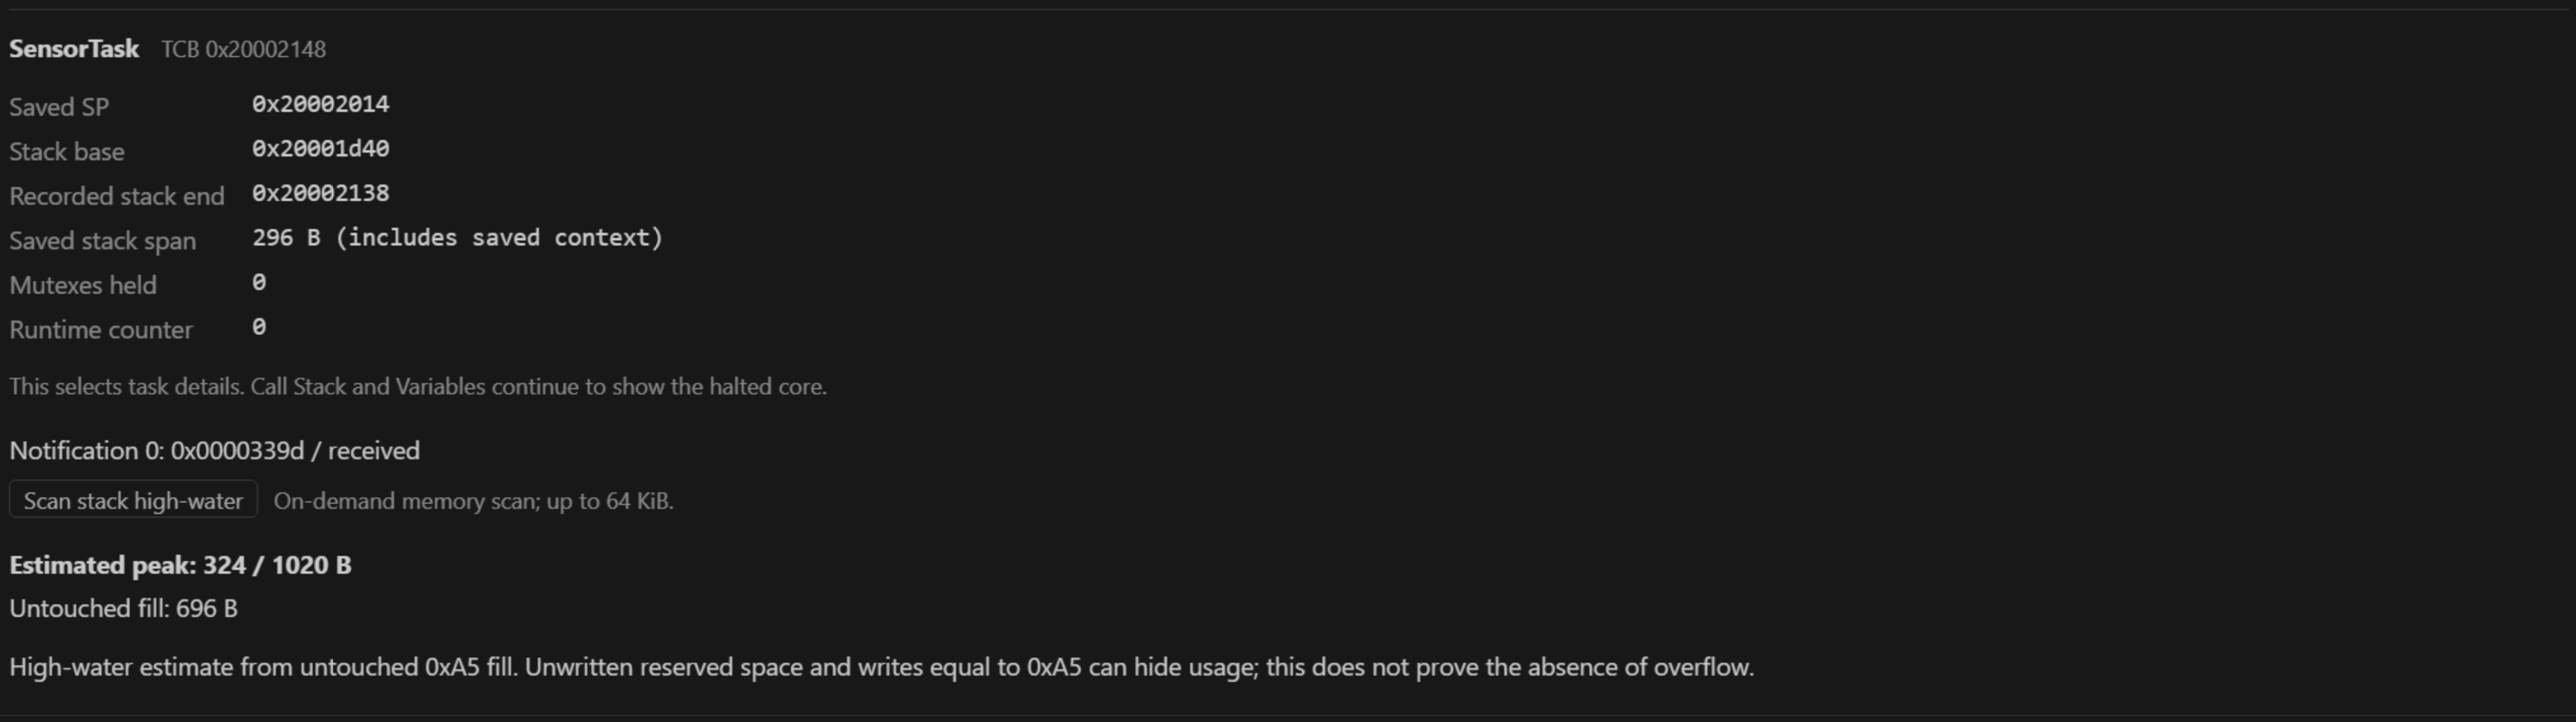
Select a task and choose Scan stack high-water. The result estimates the deepest stack use from the untouched fill pattern. Enable Auto scan selected stack to repeat the scan for that task on each halt while the RTOS view is visible.
| REQUIREMENT | WHAT TO DO |
|---|---|
| Recorded stack bounds | Set configRECORD_STACK_HIGH_ADDRESS=1 in FreeRTOSConfig.h, then rebuild and program the matching firmware. |
| Evidence of stack-fill initialization | Set configUSE_TRACE_FACILITY=1 and retain kernel debug information. This option alone does not install recorder hooks. |
| A halted target | Pause before inspecting or scanning. |
Stacks over 64 KiB are not scanned, to bound probe traffic. The result is an estimate from memory contents, not a proof that overflow never occurred. Saved stack span includes saved context and is a different measurement from the fill-based peak. An unavailable field or disabled scan includes a reason in the view.
Choose a live activity mode
Keep Live task activity checked to request acquisition. Prepare it while paused, then Continue. Show Timeline opens the recorded task lanes.
| SAMPLES | DWT EVENTS | |
|---|---|---|
| Observes | Periodic reads of the current-task pointer | Hardware write events for the current-task pointer, plus task-roster changes |
| Needs | Readable kernel data and a discovered task roster | Supported DWT data trace, a working SWO route, correct clock settings, and two free comparators |
| Cost | Repeated probe reads; higher rates add traffic | Two shared DWT comparators and SWO bandwidth |
| Main limit | Task runs between reads can be missed | Transport loss and decoder gaps can hide changes; timing alignment is approximate |
| When RTOS is hidden | Sampling pauses | Armed capture continues |
Samples
Choose Samples and a rate. Start at a moderate rate such as 20 or 100 Hz. The 500 Hz and 1 kHz choices are experimental requests; the achieved rate depends on your probe, connection, and other debug traffic. The live status reports the achieved rate.

DWT events
Pause, select DWT events, and wait for Armed · Continue to capture. If preparation needs a clock setting, trace route, or free comparator, the view tells you what is missing. Check Hardware trace for Target Scan and SWO setup.

The Data watchpoints section of Breakpoints shows RTOS current task and RTOS task roster, including their applied comparator ownership. These share the core's DWT resources with your other watchpoints. PC sampling cannot run alongside DWT task activity; its enable checkbox explains the conflict.

Ordinary pause/resume retains the request and prepares the next run automatically. Temporary acquisition failures retry automatically. A prerequisite message waits for the required change, such as pausing to prepare capture or letting the scheduler initialize. You do not need to find a separate Retry button.
Read and revisit the Timeline
Each task has a lane. Colored intervals show observed task activity; the source badge distinguishes probe samples from hardware events. Both modes provide an approximate view of scheduling. Interrupt execution is not separated from the selected task, and neither mode guarantees complete task-switch coverage. Health's task percentages describe observed activity share, not precise per-task CPU load.
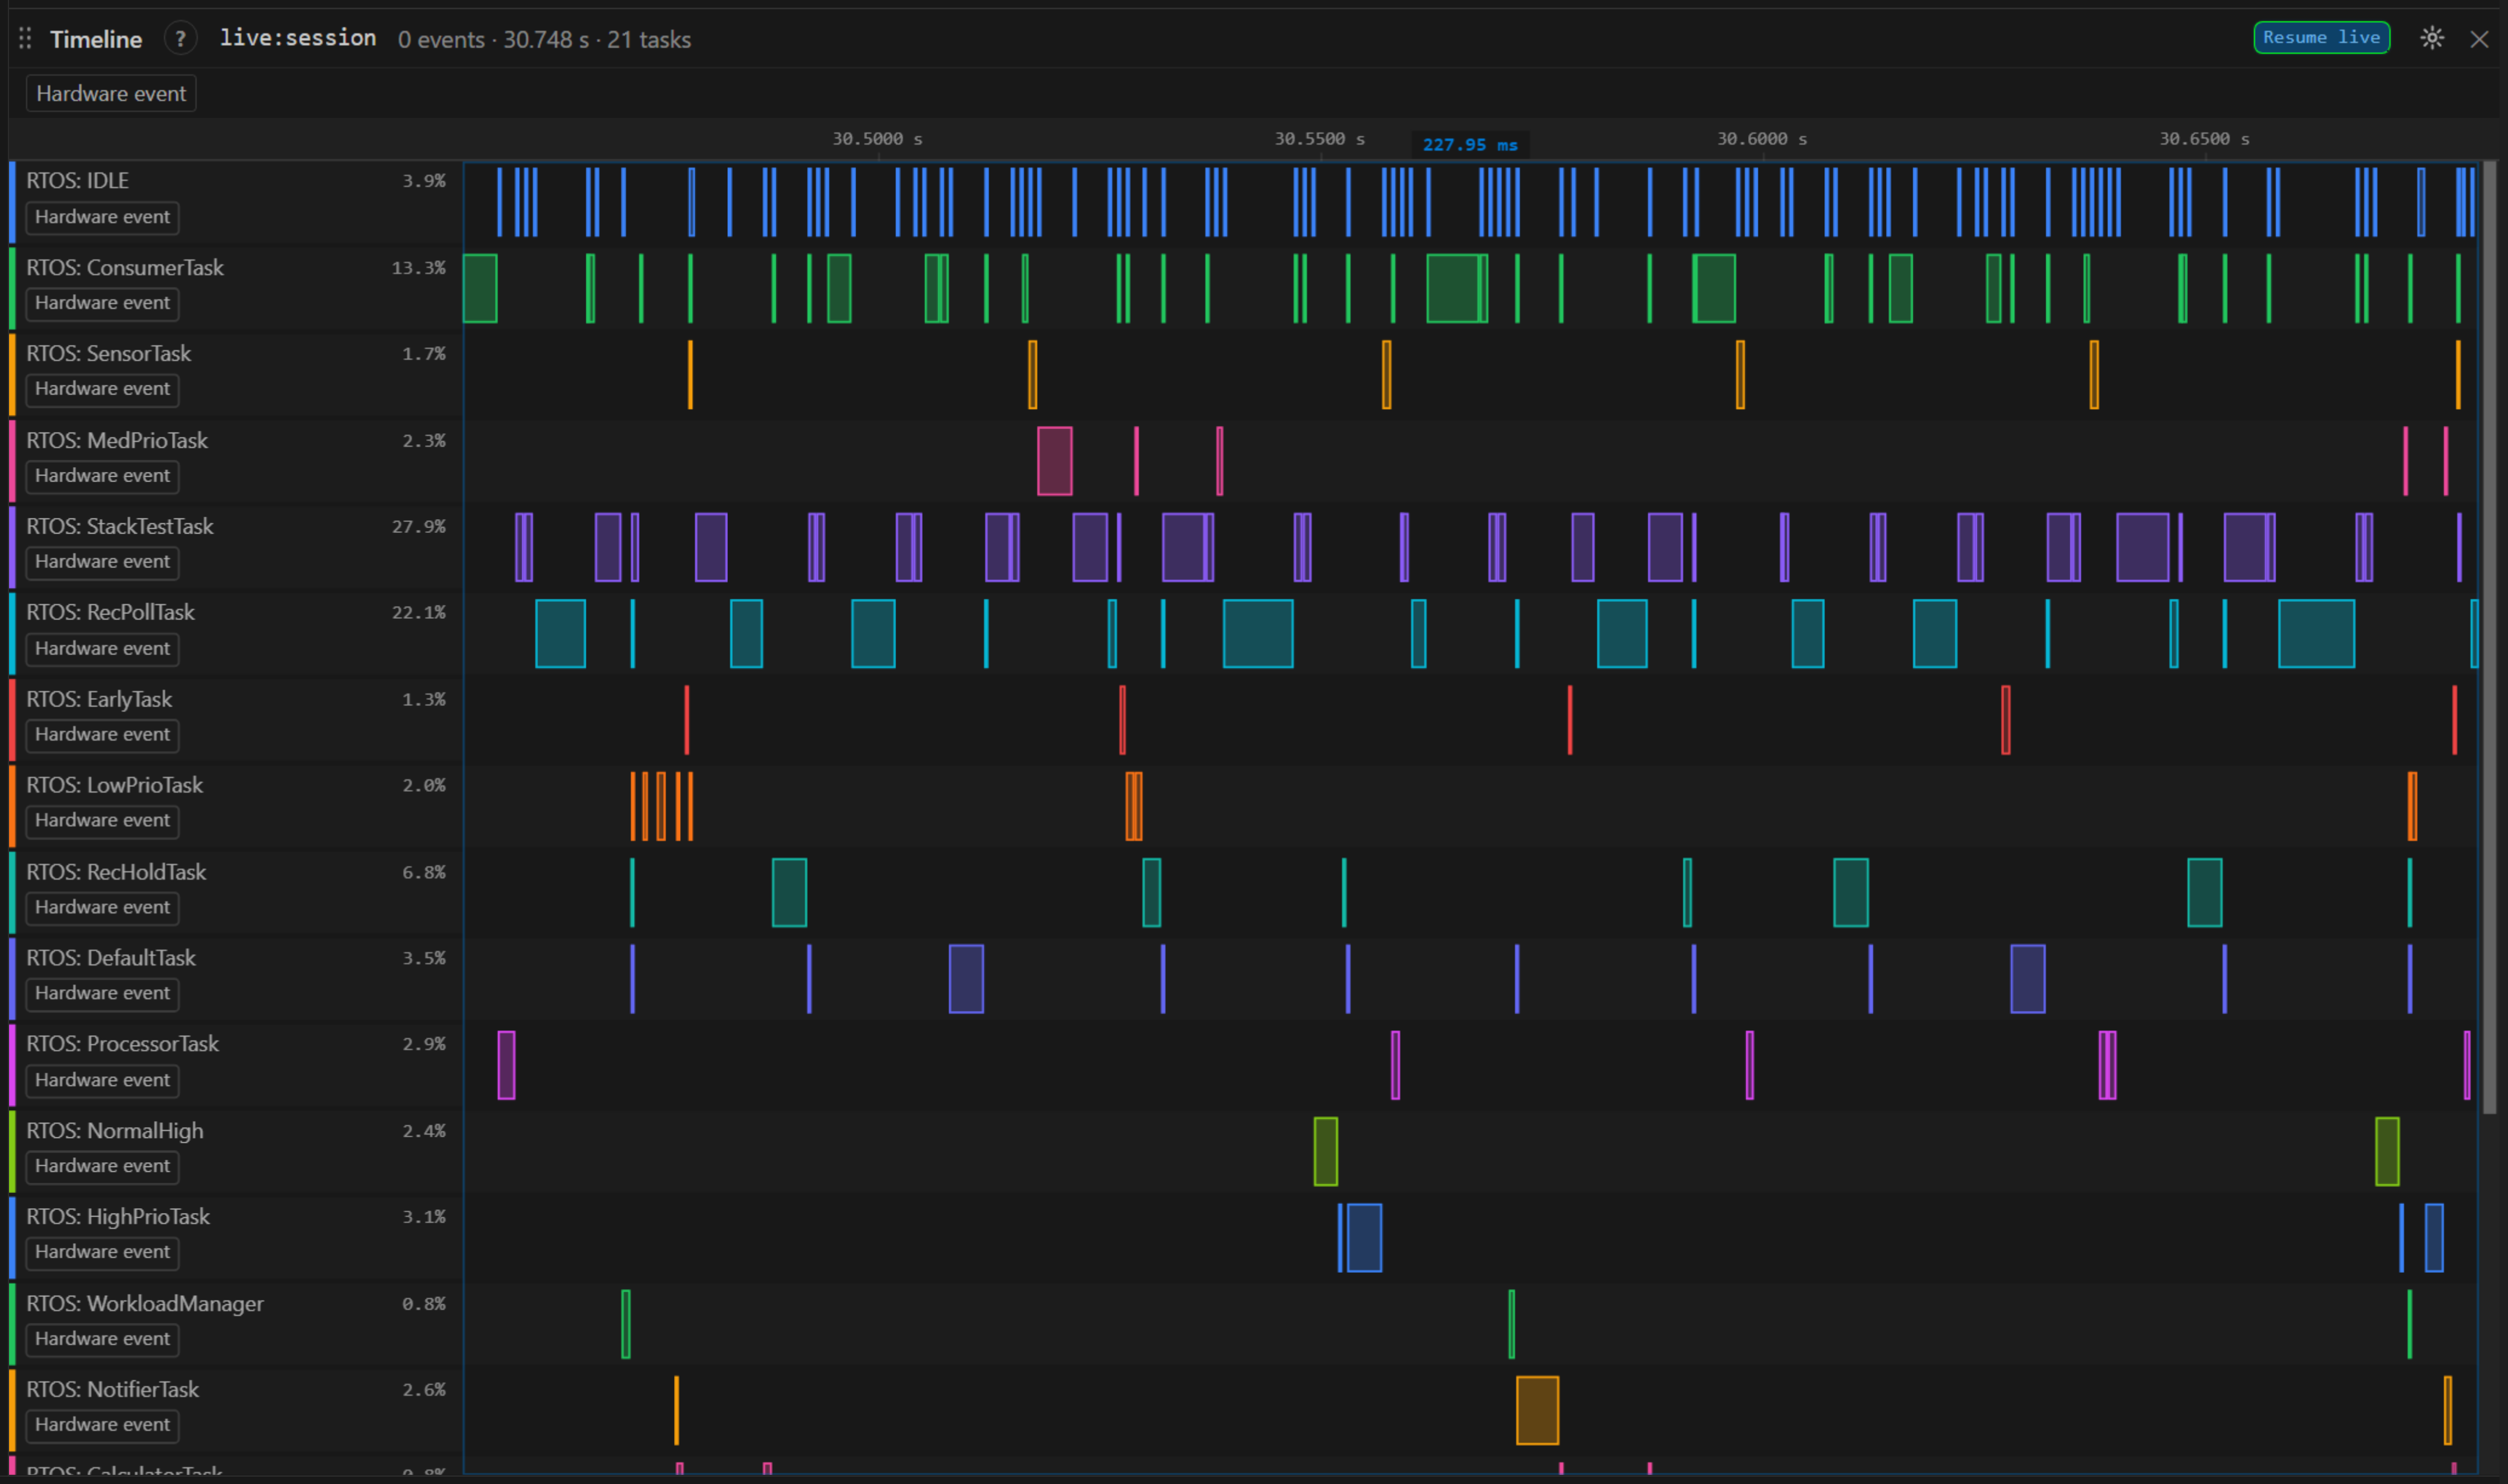
Pause to inspect the recording, or pan and zoom while collection continues. Interacting with the Timeline stops automatic scrolling. The blinking blue Resume live control follows the latest activity again.
History remains available through pause/resume and automatic recovery. Long recordings retain full task history in memory, so memory use grows with recording length; there is currently no disk-backed history. Keep the debug session open while reviewing it. Gaps are gaps in observation, not evidence that a task was idle.
Free recordings and longer captures
The free allowance is 5 seconds of active acquisition per task recording, shared across Samples and DWT. Paused time and preparation do not consume it. Reaching the limit stops collection, keeps the target running, and retains the Timeline for inspection. If DWT is still armed, pause once to release its comparators.

| ACTION | RECORDING ALLOWANCE AND HISTORY |
|---|---|
| Pause, then Continue | Same allowance; history is retained. |
| Change Samples/DWT mode | Same allowance; history is retained. |
| Clear task history | Deletes task history; does not renew the allowance. |
| New task recording, after reaching the limit | Pause first. Starts a fresh allowance and clears the previous task history. |
| Start a new debug session, or reset the target into a new run | Starts a new recording and a fresh allowance. |
For longer recordings, choose Unlock with ViewAlyzer. Activate your key or install your license from the BKPT Debug sidebar; Refresh license rereads it without deleting history. The RTOS view shows the allowance your license provides.
When to use ViewAlyzer
Use this experimental view for quick task inspection, stack checks, and an approximate scheduling view during debugging. Use ViewAlyzer with its firmware recorder for full RTOS event tracing: scheduler events, queues, mutexes, notifications, and application events recorded by the firmware. That event context lets you investigate why a task woke, blocked, or waited, beyond observing which task was selected.