 DOCS/BKPT DEBUG/HARDWARE TRACE
BKPT DEBUG · VS CODE
DOCS/BKPT DEBUG/HARDWARE TRACE
BKPT DEBUG · VS CODE
Hardware trace
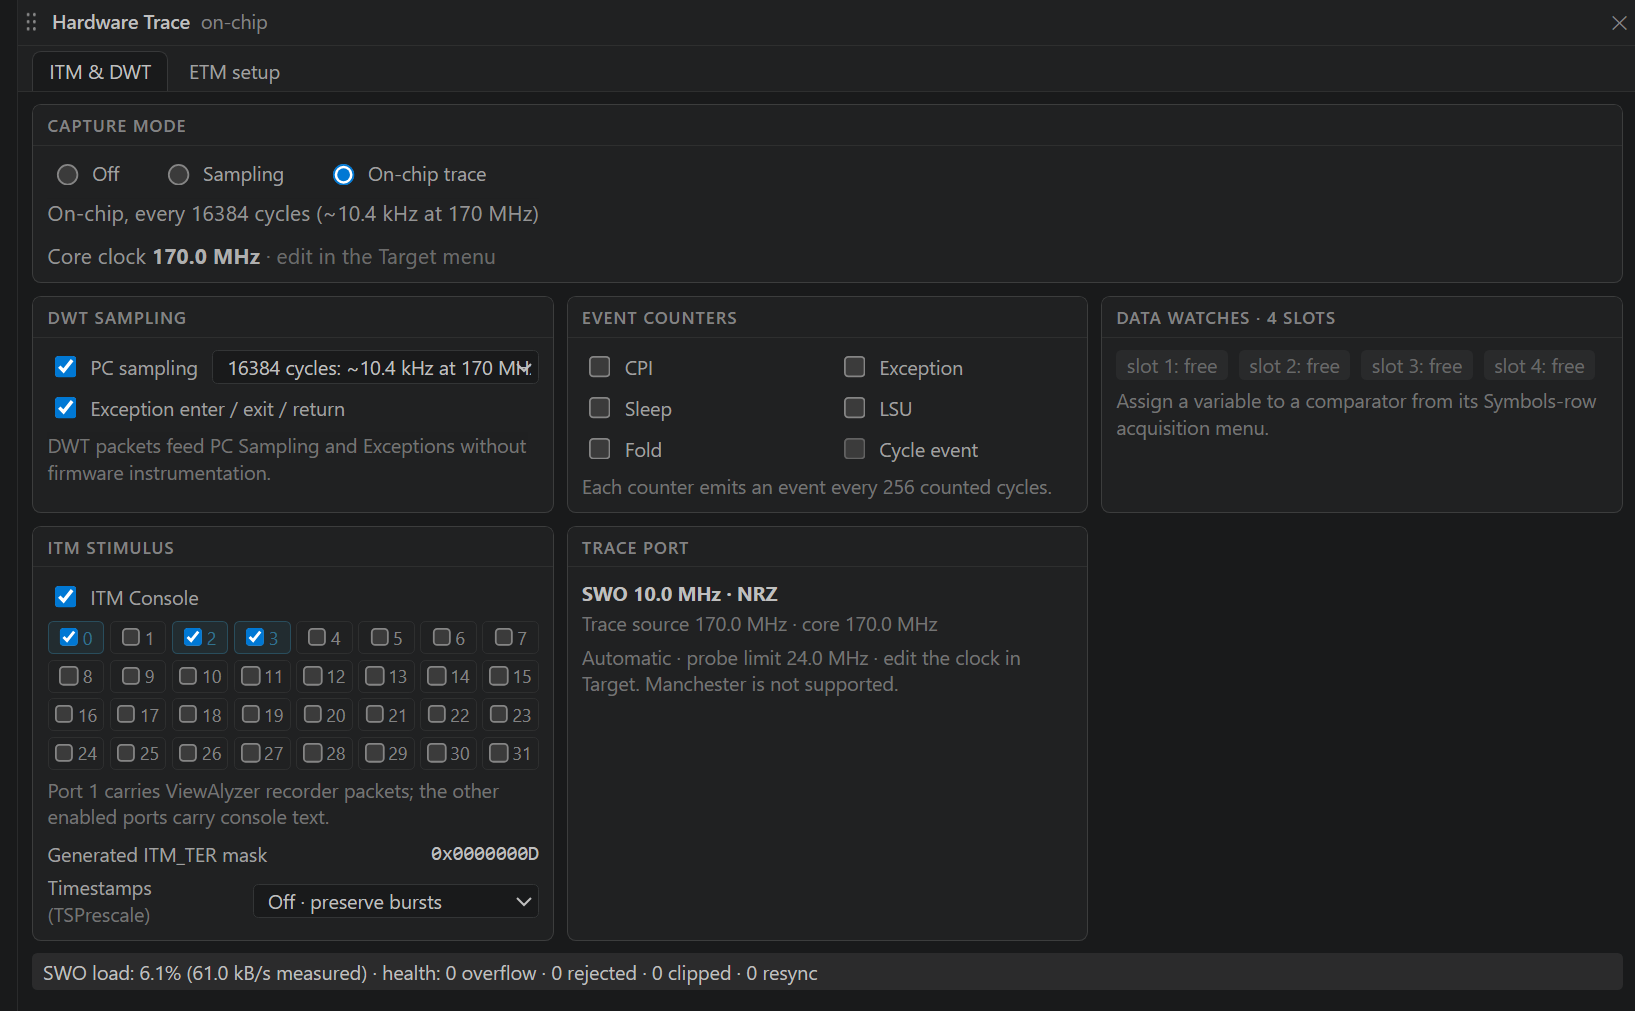
The Hardware Trace tile controls optional on-chip observations during a debug session. Use it for PC samples, exception events, streamed CPU data accesses, event counters, and firmware text over SWO. Open it through Views → Hardware Trace; the ITM & DWT tab contains these controls. The separate ETM setup tab configures execution history on targets with a supported ETM and trace sink.
Start with the question you want to answer
| GOAL | ENABLE | OPEN THE RESULT |
|---|---|---|
| Find hot code with minimal setup | Sampling | PC Sampling, Code, Timeline |
| Read firmware's ITM prints | On-chip trace → ITM stimulus → ITM Console, then the firmware's port | ITM Console |
| Count interrupt activity | On-chip trace → DWT sampling → Exception enter / exit / return | Exceptions |
| Graph CPU writes without polling | On-chip trace, then a DWT acquisition in Symbols or a peripheral Trace action | Traces, Symbols, Data watchpoints status |
| Stop at an unexpected access | A Break on… action | Breakpoints → Data watchpoints; hardware trace can remain Off |
| Inspect relative hardware counter activity | Selected Event counters | Hardware Trace's counter readout |
Advanced sources are opt-in. Selecting On-chip trace does not turn on all of them. A blank ITM Console is expected until its ports are enabled and the firmware actually writes text. Follow the complete ITM walkthrough for the first print and the timestamp dropdown.
Hardware and clock prerequisites
DWT is the Data Watchpoint and Trace block. ITM transports software stimulus and hardware trace packets. SWO is the single-wire trace output to the probe; SWV is the broader Serial Wire Viewer workflow built on these sources. Core-family names alone do not guarantee every optional feature. Target Scan supplies the connected device's actual capabilities.
- Connect ST-LINK or J-Link, SWD, ground/reference voltage, and the board's SWO signal. Plain SWD debugging can work while SWO is unwired.
- Stop the debug session and run Target → Scan Target. A scan needs exclusive access to the probe; reuse a matching scan for ordinary sessions instead of rescanning on every attach.
- Enter the firmware's actual Core clock. For a G474 example configured at 170 MHz, enter 170 MHz; do not use a chip's advertised maximum if firmware currently runs slower.
- Leave SWO clock automatic initially. Start/attach and inspect the active-source line. It explains a missing scan, clock, capability, or receiver problem.
Automatic SWO chooses a supported exact divider, up to 10 MHz and the probe's reported receiver limit. A manual request can be rounded to an achievable divider. Trace port shows the actual SWO rate, NRZ format, and trace-source clock, including a device-specific clock division when applicable. Manchester SWO is not supported.
Capture mode
| MODE | BEHAVIOR |
|---|---|
| Off | Default. Disables the hardware-trace acquisition path: ITM stimulus, DWT trace sources, PC sampling, and the SWO receiver. Saved halt watchpoints and explicitly selected memory polling are separate features. |
| Sampling | Requests a statistical PC profile. Uses on-chip PC sampling when scan, clocks, and the target permit it; otherwise polls over the probe and explains the fallback. It does not apply the advanced ITM console settings. |
| On-chip trace | Uses your individually selected ITM/DWT sources. Read the active state and any refusal; selecting this mode is not proof that all requested sources are armed. |
The header distinguishes the selected mode from what is actually active. For example, a sampling request may say it is polling because an on-chip prerequisite is missing. Turning the mode Off preserves saved preferences for later use but stops this acquisition path.
DWT sampling controls
PC sampling enables instruction-address samples. Its interval dropdown lists cycles between samples, the approximate rate at the configured clock, and estimated SWO use. A longer interval produces fewer samples and less traffic. Choices the pin cannot carry are disabled. This is a hardware sample interval, not the UI refresh interval.
Exception enter / exit / return enables hardware exception packets. Open Exceptions for per-handler enter, exit, return, and maximum nesting counts. Entry/exit/return describe hardware transitions; counts may not balance within a capture that starts or ends inside an interrupt, and packet loss can also make them incomplete. Handler names need matching ELF/vector information. Firmware does not need recorder hooks for these packets.
The Hardware event badge identifies the producer. For exact interrupt durations, check timestamp availability and health first; a count table alone is not a trustworthy latency measurement.
Event counters
Enable only counters useful to the investigation. Their packet counts summarize hardware counter activity; they are not one event per C statement or a complete list of individual stalls.
| COUNTER | WHAT IT TRACKS |
|---|---|
| CPI | Extra cycles associated with multi-cycle instruction execution |
| Exception | Exception processing overhead |
| Sleep | Cycles spent sleeping |
| LSU | Additional load/store unit cycles |
| Fold | Folded instructions |
| Cycle event | Periodic cycle events using the shared postcounter |
The small performance counters emit overflow events as they roll over, rather than streaming every counted cycle. The cycle event shares a timer with PC sampling, so its checkbox is disabled while PC sampling is on; the hover explains that conflict. Enabling several fast counters can overwhelm SWO even if application logging is quiet.
Data watches
In Symbols, select an available dwt:N acquisition slot for a variable. For a device register, use Peripheral Registers and its Trace writes / reads / all access actions. The Data watches card lists each streamable slot, its address and size, and its configured access kind. Empty entries say free.
Slot numbering in the UI starts at 1. The underlying hardware numbers from
- Streamed data packets identify only comparators 0–3, so the UI exposes
at most four streamable slots even if more halt-watch resources exist. The Data watchpoints list shows saved Trace intent and whether it is Armed, Pending, or Error.
DWT traces matching CPU accesses, not every autonomous DMA/peripheral change. Trace and halt watchpoints share physical comparator capacity. Changing a selection may wait for a halt to apply; trust the status rather than the presence of a saved row.
ITM stimulus and timestamps
ITM Console enables selected software stimulus ports. Check ports 0–31, avoiding the displayed recorder port for ordinary text. The generated mask is the bitwise representation of those selections.
Timestamps (TSPrescale) offers Off · preserve bursts, On, On · /4, On · /16, and On · /64. It controls local timestamp packets and their counter prescaler. It does not set the SWO baud rate or sample interval. The ITM Console guide explains every choice, its tradeoff, and why a numeric console time is not automatically precise event timing.
SWO load and health
Before data arrives, the load line is an estimate from configured sources. During a stream it can show measured bytes per second and the percentage of the selected SWO capacity.
| READOUT | HOW TO INTERPRET IT |
|---|---|
| overflow | Trace overflow was reported; the stream is incomplete |
| rejected | Packets/data were rejected by the processing path |
| clipped | Data exceeded a supported bound |
| resync | The decoder had to regain synchronization |
| corrupt bytes skipped | Bytes could not be decoded as valid data |
| inactive | There is no SWO stream; polling does not produce SWO health statistics |
A low average load does not guarantee bursts fit in the FIFO. If health says degraded, values and counts may be partial. First disable unused sources, lengthen the PC interval, reduce firmware printing, or disable local timestamps. Then consider a faster supported SWO rate. Capture again and compare health instead of trusting a visually smooth graph.
ETM History and capture files
ETM is instruction/execution trace, separate from ITM text and DWT samples. Its tab explains discovered support and missing sink routes. Follow the ETM execution history tutorial for a complete first capture, real H7S screenshots, flame-view controls, saved recordings, and timing/health limits. See live assembly versus ETM history before interpreting a history cursor as current CPU state.
On a capable target, these ETM setup controls determine storage and when history is decoded. Unsupported choices have a reason instead of arming an unknown route.
| CONTROL | MEANING |
|---|---|
| Off / On | Save the desired ETM state; read hardware: armed / not armed separately from intent |
| Storage → Auto (fixed FIFO first) | Prefer a discovered fixed on-chip FIFO before a programmable RAM sink |
| ETF | A discovered, fixed on-chip trace buffer; no application RAM range to enter |
| ETR | A programmable trace sink using firmware-reserved RAM |
| ELF reservation | Start/end linker symbols bounding a region deliberately reserved for trace |
| Start + end / Start + size | Advanced address overrides, only where target policy permits them; end is exclusive and size is in bytes |
| Decode and reveal at | Choose Breakpoint, Manual pause, Caught fault, and optionally Step stops that update the history view |
| Rapid-step display debounce | With Step updates enabled, Off, 100 ms, 250 ms, 500 ms, or 1 s delays/coalesces display work during rapid stepping; this is not the instruction sampling rate |
| Follow the History cursor in Code | Reveal source for the selected historical execution position |
Warning: an ETR buffer must be reserved by your linker/application. An allowed address range is not a promise that the RAM is unused. BKPT checks the discovered region and alignment, but cannot prove an arbitrary override does not overlap live data. Disarm the live ETM path before editing its memory contract. A G474 without a supported sink route needs no buffer configuration just to use ITM or DWT.
The standalone Record form and .vacf capture configurations also support hardware trace. Standalone recording needs the probe between debug sessions. Recording explains which views need firmware recorder data, and data sources explains timing and provenance limits when a saved recording lacks metadata.