 DOCS/BKPT DEBUG/SOURCE AND ASSEMBLY
BKPT DEBUG · VS CODE
DOCS/BKPT DEBUG/SOURCE AND ASSEMBLY
BKPT DEBUG · VS CODE
Source and assembly
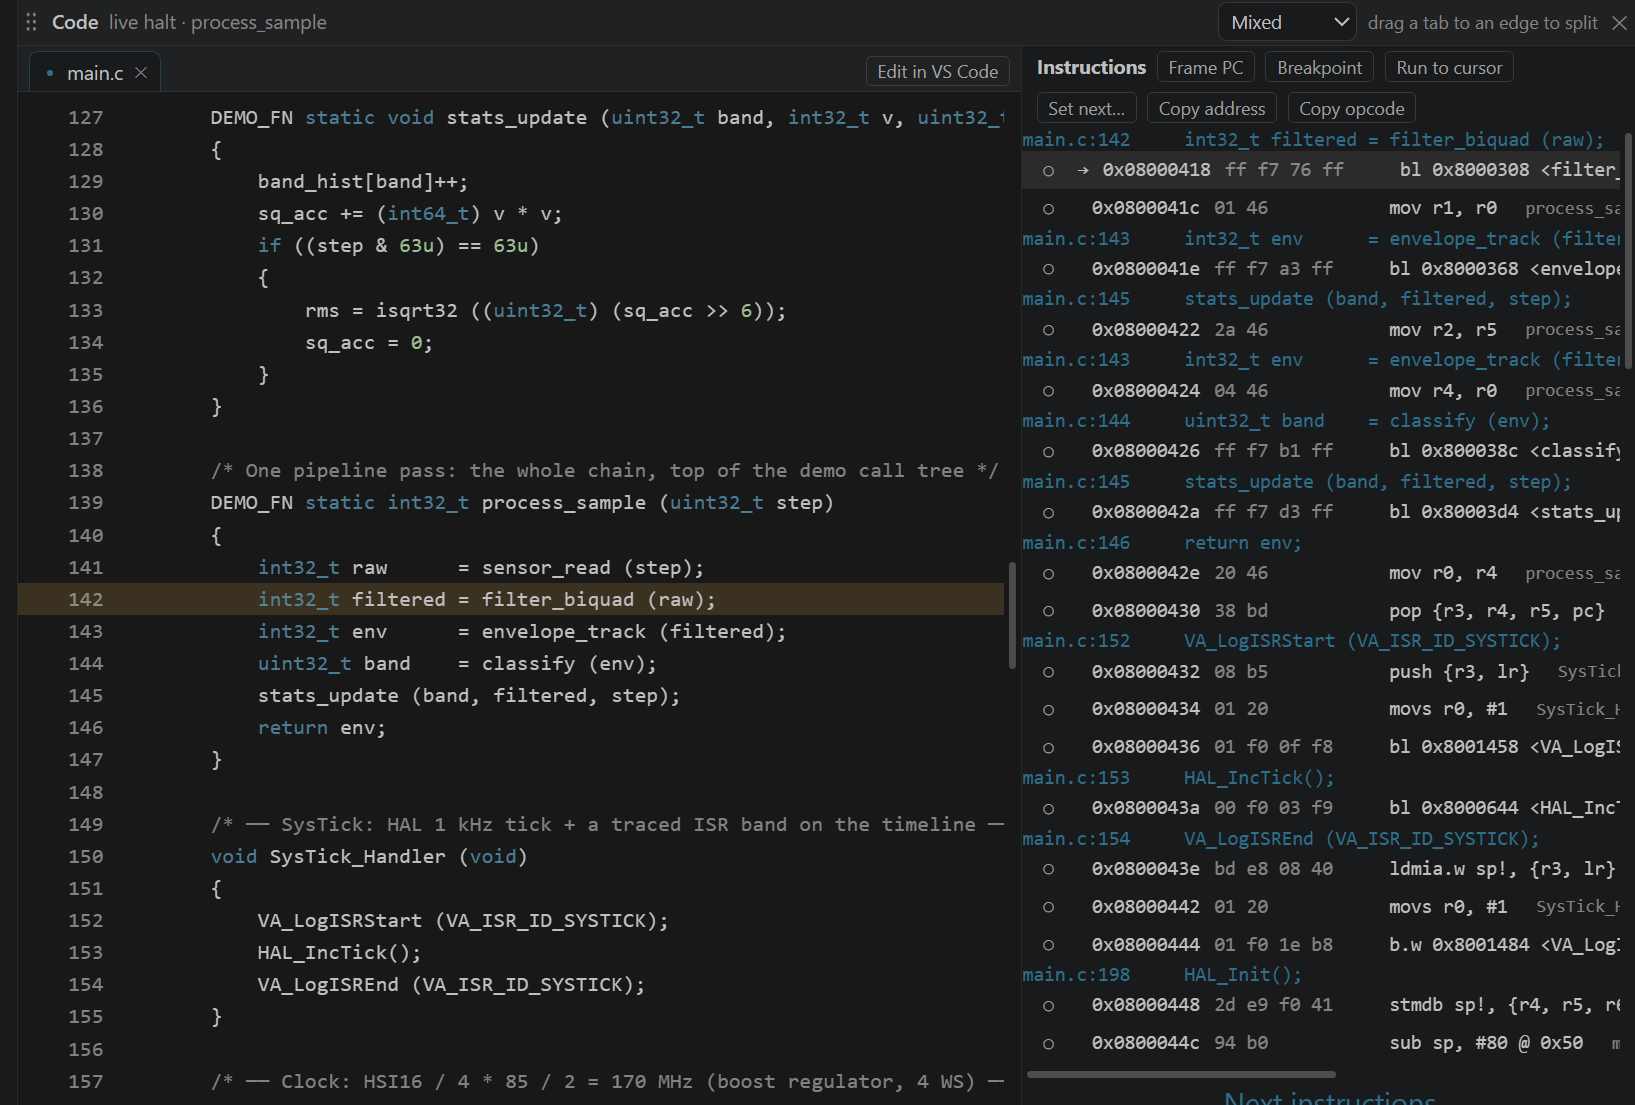
Use Code → Mixed when one C line becomes several instructions, the compiler moves code, or a watchpoint stops just after the access you are investigating. Assembly also works when source lines are unavailable.
Needs: a halted debug session. Matching ELF debug information adds function names and source lines; readable instruction memory is still required when symbols are missing.
Choose a display
| DROPDOWN VALUE | WHAT YOU SEE |
|---|---|
| Source | The integrated source editor, breakpoint gutter, and available sampling heat |
| Mixed | Source with the live instruction pane, including available source annotations |
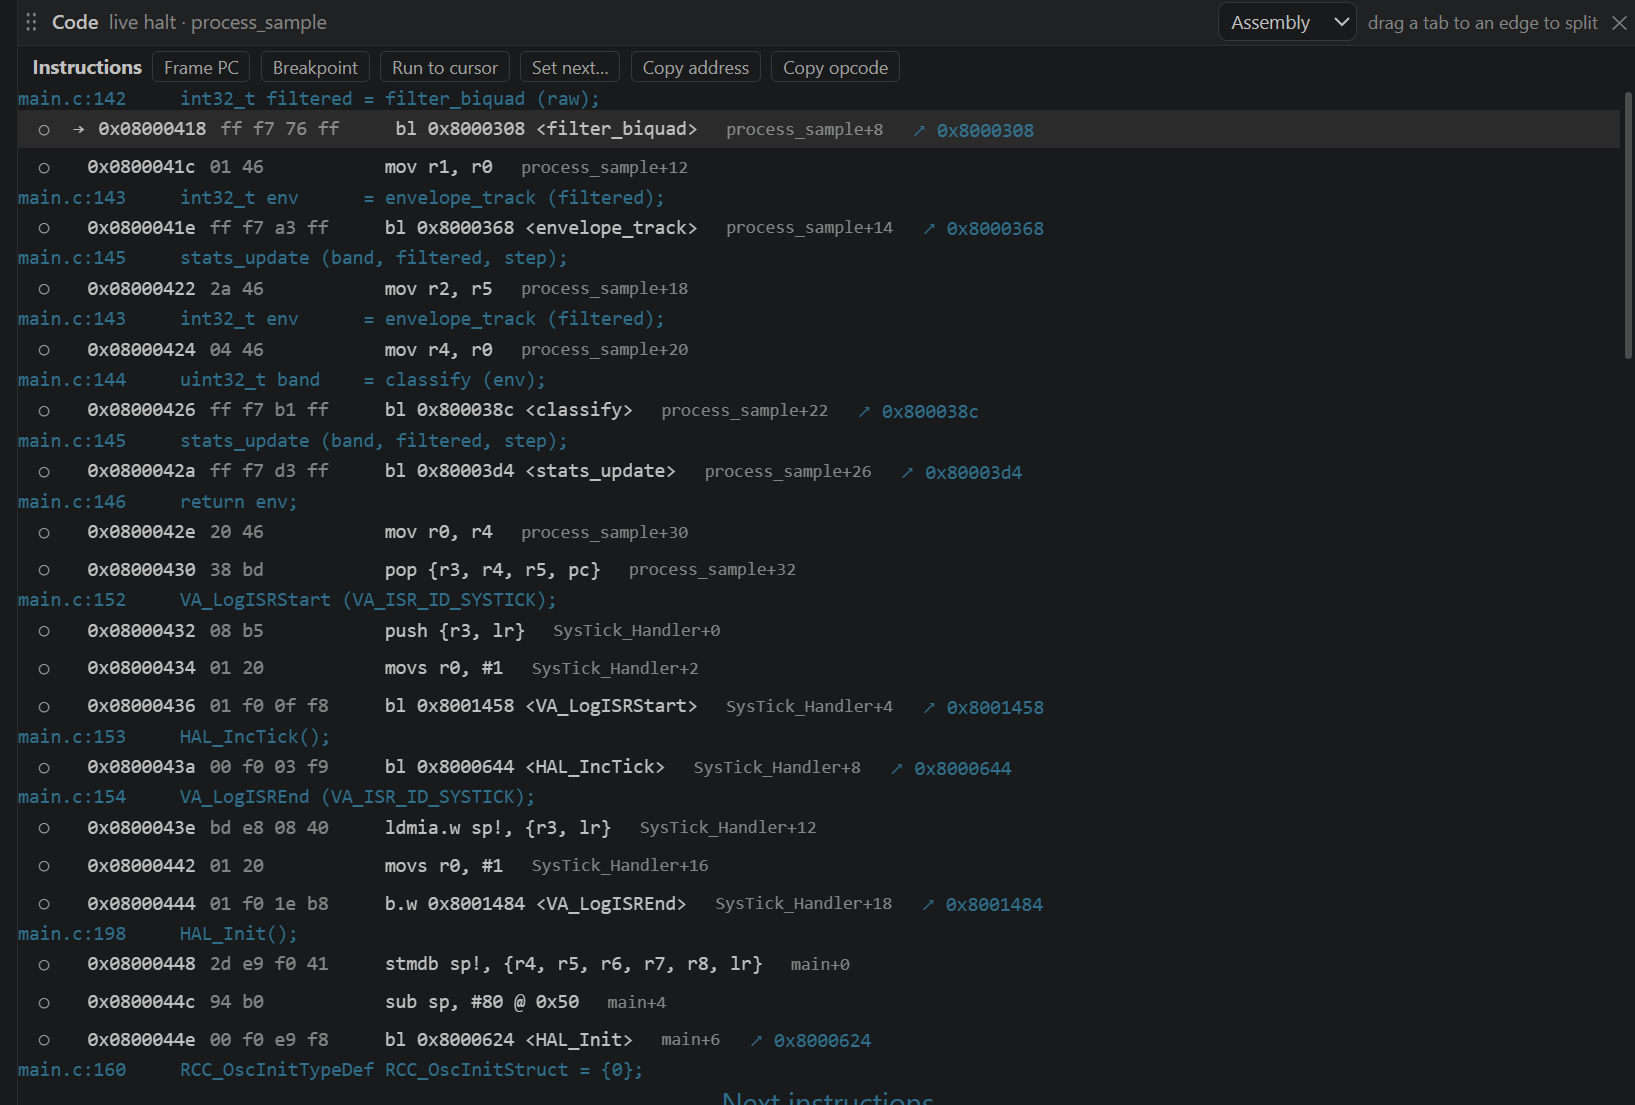
| Assembly | The instruction pane without the source editor |
- Pause in a function or hit a breakpoint.
- Select Mixed in the Code tile's display dropdown.
- Find the → marker beside the selected frame's PC.
- Click an instruction row to select it. The row selection is the operand for the toolbar actions; it does not move the actual PC.
- Use Frame PC to return after browsing a branch target or another page.
Read an instruction row
Rows contain a breakpoint marker, the frame-PC arrow where applicable, address, opcode bytes, disassembled instruction, and available function plus offset. Source annotations identify a file and line; click one to reveal that source location.
A ↗ address link follows a decoded branch target for browsing. It does not execute the branch. Next instructions loads the next bounded chunk; the debugger does not disassemble the whole image on every halt.
Instruction controls
| CONTROL | EFFECT |
|---|---|
| Hollow/filled circle beside a row | Toggle a breakpoint at this exact instruction address |
| Breakpoint | Toggle a breakpoint at the selected row |
| Run to cursor | Resume until a temporary breakpoint at the selected instruction is reached; another breakpoint or fault can stop execution first |
| Set next… | Ask to change PC to the selected address without executing the intervening instructions |
| Copy address | Copy the selected instruction's hexadecimal address |
| Copy opcode | Copy its opcode bytes |
| Frame PC | Browse back to the selected frame's PC |
Instruction breakpoints created here belong to the current session. Source breakpoints are saved through VS Code. If an instruction marker represents an existing source breakpoint at the same address, toggling it off also removes that source breakpoint so the gutter and hardware agree.
For exact execution, use Step one instruction in the main run-control strip or Ctrl+F11. Source Step over/into operate at source-level stepping boundaries; an optimized line may cover multiple, reordered instructions.
Set next
Select frame #0, select a valid instruction boundary, choose Set next…, and read the confirmation. Accepting moves PC while leaving the target halted. It does not run skipped assignments, undo side effects, repair the stack, or initialize the destination's local variables.
Warning: use Set next only when you understand the resulting machine state. Jumping into or out of a function can invalidate its stack frame. Use Run to cursor when you want the program to execute normally on the way to a location.
Run to cursor and Set next require frame #0. A caller frame's PC is its unwound context, not another live CPU. Selecting a different frame or resuming while a confirmation is open cancels that edit.
Missing source or symbols
If source files are unavailable, instructions can still appear with an explanation in the pane. With a stripped ELF, expect addresses and opcodes but fewer names and source annotations. A partially symbolized ELF can show a mixture of named and unnamed rows. Confirm the ELF matches the program on the board before trusting an address or source line.
An invalid/unreadable instruction address produces a visible error. It is not a reason to reset the target automatically. Return to Frame PC or pause at a known location and retry.
Live assembly versus ETM history
The live pane describes instructions around the current selected frame. It does not prove those instructions executed. A sampled PC proves a sample was observed at an address; it is not a complete path through the function.
On a target with supported ETM History, a selected historical execution has its own cursor and an executed marker for the selected decoded instruction. Moving that history cursor does not move live PC or restore old variables. ETM records execution information, not a history of all RAM values. An ITM/SWO connection alone does not provide ETM history; the target needs a supported ETM and trace-sink route.
The ETM execution history tutorial walks through capture, flame navigation, historical disassembly, and the separate live halt with real H7S examples.