 DOCS/VIEWALYZER/EVENT TABLE
VIEWALYZER · GPUI EDITION
DOCS/VIEWALYZER/EVENT TABLE
VIEWALYZER · GPUI EDITION
Event Table
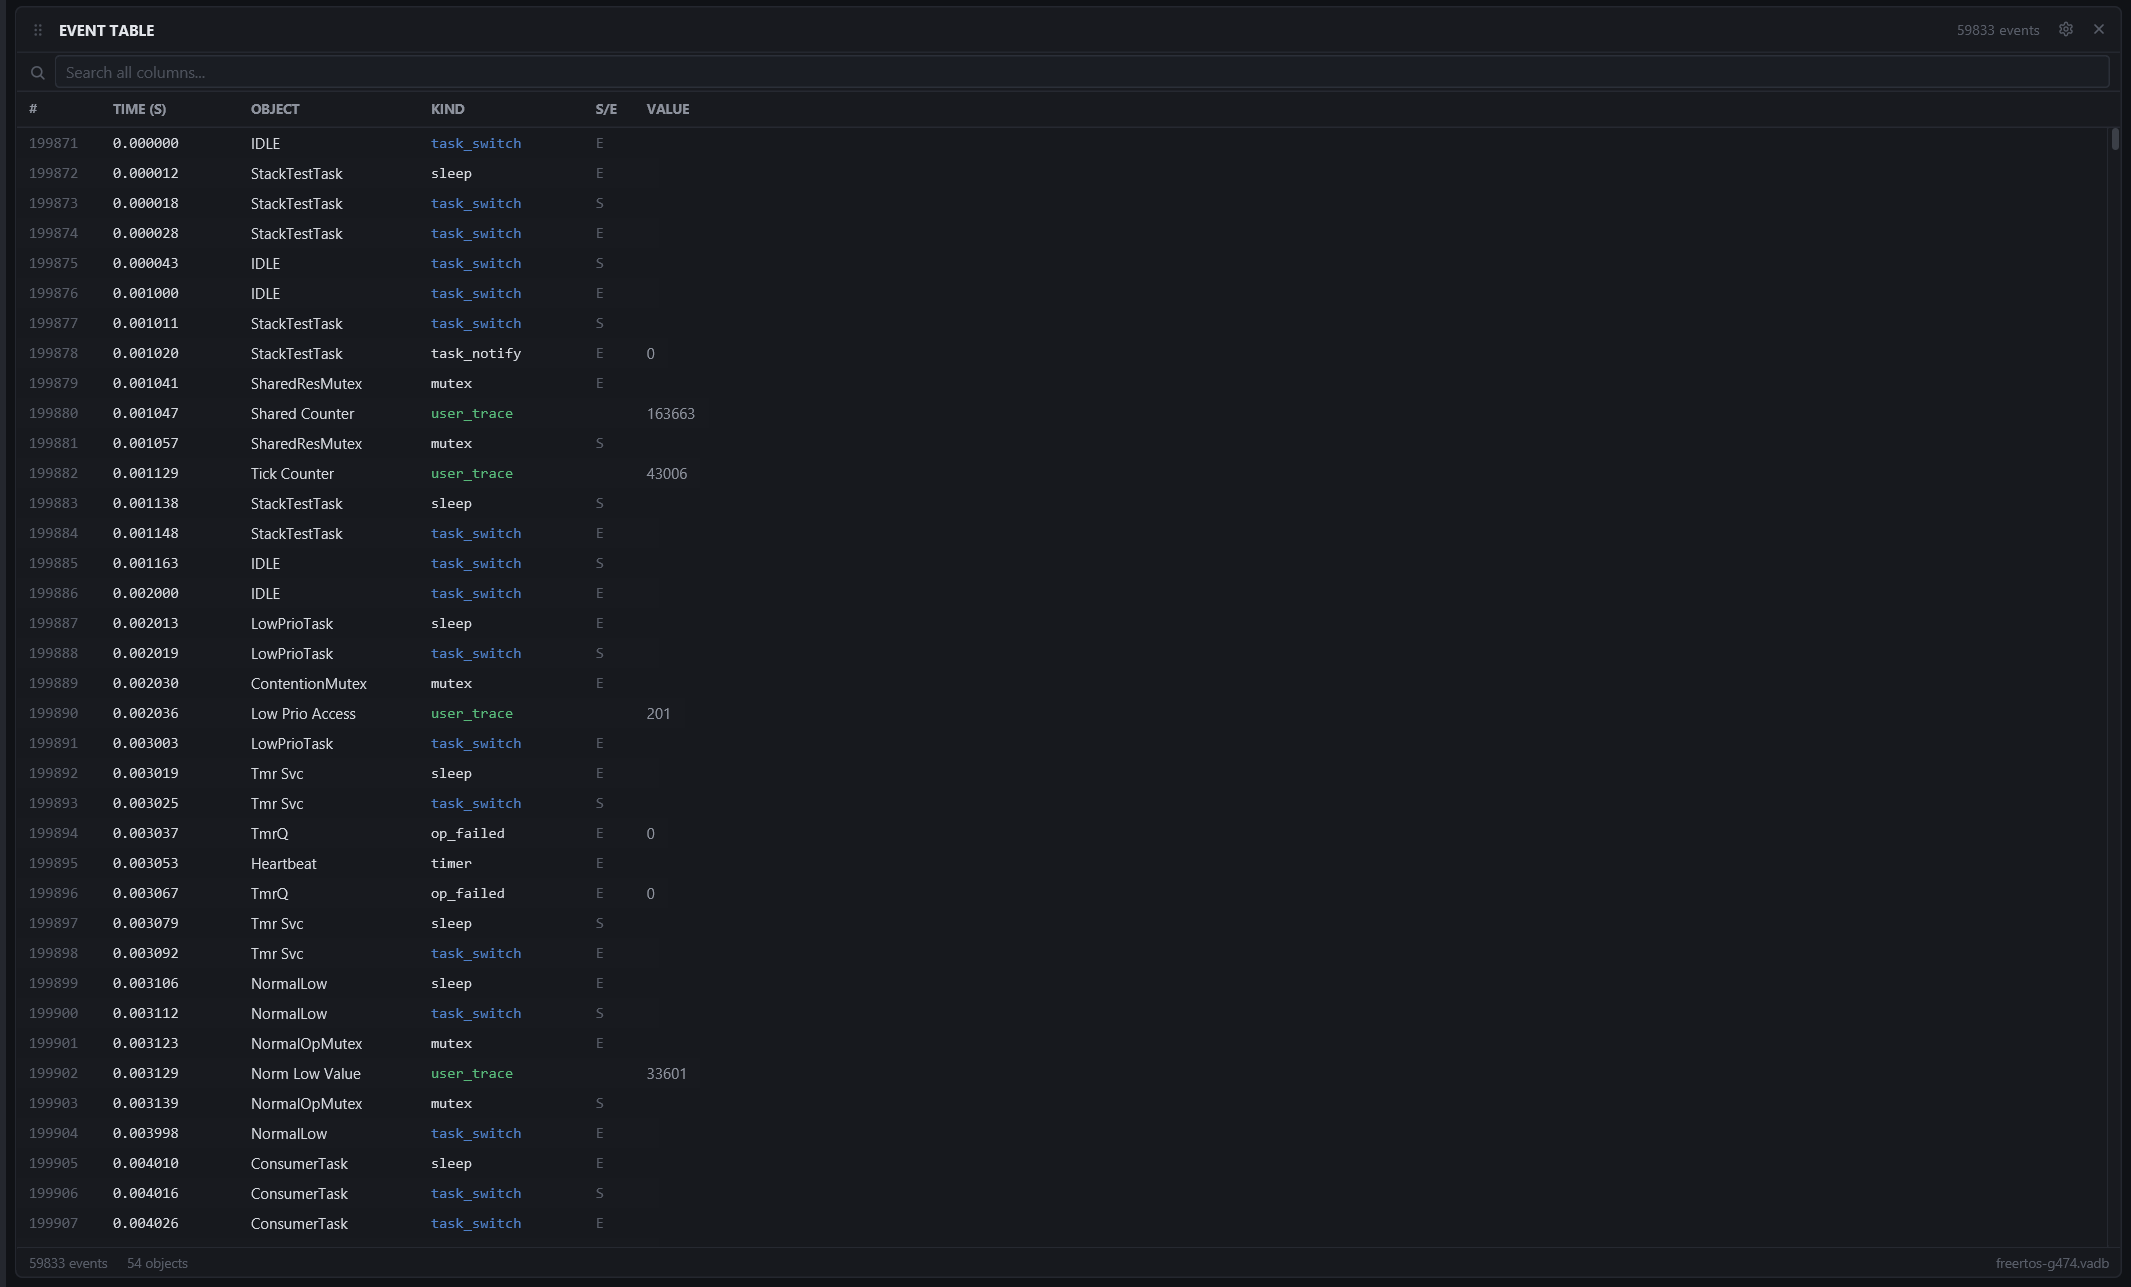
Every decoded event in the recording, one per row, in time order. When the Timeline tells you that something happened, the table tells you exactly what.
Needs: a recording.
Columns
| COLUMN | CONTENT |
|---|---|
| # | The event's number in the recording |
| Time (s) | Seconds from the start of the recording, microsecond resolution |
| Object | The task, interrupt, kernel object or channel the event is about |
| Kind | task_switch, isr, queue, semaphore, mutex, timer, user_trace, string, and so on |
| S/E | Start / end for paired events (task switched in / out, ISR enter / exit, event begin / end, give / take) |
| Value | The payload: a traced value, a string message, a delay, a stack figure |
The gear in the tile header opens the table settings, which hold the Follow cursor toggle described below.
Searching
The search box filters on every column: type an object name, a kind, a value, or s / e for start or end events. The filter stays until you clear it, and other views set it for you: Show raw events in the Timers and Comms inspectors, or a double-click on a task row in the CPU view, narrow the table to that object's raw events.
Following the cursor
With Follow cursor on (the gear in the tile header), the table keeps the event nearest the shared cursor centred, so hovering over the Timeline or a chart scrolls the table to the events under the pointer. Pin the cursor (Sticky Cursor) to hold it there.
Double-click a row to go the other way: the Timeline and the charts jump to that event and the cursor pins on it with a flash. The next click anywhere releases the cursor.
Tips
- The User tab of the log holds the firmware's string messages on their own, without the surrounding events; the table has them in context.
- The row selected by a Timers or Comms jump is the store event behind that fire or that receive, which is the fastest way to see what else happened in the same microseconds.