 DOCS/VIEWALYZER/TIMELINE
VIEWALYZER · GPUI EDITION
DOCS/VIEWALYZER/TIMELINE
VIEWALYZER · GPUI EDITION
Timeline
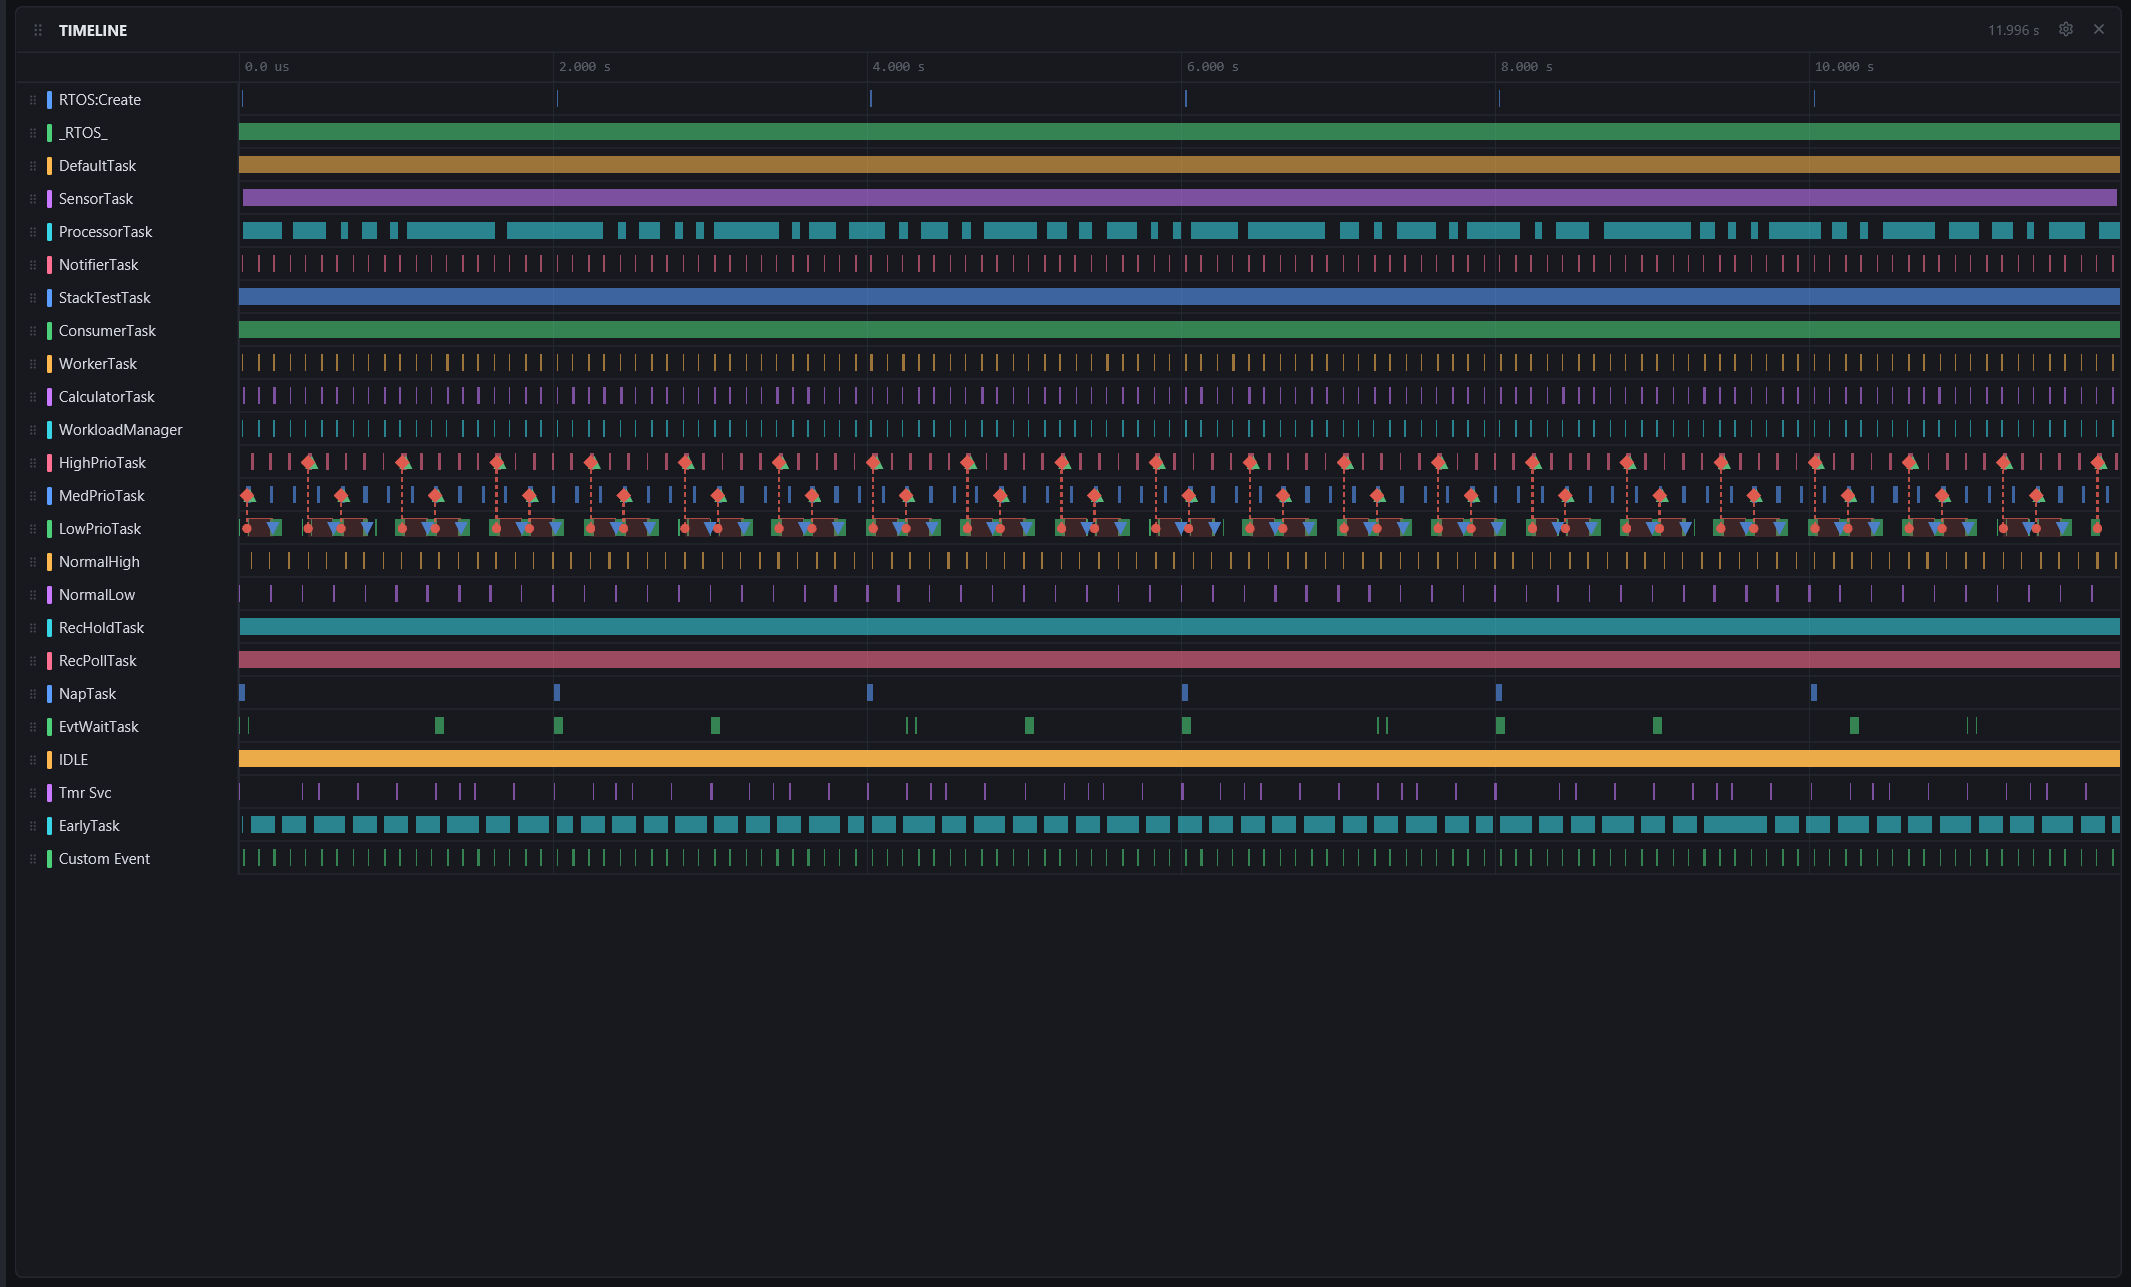
The Timeline draws what ran when: one lane per task, per interrupt handler and per user event, with a filled bar wherever that thing was executing. It is the anchor of the workspace: every other view that can jump to a moment jumps here.
Needs: a recording (it fills in when a capture stops).
Reading it
- Lanes are ordered tasks, then interrupts, then user events, each with a colour bar in the name gutter.
_RTOS_is the scheduler itself (the gaps between task slices on an RTOS capture);RTOS:Createmarks task creation. - A bar is a slice: the task ran from its left edge to its right edge. At spans where slices are narrower than a pixel the lane shows a density shading instead, so a lane that is busy 30 % of the time reads as 30 % bright.
- A coloured diamond on a waiting task joined to a dot on a mutex holder marks a priority inversion. Each mutex has a stable, high-contrast colour (red for the first or only mutex), and readable labels include its name and the waiter-to-holder relationship. The translucent interval shows how long the lower-priority holder retained the mutex; the waiter's line runs until it acquired the mutex. These phases stay visible when the original contention point is beyond the viewport edge. At a readable zoom the phases and state changes are labelled contended, blocked, holding, acquired, and released. Dense views pixel-decimate nearby links and omit labels that cannot fit.
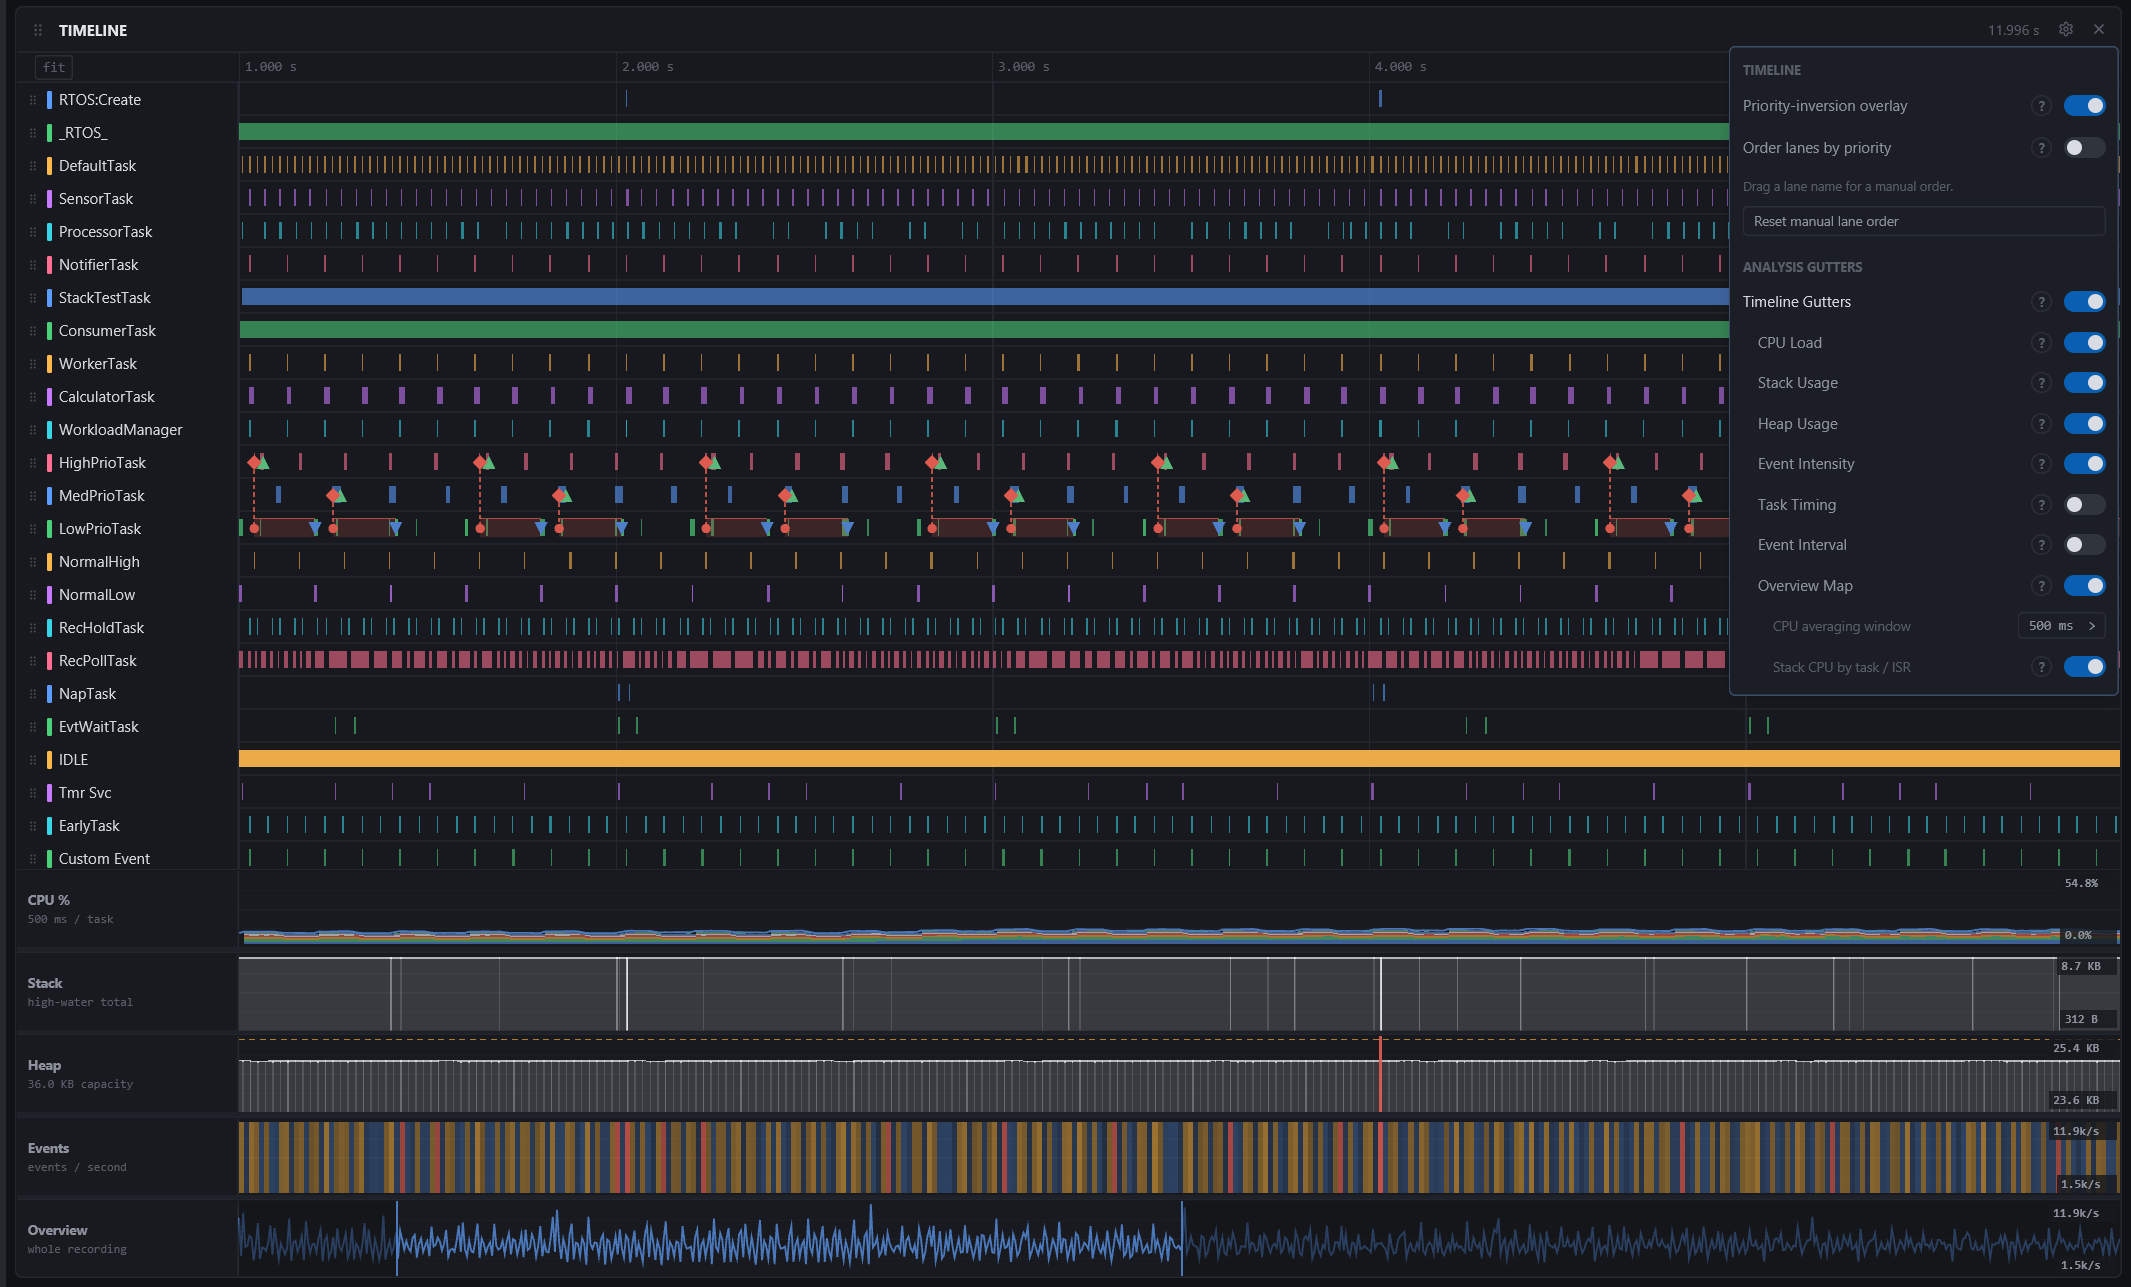
- Drag a lane by its name in the left gutter to arrange the lanes manually. The Timeline gear can instead order task lanes by OS-aware priority (lower numbers first on Zephyr; higher numbers first on FreeRTOS), reset a manual order, or hide the priority-inversion overlay when it would distract from the schedule itself.
- The ruler along the top shows the visible window; a chip on it follows the hover cursor, and an amber chip the pinned cursor.
Task states
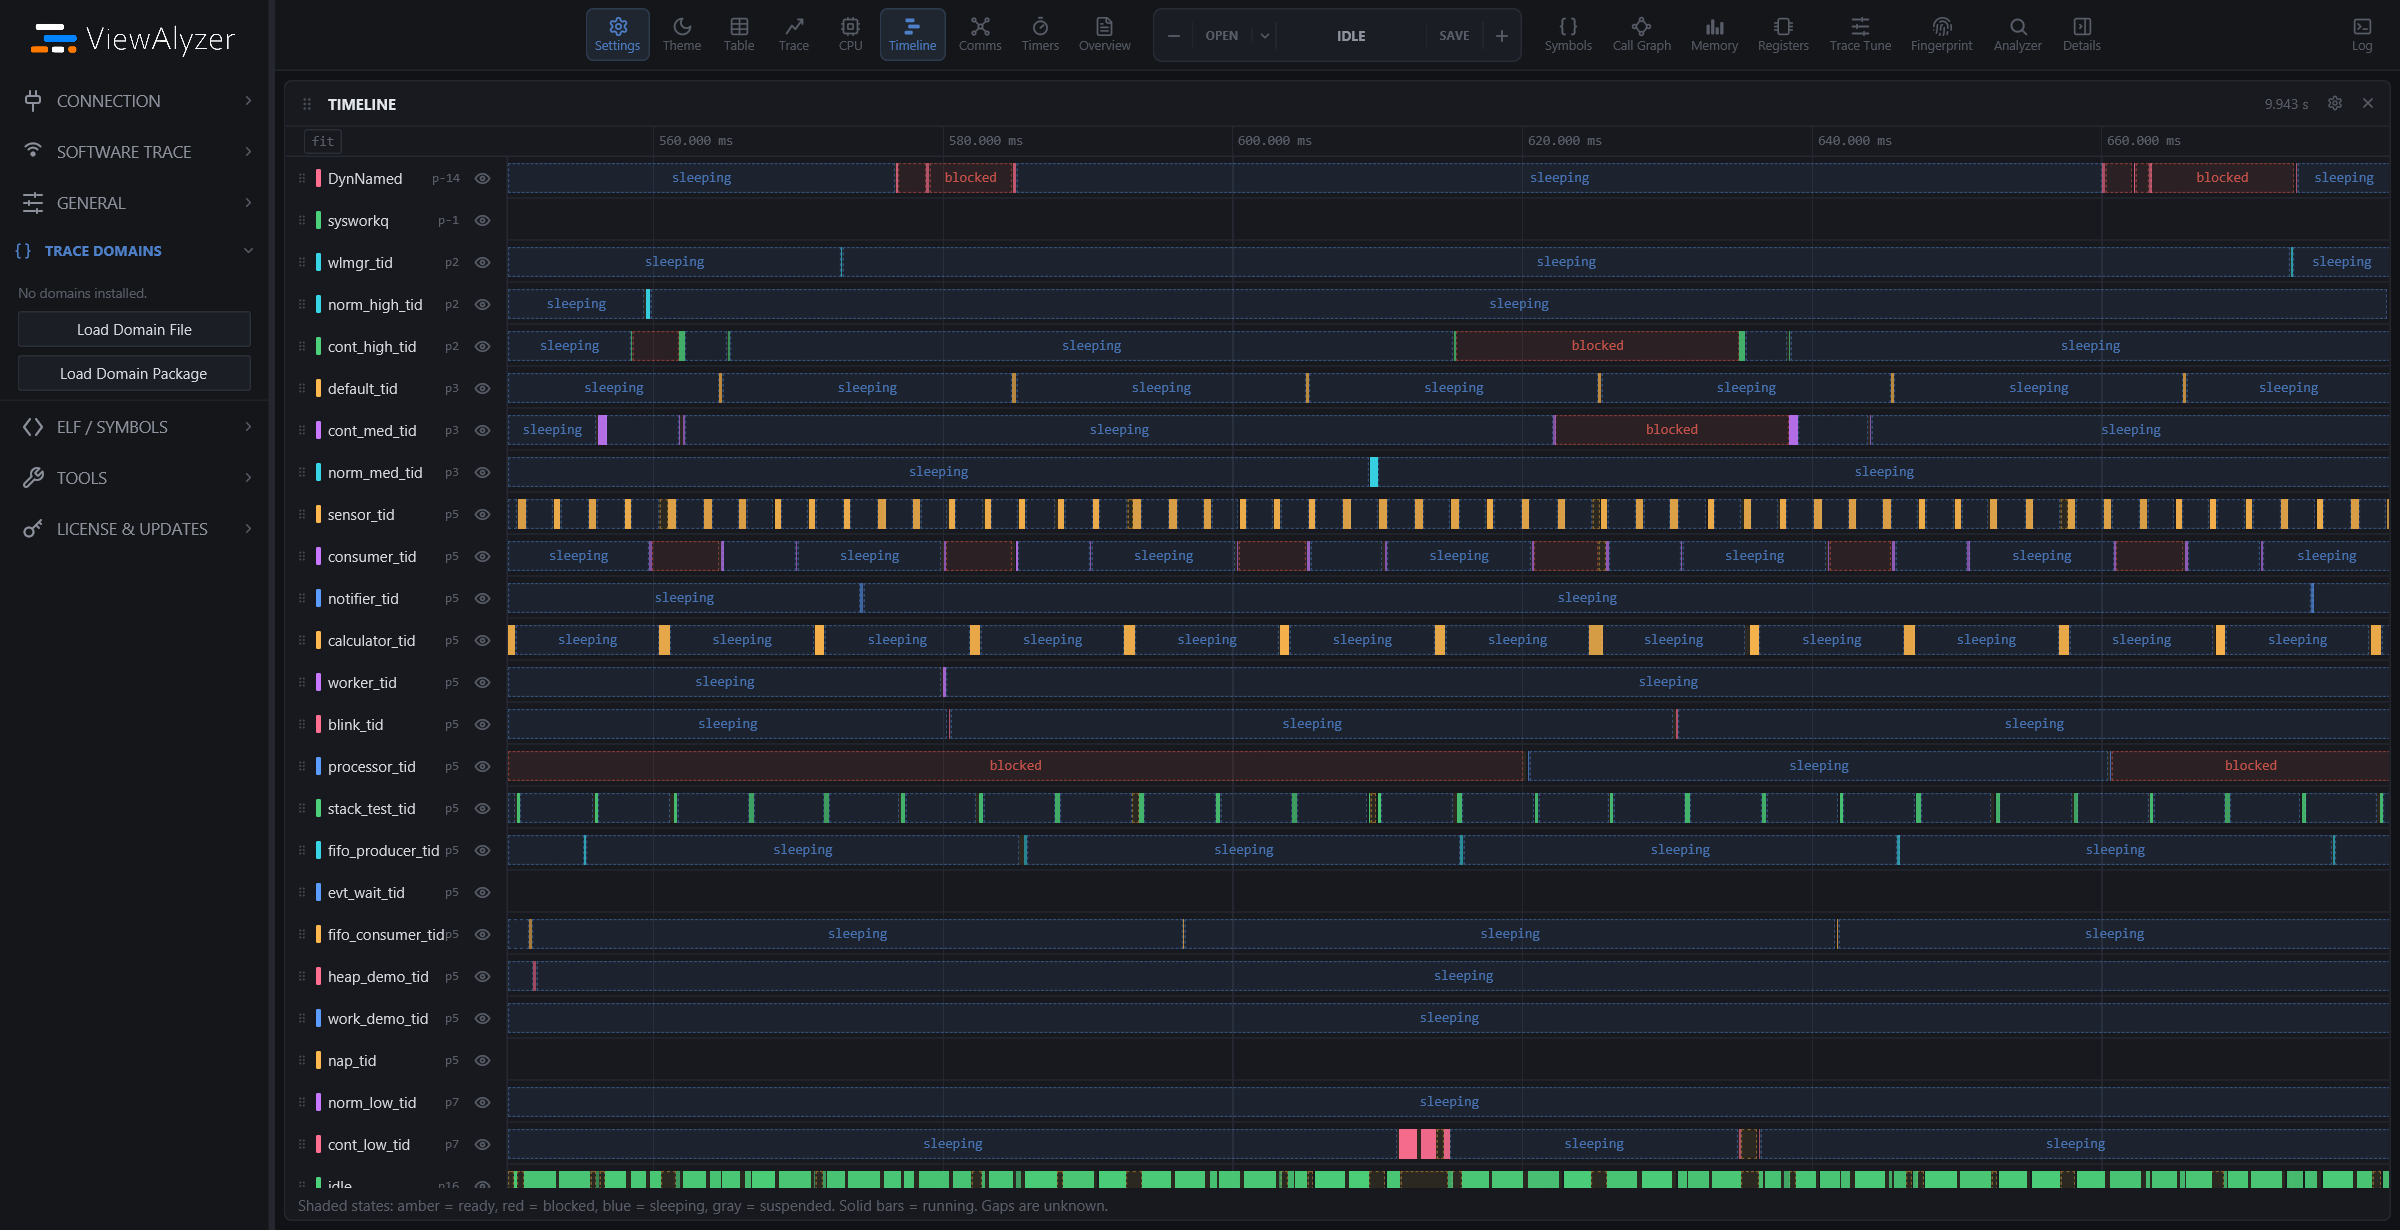
Open the Timeline gear and use Show task states, below the priority-order control, to show or hide the dashed state areas between execution slices. The setting is saved with your workspace. Ready is amber, blocked is red, sleeping is blue, and suspended is gray. Solid bars show execution.
Labels appear only when the state name fits inside its interval. Zooming out removes the text before it can overlap execution slices. With the corresponding recorder hooks disabled, or in a recording without state events, no state areas are drawn; unexplained gaps remain unknown.
Analysis gutters
The Timeline gear can add resizable, time-aligned analysis rows below the scheduler lanes. CPU Load, Stack Usage, Heap Usage, Event Intensity, Task Timing, Event Interval, and an Overview Map can be enabled independently. When the rows need more room than the tile has, their section scrolls without squeezing the scheduler lanes away.
- CPU can show either total load or stacked task/ISR contributions, with a 50 ms, 100 ms, 500 ms, or 1 s averaging window.
- Stack is the reported high-water total. Heap is sample-and-hold across allocation/free reports; its dashed line is the reported capacity and red markers are failed allocations.
- Task Timing can plot execution time or activation period for a selected lane. Event Interval measures between selected task, trace, or resource endpoints.
- The Overview Map always spans the full recording and shades the current zoom window. Drag it to scrub through a zoomed recording.
- Drag the divider below a gutter to resize it. Heights, enabled rows, and selectors persist in the workspace settings.
The shared cursor and selected-region shading cross every gutter. Double-click a gutter to select the nearest Event Table row, and click one of its extrema labels to jump to that sample.
Moving around
| GESTURE | EFFECT |
|---|---|
| Wheel | Scroll the lane list |
| Ctrl+wheel (Cmd on macOS) | Zoom the time axis around the pointer |
| Shift+wheel, or a horizontal wheel | Pan |
| Drag | Pan (the point you grabbed stays under the pointer) |
| Ctrl+drag (Cmd on macOS) | Select a time range while dragging, then zoom every synchronized time view to it on release |
| Ctrl+right-click (Cmd+right-click on macOS) | Add another measurement marker |
| Double-click | Pin that time and centre/select the nearest visible Event Table row |
| fit chip in the ruler | Back to the whole recording |
| Hover | Moves the shared cursor; its time shows in the gutter |
| Click | Pins the cursor when Sticky Cursor is on (click the same spot to release); also selects the slice under the pointer for the Details view |
| Shift+move | Sweeps the selected region from where Shift went down; Escape clears it |
Measurement markers are shared by the Timeline and every time-based Trace chart. Their A/B/C/... grabbers live in each time strip for fine adjustment, with the delta shown for every adjacent pair. Labels always follow time order, so dragging a marker past another automatically relabels both. Panel headers summarize the number of intervals and keep Clear markers available; use it in either header to remove all measurements and any CPU outlier markers.
The zoom window, cursor and region are shared with the charts, the CPU scope and the Timers and Comms views (see the shared time model).
What jumps here
- Double-click a row in the Event Table: the window centres on that event and the cursor pins there with a brief flash.
- Click a finding in the Analyzer, a tile in the CPU view, a violation in Timers or an exchange in Comms.
- Click a task's bordered Outliers value in the CPU table to mark every concrete activation-period outlier for that row and jump to the first one.
- After any of these the next click anywhere releases the pinned cursor.
Tips
With scheduler-state tracing enabled, faint fills with dashed borders show ready (amber), blocked (red), sleeping (blue) and suspended (gray) intervals across each task lane. State labels appear when a span is wide enough as you zoom in. Solid bars show CPU execution. Select a task slice for its previous wait reason, effective/base priority at that time, completed ready/blocked time and maximum wake-to-run latency in Details. A priority change affects contention classification from that point forward. Missing events and capture boundaries are excluded from completed latency measurements; older recordings do not acquire inferred wait states.
- A slice outlined in amber is the one the Details view is describing.
- The dimmed part outside the selected region is exactly what the CPU view excludes when its scope is set to Selection.