 DOCS/VIEWALYZER/OVERVIEW
VIEWALYZER · GPUI EDITION
DOCS/VIEWALYZER/OVERVIEW
VIEWALYZER · GPUI EDITION
VIEWALYZER · VIEWS
Overview
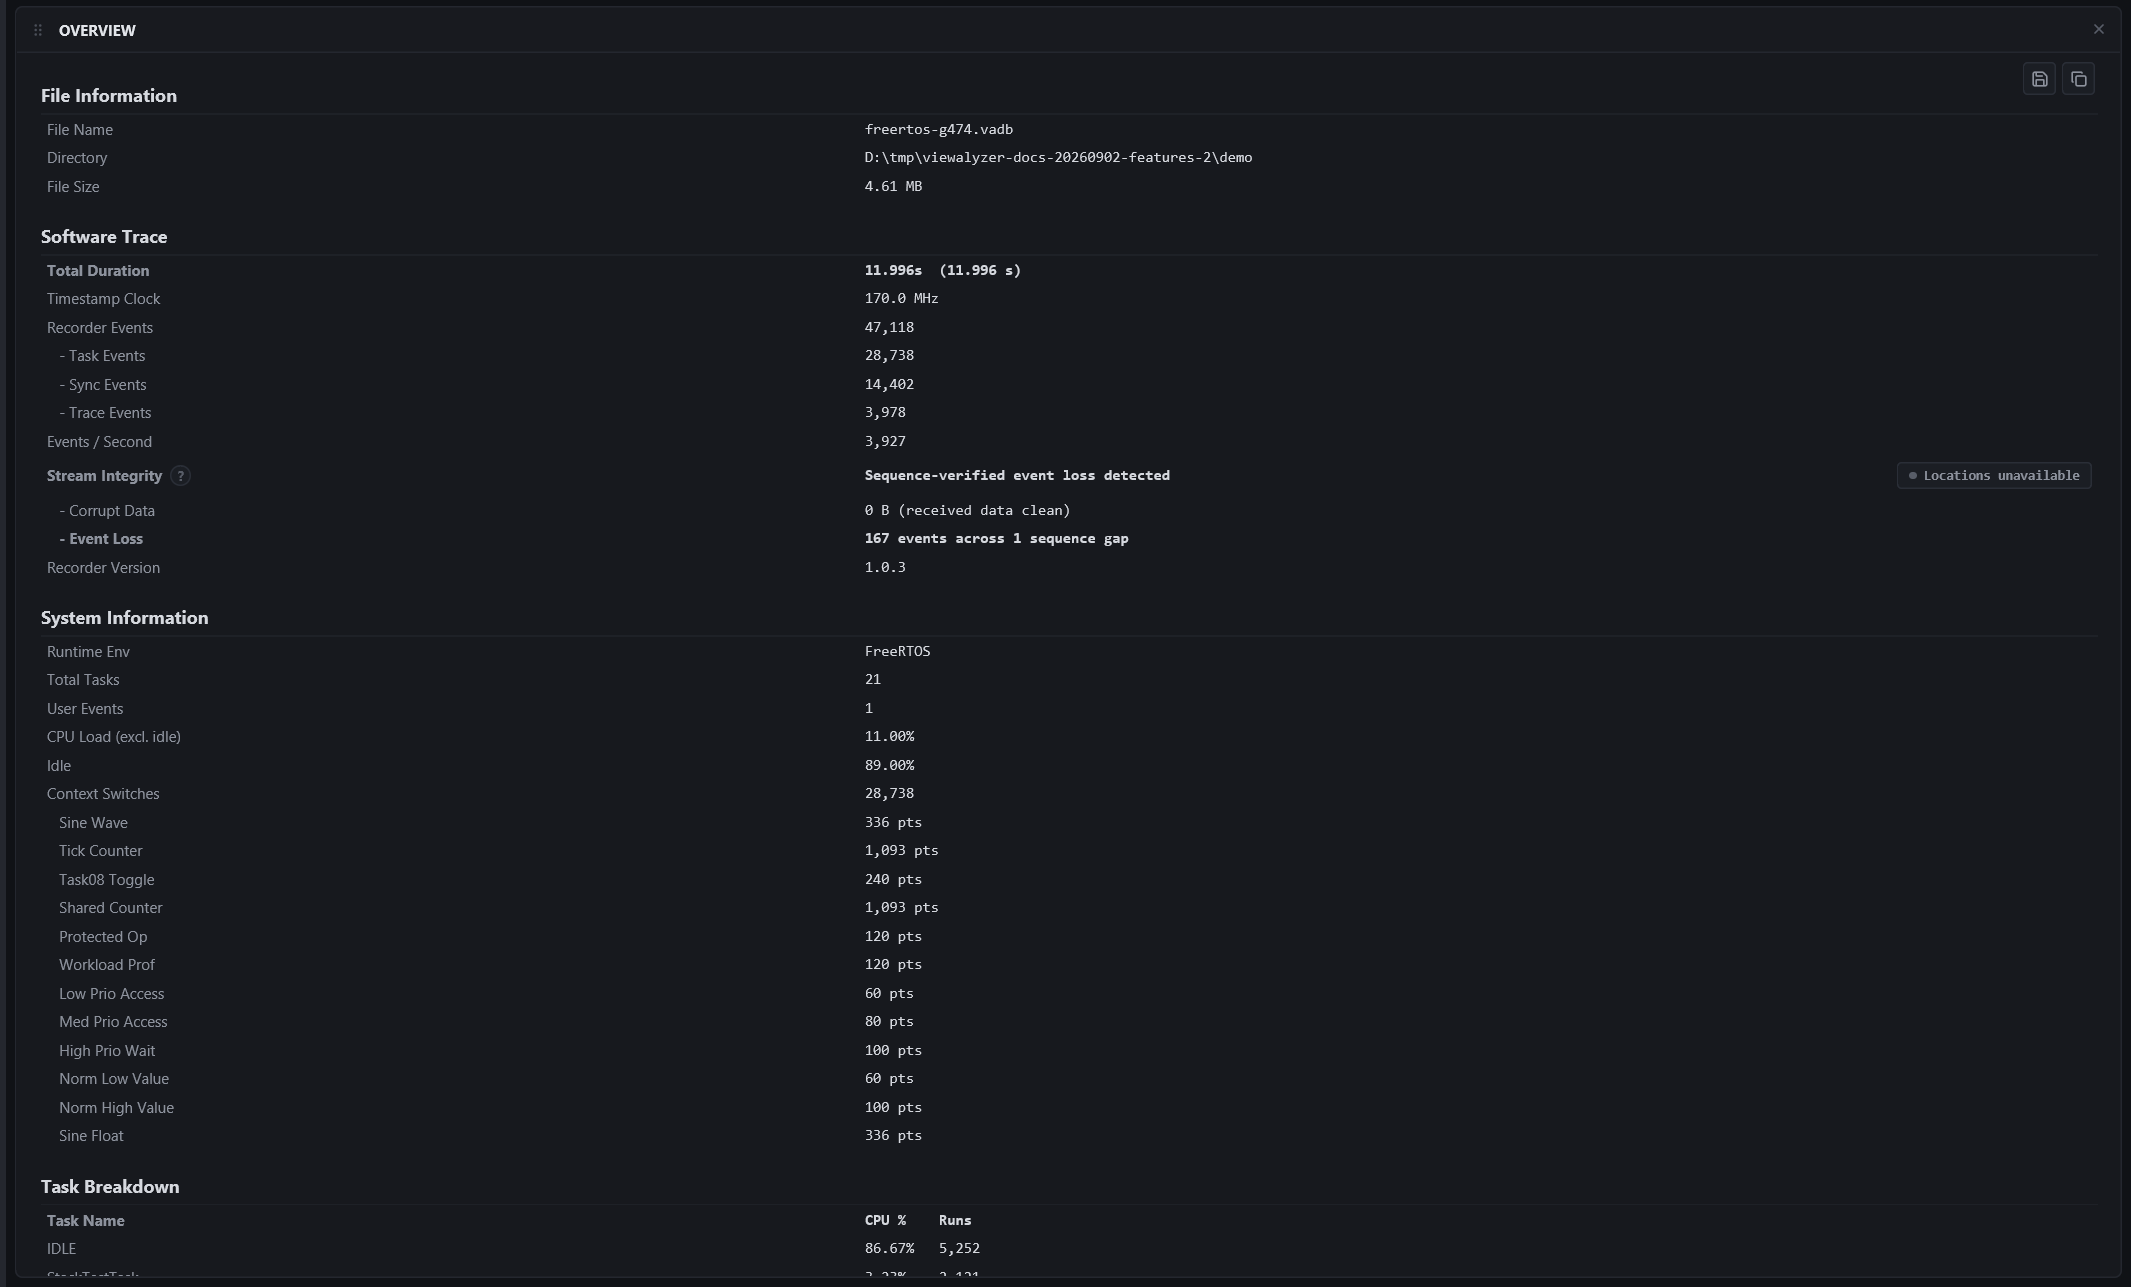
A report-style summary of the loaded recording, written to be read top to bottom and pasted into a bug report.
Needs: a recording. The memory section needs an ELF.
Sections
| SECTION | CONTENT |
|---|---|
| File Information | The file's path and size, and when it was captured |
| Software Trace | Transport and decode statistics: events, losses, the recording's span and clock |
| Domain Trace | When enabled Trace Domains contributed channels or verdicts: what they sampled and found |
| System Information | The RTOS and CPU clock the firmware reported, task and interrupt counts |
| Task Breakdown | One row per task: CPU share, runs, stack headroom |
| Memory Summary | Flash and RAM totals of the build, from the ELF set under ELF / Symbols |
| External Instrument | When a bench instrument's series were merged into the recording: the instrument, its channels and the clock sync figures |
Copy
The Copy button puts the whole report on the clipboard as Markdown, with tables that render in an issue tracker or a chat message. It is the fastest way to describe a recording to someone who does not have the file.
Tips
- Losses in the Software Trace section are the first thing to check when a recording looks incomplete: the recorder counts every packet it had to skip, and the number lands here.