 DOCS/BKPT DEBUG/LIVE WATCH
BKPT DEBUG · VS CODE
DOCS/BKPT DEBUG/LIVE WATCH
BKPT DEBUG · VS CODE
Live watch
The Symbols tile works on any firmware, no recorder library, no code change. Pick variables from your ELF and each one shows its live value in the row or draws as a graph, while the target runs and at every step.
Needs: the ELF. A session for live values; without one, the same watch set records into a capture (see Recording a trace).
Picking symbols
Type in the search box to filter the ELF's data symbols; + on a row activates it as a watch row. Each row has a type dropdown (the width and signedness the bytes are read as) and two switches:
- table: the live value in the row;
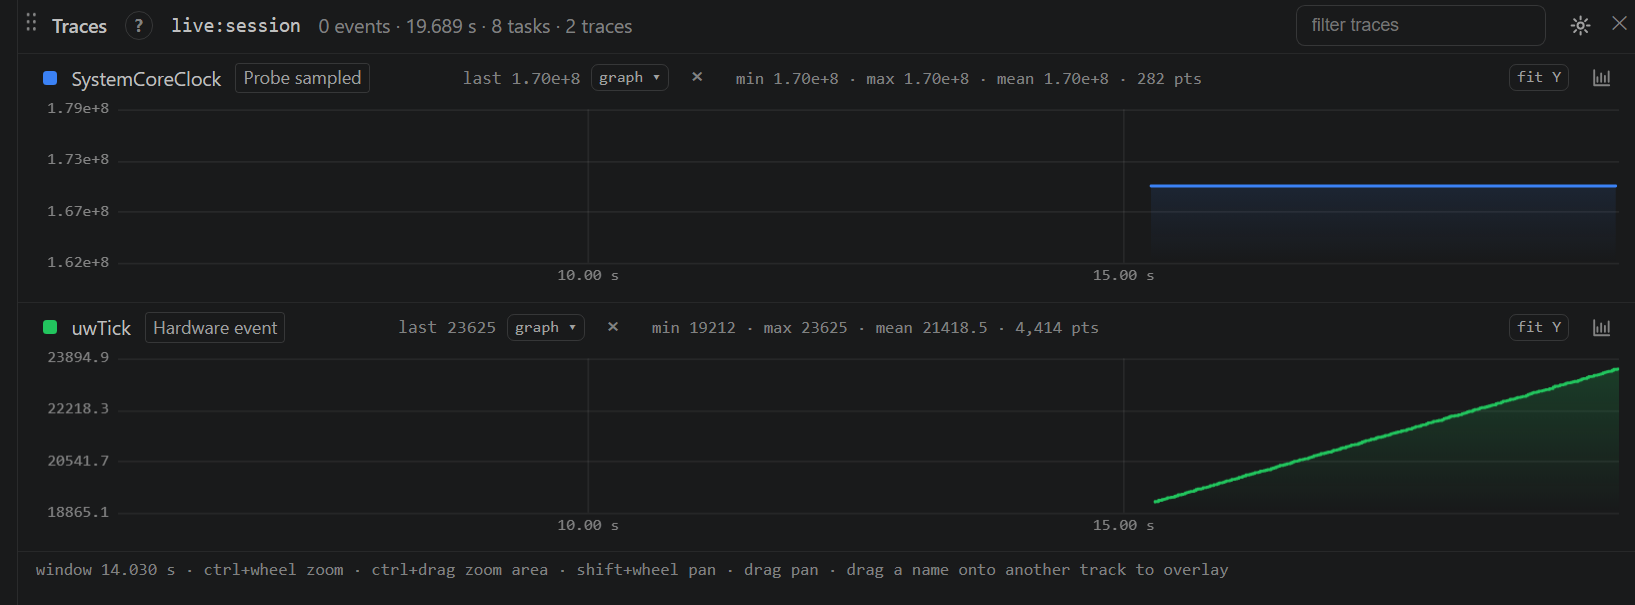
- graph: the value streams into the Traces tile as a channel. The track follows the live edge; a zoom or drag parks it on history and a live chip appears to bring it back, and fit Y refits the value axis whenever the window looks wrong.
The watch set is kept per workspace.
Check: a changing variable such as the G474 example's uwTick shows a changing table value after Continue. Enable graph and open Traces to see its history. Pause stops the running graph; the table can show a separate halted snapshot. SystemCoreClock is useful as a constant check, not a variable you should expect to animate.
Type, acquisition, and source are different choices
| CONTROL | MEANING |
|---|---|
Type (u8, u16, u32, i8, i16, i32, f32) | Unsigned integers, signed integers, or a 32-bit float. The number gives the bit width used for acquisition. Choose the actual memory type; the wrong width can read neighboring bytes. |
| table | Show the current watched value in Symbols |
| graph | Retain/draw a numeric series in Traces |
| acq | Choose ordinary probe acquisition or an available dwt:N streaming slot |
| Source badge | The producer that actually supplied the displayed observation; hover for timing and health |
These are live-memory watches. The natural/hex/decimal/binary/signed/float/string dropdown in Variables is a separate halted-value display control, and Break on… creates a stop watchpoint.
While a session runs
The rows update while the target runs and after every step, read over the probe's live memory channel at the requested rate in the Symbols title bar; the effective rate depends on the connection and selected watches. Graphs freeze at a halt and resume on continue, so a stepped section does not draw as a flat line. Values are read whole (one 32-bit read for a 32-bit variable), but multiple watched values are not a simultaneous snapshot. Probe-bus access, memory/cache behavior, and firmware updates all affect what you see. Do not use a multi-row table as proof that the values coexisted at one instant.
Hardware data watch
Where the Target scan found DWT comparators, a row's acq dropdown offers streamable slots (dwt:1..dwt:N, at most four, each usable by one row). On a session running on-chip trace over SWO, the chip then emits the value on matching CPU writes without repeated probe reads, and the values land on the row and its graph; the Hardware Trace tile lists every slot with the variable it traces. A DWT-selected row is not silently polled while its trace path is unavailable. Select poll yourself if you want probe samples instead. A slot requested while the target runs may wait until the next halt.
The selected acquisition is a request. Read the observation badge to tell whether the retained data is DWT trace, previously selected polling, or a halt snapshot. A saved DWT request also appears as Trace in Data watchpoints; its status and hover explain acceptance or failure. DWT does not capture autonomous DMA writes, and SWO loss can make delivered writes incomplete.
Read the graph
Zoom or pan to stop following the right-hand live edge. Choose live to resume following, and fit Y to refit the vertical value axis. Hover the source badge for the requested/actual interval and loss scope when those details are reported. A source change keeps previous data's provenance; old polling points do not become DWT observations.
Closing Symbols or Traces reduces rendering work but does not disable an active watch. Remove its watch or change its acquisition to stop the underlying data collection. Keep only the channels and rates needed for the investigation, especially over a remote probe connection.
Tips
- Symbols selects whole ELF data symbols. For a member or array element at a halt, use Variables expressions; use its Break on action to stop on an addressable member without changing firmware.
- A watch on a symbol the flashed firmware does not have is reported in the Output channel and skipped; the session goes on.