 DOCS/VIEWALYZER/PROFILER
VIEWALYZER · GPUI EDITION
DOCS/VIEWALYZER/PROFILER
VIEWALYZER · GPUI EDITION
Profiler
A statistical program-counter profile: the hardware samples where the CPU is executing, the samples are resolved against the ELF, and the result is a function table, a hotspot list and annotated source. No firmware support is needed; the profiler is live while recording.
Needs: Profiling Source set to Sampling or On-chip trace (Hardware Trace section), an ARM target, and the ELF File set. Where the samples come from is on the Profile line under the switch: over the SWO pin the chip emits a sample every N cycles (every 16384 under Sampling, the PC Sample Interval under On-chip trace); with the RAM Buffer or RTT source the app polls the PC register over the debug port instead (roughly 190 samples per second over ST-LINK). The Hardware trace page has the details. Source Root lets the Source view find files recorded under another path.
Counts are samples, never exact hits: a function at 10 % of samples uses about 10 % of the CPU, and a handler that runs for 20 µs every second may never be sampled at all.
Three panels
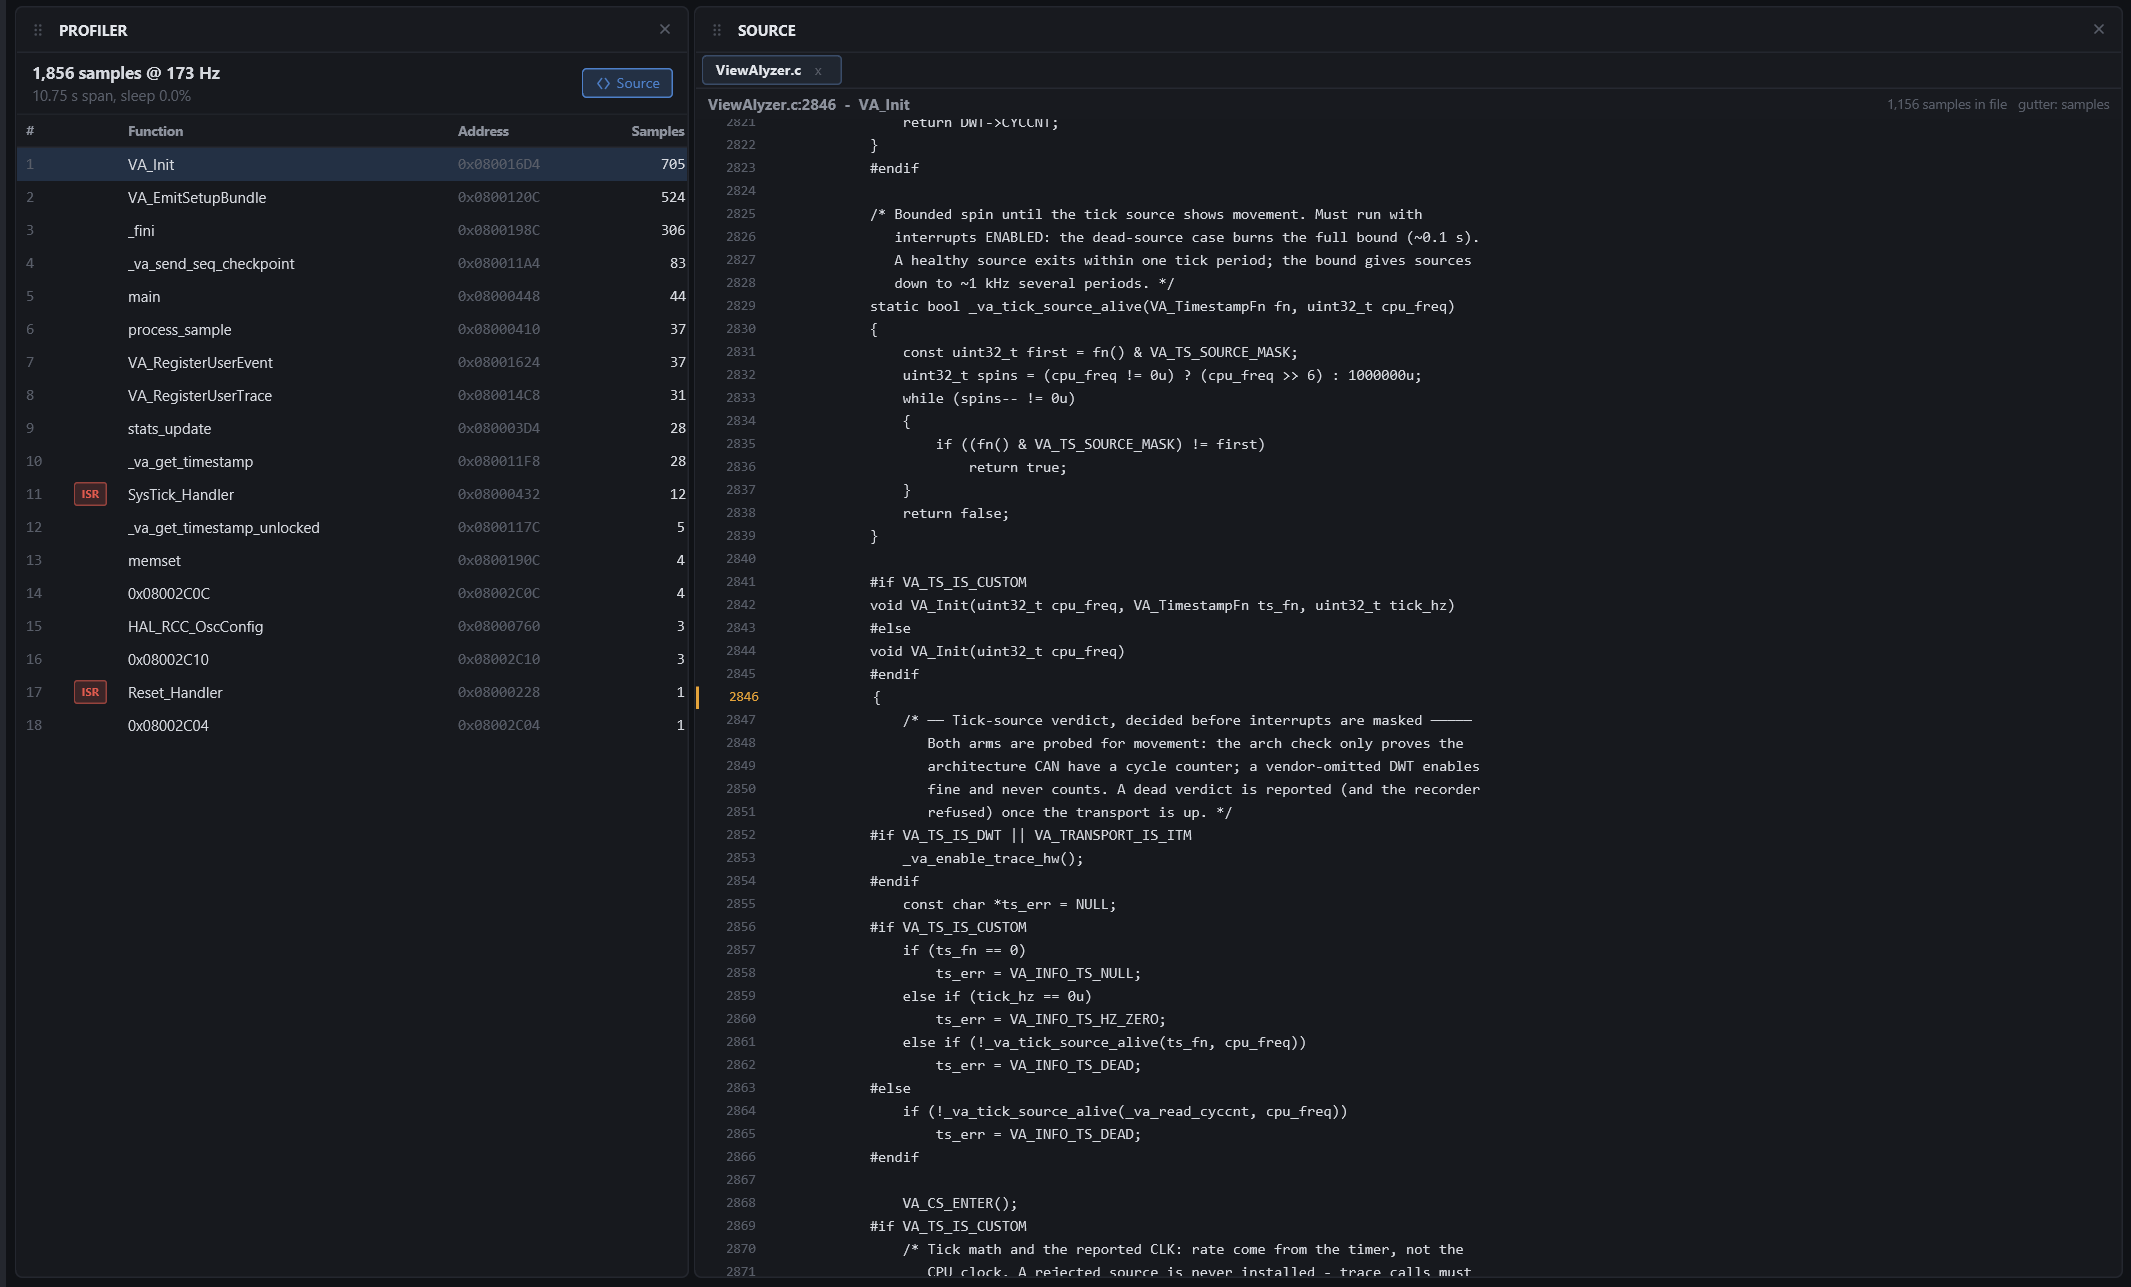
- Profiler: a statistics band (samples, span, the share of samples outside the ELF, live CPU load while recording) over the function table.
- Function Profile: the table alone, for tiling next to something else.
- Source: one tab per opened file with per-line sample counts in the gutter. Tabs can be dragged onto another tile's edge to split the source area, so two files sit side by side.
The table
One row per function: samples, share, and while recording a Recent column with the last two seconds so you can watch a hotspot move as the firmware changes state. Functions whose address sits in the exception vector table carry an ISR badge. Click a row to open its source at the hottest line; Source in the band reopens the Source panel if you closed it.
Live
The table re-buckets a few times per second and the open source tiles update as samples arrive. Sleep samples (the CPU in WFI) are counted apart from code, so the live load figure is the non-sleep share.
Tips
- A large "outside ELF" share usually means the ELF does not match the firmware on the board.
- Interrupt handlers with a low share are normal at these sample rates; use the Timeline's ISR lanes for their timing, and the profiler for where the bulk of the cycles go.