 DOCS/VIEWALYZER/EXCEPTION TRACE
VIEWALYZER · GPUI EDITION
DOCS/VIEWALYZER/EXCEPTION TRACE
VIEWALYZER · GPUI EDITION
Exception Trace
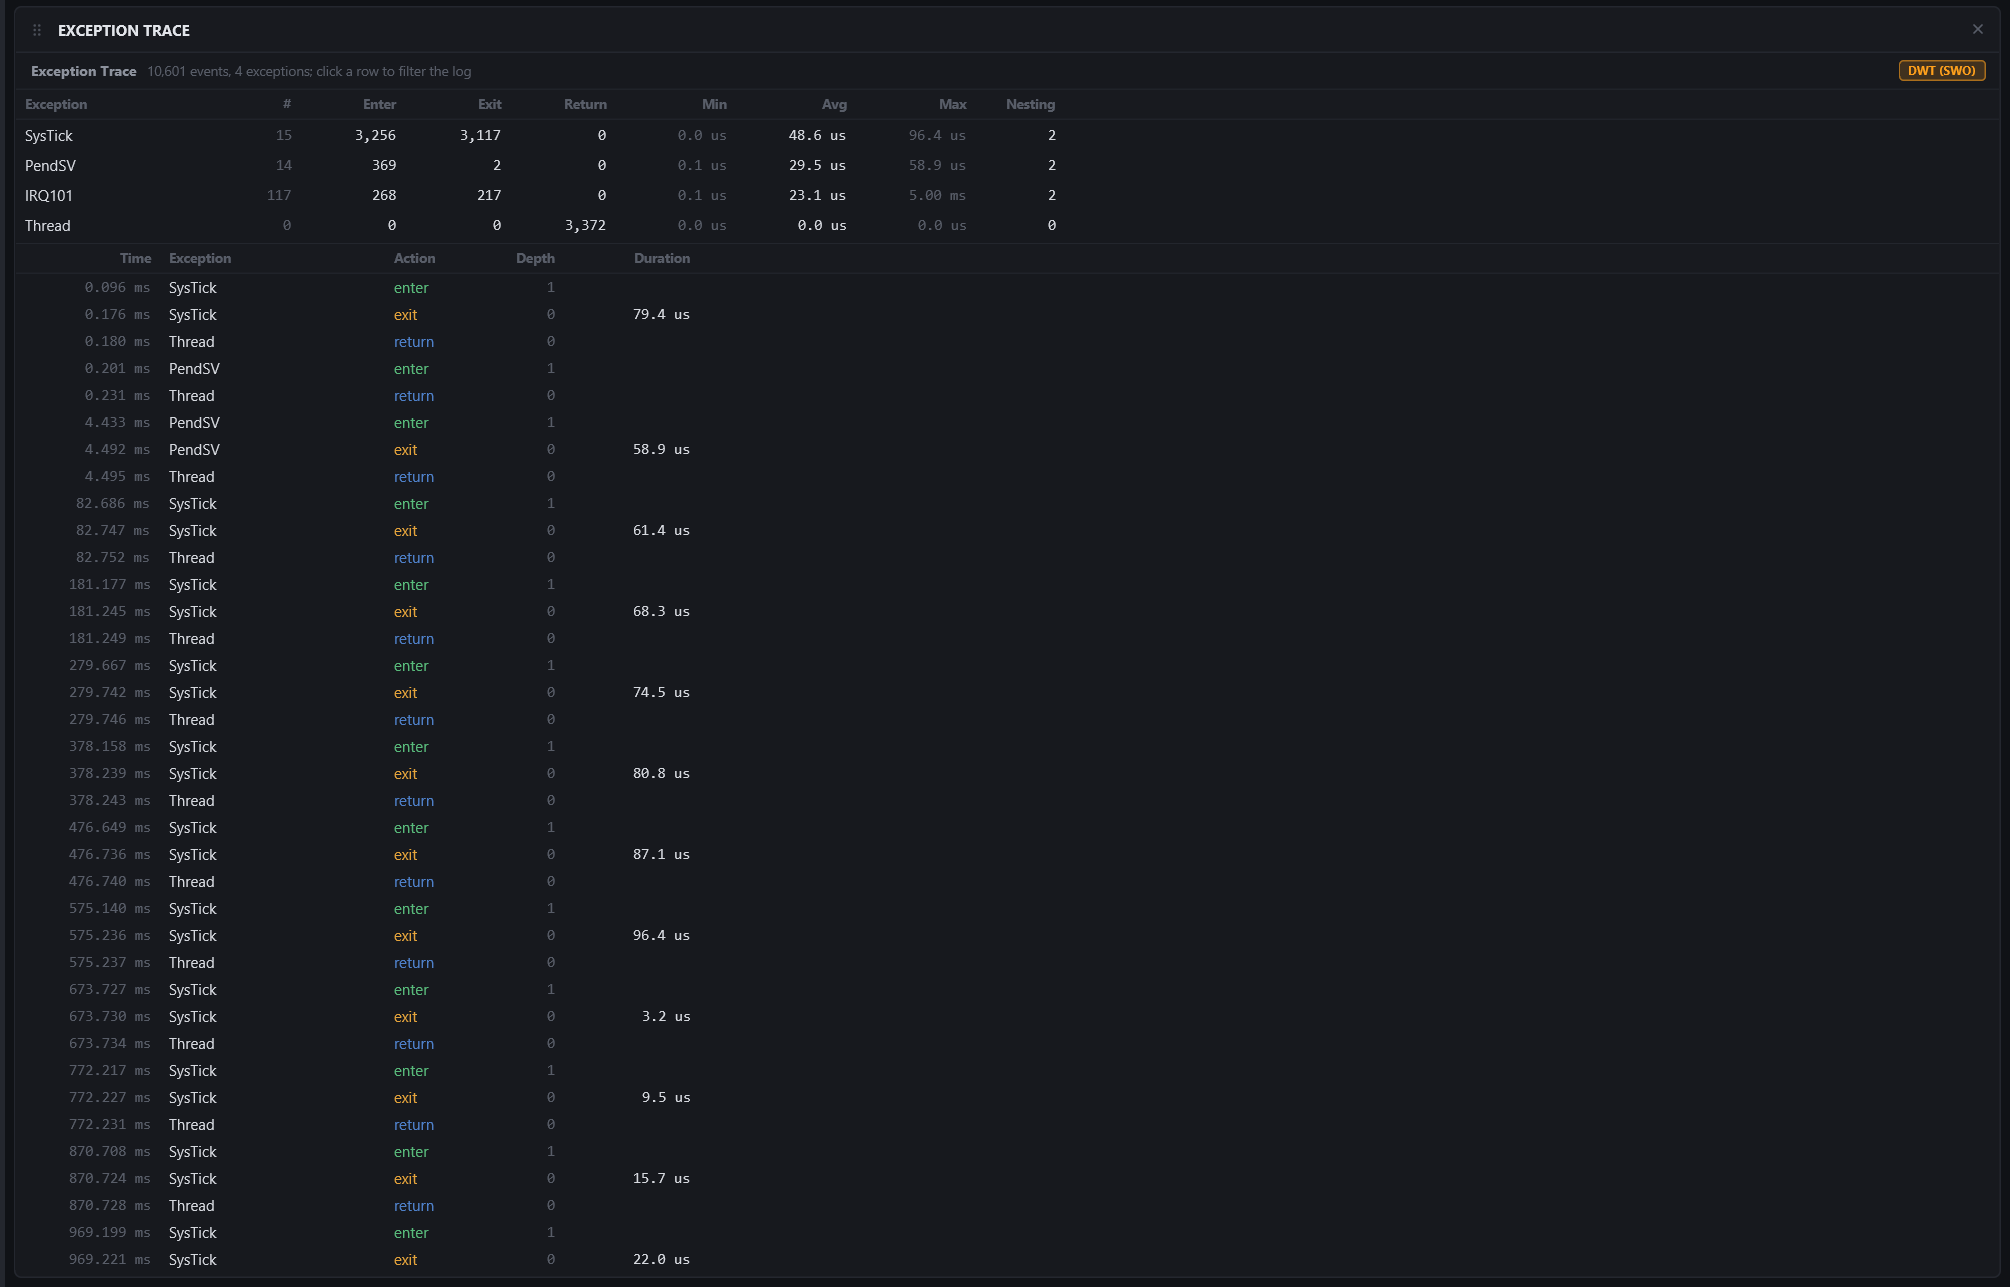
Interrupt entry, exit and return as the hardware saw them, with no firmware hooks. Where the Timeline's ISR lanes come from the recorder's own hooks, this view comes from the core: every exception, including the ones the kernel handles itself (SysTick, PendSV) and any handler the firmware never instrumented.
Needs: the SWO trace source, Profiling Source On-chip trace, and DWT Exception Trace on. See Hardware trace.
The summary
One row per exception seen, named from the vector table the way the Profiler's ISR badge is: the system exceptions by name (SysTick, PendSV), external interrupts by number (IRQ101), and Thread for the return to thread mode. The columns:
| COLUMN | MEANING |
|---|---|
| # | The exception number (SysTick is 15, external interrupts are 16 plus the IRQ number) |
| Enter / Exit / Return | How often the core entered it, left it, and returned to it after a nested exception |
| Min / Avg / Max | Shortest, mean and longest run, from entry to the matching exit |
| Nesting | The deepest nesting it reached (an interrupt that entered while another was open) |
Click a row to filter the log to that exception; click it again to show everything. The header states the totals and the DWT (SWO) pill says the data is hardware trace.
The log
Every event in time order:
| COLUMN | MEANING |
|---|---|
| Time | Milliseconds from the start of the recording |
| Exception | The handler, or Thread |
| Action | enter, exit, or return (execution resumed here after a nested exception ended) |
| Depth | The nesting depth after the event: 1 inside one handler, 2 inside a handler that interrupted another, 0 back in thread mode |
| Duration | On an exit: the time since the matching entry |
When the pin overflows
More entries than exits for a handler means the SWO pin dropped exit packets. The Thread rows (the return to thread mode) still close the run, so the per-handler statistics stay right for the runs that were complete; the Overview's ITM Overflow line gives the packet count. Lengthen the PC sample interval or raise the SWO frequency to get a lossless capture.
Tips
- The same events come out of the command line:
viewalyzer-cli query dwt-exc --recording capture.vadb(summary, plus the first 4096 events). - A firmware that routes every interrupt through one handler (Zephyr does) shows the interrupt as its number,
IRQ101; read the peripheral off the chip's vector table. - Tile this view next to the Timeline: the recorder's ISR lanes and the hardware's entries should agree, and a handler that appears here but has no lane is one the firmware never traced.