 DOCS/VIEWALYZER/HARDWARE TRACE
VIEWALYZER · GPUI EDITION
DOCS/VIEWALYZER/HARDWARE TRACE
VIEWALYZER · GPUI EDITION
Hardware trace
Every Cortex-M3 and up carries two debug blocks that can report what the core is doing without a line of firmware: the DWT (where the program counter is, every interrupt entry and exit, reads and writes of chosen addresses, cycle counters) and the ITM (the printf port). ViewAlyzer programs them through the debug probe, reads the packets back over the SWO pin, and turns them into four views. This page is the sidebar side of that: what to switch on, what each core can do, and how to keep the pin from overflowing. The views have their own pages: ITM Console, Exception Trace, Data Trace and Event Counters; PC samples feed the Profiler.
- What you need
- The one switch: Profiling Source
- On-chip trace, control by control
- What each core supports
- The SWO pin budget
- The Overview's Hardware Trace section
- Over a J-Link
- Known limits
What you need
- An ST-Link or J-Link probe, with the board's SWO pin wired to it (on Nucleo and Discovery boards it is, through the on-board ST-Link).
- Trace Source set to
SWO (ITM)under Software Trace, with SWO Freq (kHz) and Trace Clock (MHz) matching the target. The on-chip packets ride the same pin as the recorder's own port, so one capture carries both. - A core that has the blocks. Cortex-M3, M4 and M7 (Armv7-M) and M33 and M55 (Armv8-M) do. Cortex-M0, M0+ and M23 have no ITM and no DWT trace packets; on those the only hardware profile is PC sampling by polling the debug port, and the sidebar says so (see What each core supports).
Nothing is needed in the firmware for these sources: the packets come from the core. With the recorder in the build as well, the hardware rows sit on the same timeline as the task lanes, so an interrupt seen by the DWT can be read against the task it preempted.
The one switch: Profiling Source
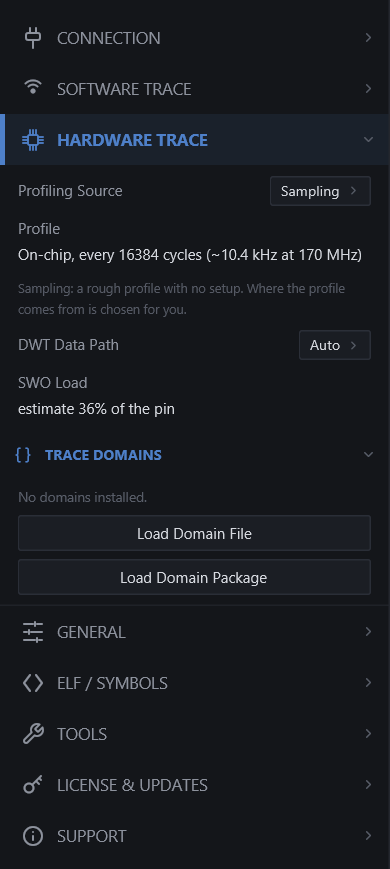
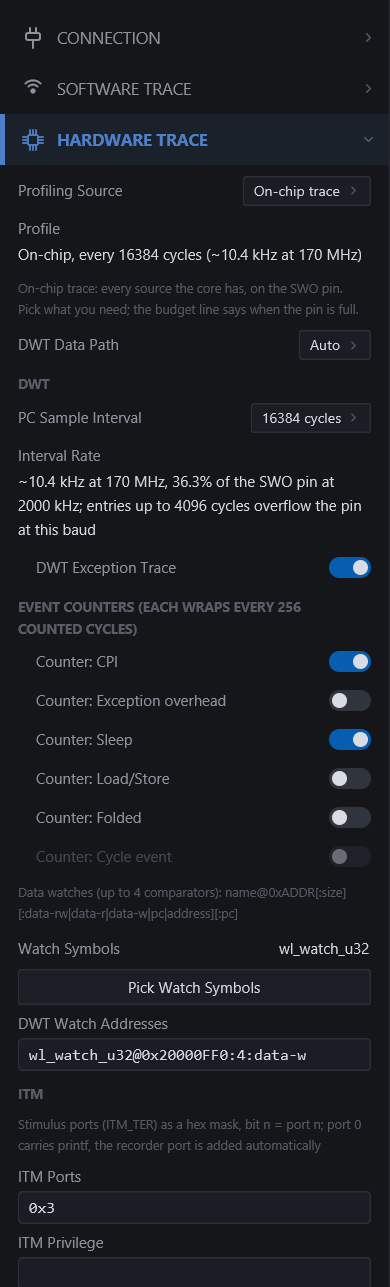
The Hardware Trace section starts with one choice, Profiling Source:
| VALUE | WHAT YOU GET |
|---|---|
| Off | No hardware trace. The DWT and ITM are left alone. |
| Sampling | A rough profile with no setup: program-counter samples only, at the lightest interval the hardware has (every 16384 cycles). Where they come from is chosen for you: over the SWO pin when the core and the trace source allow it, polled over the debug port otherwise. |
| On-chip trace | Every source the core has, on the SWO pin, with the controls below: the sample interval, exception trace, event counters, data watches, the ITM ports and the trace-port settings. |
The Profile line under the switch says what will actually happen when you press record, in plain words: On-chip, every 16384 cycles (~10.4 kHz at 170 MHz) or Polling over ST-Link (rate set by the probe). It changes as you change the target, the trace source and the interval, so you never have to work out the outcome yourself. The Profiler view repeats it in its statistics band.
DWT Data Path stays available in both modes: Auto lets the app pick, Debug-port polling forces the polled profile (and switches the SWO-borne sources off), SWO pin insists on the pin.
On-chip trace, control by control
Each group has a heading, and a note under it that says what the control does and, when it cannot run on this core or with this trace source, why.
| CONTROL | MEANING | ||||
|---|---|---|---|---|---|
| PC Sample Interval | The hardware grid: 64 to 16384 cycles between samples. The Interval Rate line under it gives the sample rate at your CPU clock and the share of the SWO pin it takes, and names the entries the pin cannot carry at the current baud (entries up to 4096 cycles overflow the pin at this baud). | ||||
| DWT Exception Trace | Interrupt enter, exit and return from the hardware, independent of the firmware's ISR hooks. Feeds Exception Trace. | ||||
| Counter: CPI / Exception overhead / Sleep / Load/Store / Folded / Cycle event | The six DWT event counters. Each is 8 bits wide and emits a packet every 256 counted cycles, so several of them at once cost real pin bandwidth. Feed Event Counters; the Sleep counter gives a measured CPU load. Cycle event shares its timer with PC sampling and is refused while sampling is on. | ||||
| Watch Symbols, Pick Watch Symbols | Data watches chosen from the ELF (ELF / Symbols must be set): pick a variable and its address, size and name are filled in. | ||||
| DWT Watch Addresses | The same watches as text, up to four (one per comparator): `name@0xADDR[:size][:data-rw | data-r | data-w | pc | address][:pc]. A bare 0xADDR:4 is a write-only value watch; :pc` adds the address of the instruction that made each access. Feed Data Trace. |
| ITM Ports | The stimulus ports to enable, as a hex mask (bit n = port n). Port 0 carries printf by convention; the recorder's own port is added for you. Text lands in the ITM Console. | ||||
| ITM Privilege | Which ports unprivileged code may write, same mask form. | ||||
| ITM Timestamps | The local timestamp prescaler (Off, 1, 4, 16, 64). | ||||
| Trace Port Protocol | NRZ (UART-style SWO). Manchester is listed so you can see it is not supported; picking it says so. | ||||
| SWO Budget | An estimate of the pin load from everything enabled, against the pin's capacity: ~73 kB/s of 200 kB/s (36%). The assumed event rates behind it are printed with it. Past 80 % it says the pin will overflow. | ||||
| SWO Load | The measured load: live while recording, the last capture's afterwards (with its byte count and overflow count), the estimate when there is nothing else. | ||||
| Capability Source | Where the app's idea of this core came from: part number (Armv7-M, 4 comparators) from the Target Device name, or target scan after Scan Target read the real DWT and ITM registers. |
What each core supports
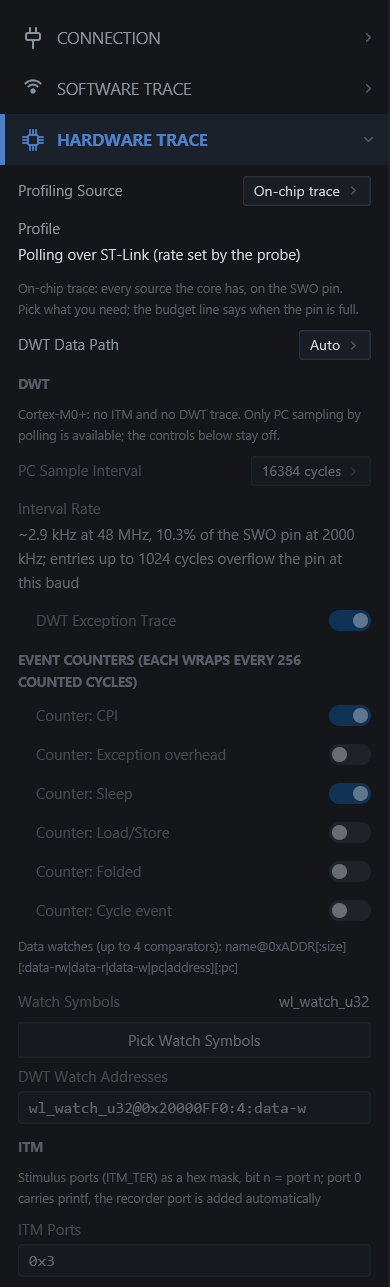
Nothing silently disappears. A control the core, the probe or the trace source cannot support stays on screen, disabled, with the reason next to it. The reasons you can meet:
| REASON | WHAT IT MEANS |
|---|---|
Cortex-M0+: no ITM and no DWT trace | Armv6-M parts (STM32C0, G0, L0 and every other M0 / M0+) have neither. PC sampling by polling the debug port is the only profile, and the four SWO views stay empty. |
this core cannot emit DWT trace packets (DWT_CTRL.NOTRCPKT) | The DWT is present but built without trace packets: PC sampling, exception trace and data trace are off. |
this core has no cycle counter (DWT_CTRL.NOCYCCNT) | No cycle counter, so no PC sampling and no event counters. |
this core has no profiling counters (DWT_CTRL.NOPRFCNT) | Event counters are off; the rest works. |
needs the SWO trace source (the trace source is RAM Buffer) | The packets need the pin. Switch Trace Source to SWO (ITM), or accept the polled profile. |
DWT Data Path is forced to debug-port polling | You chose it under DWT Data Path. |
the cycle event counter shares the POSTCNT timer with PC sampling | Turn PC sampling off (Profiling Source Off) to use the cycle event. |
Manchester SWO is not supported | The probes here receive NRZ only. |
The verdict comes from the Target Device name until you press Scan Target, which reads the core's own DWT and ITM identification registers and replaces the guess (the Capability Source line shows which is in force). A part number the app does not know is treated as an Armv7-M with four comparators.
The SWO pin budget
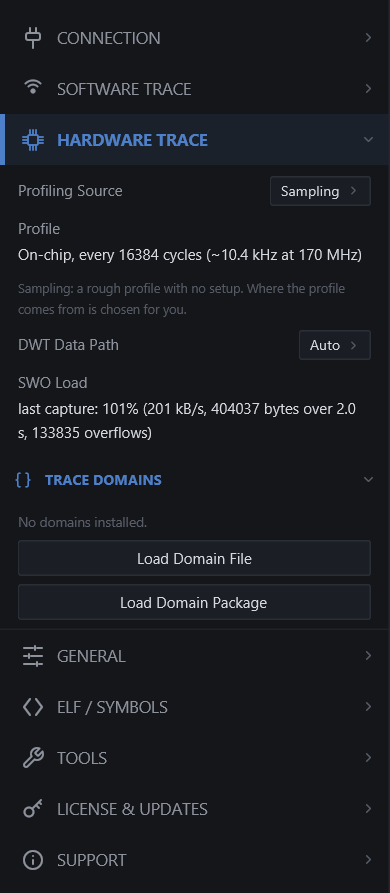
The SWO pin is a UART. At 2 MHz it carries about 200 kB/s (the figures below are for that rate; a STLINK-V3 receiver takes up to 24 MHz and a 10 MHz pin carries five times as much), and everything you enable shares it: the recorder's own port, PC samples (7 bytes each), exception packets, data-watch packets, counter wraps and console text. When more is produced than the pin can carry, the ITM drops packets and counts an overflow; nothing is invented to fill the gap, so:
- Exception Trace shows more enters than exits for an interrupt (the exit packet was dropped); the return-to-Thread rows still close the run.
- Event Counters lose wraps: the cycle totals and the CPU load become lower bounds, and the panel says so in amber.
- ITM Console lines can lose their timestamp and show at time 0.
- Data Trace lanes have gaps.
Three lines keep you ahead of that. SWO Budget estimates the load before you record; Interval Rate names the sample intervals the pin cannot carry at the current baud; SWO Load shows the measured figure, live in the top bar while recording (green, amber past 50 %, red past 80 %) and then in the sidebar for the last capture with its overflow count. The Overview keeps the same figure in the recording.
When the pin is full: raise SWO Freq (kHz) as far as the probe and the board's wiring allow, lengthen the PC Sample Interval, enable fewer counters (they are the most expensive source per bit of information), and watch fewer addresses.
The Overview's Hardware Trace section
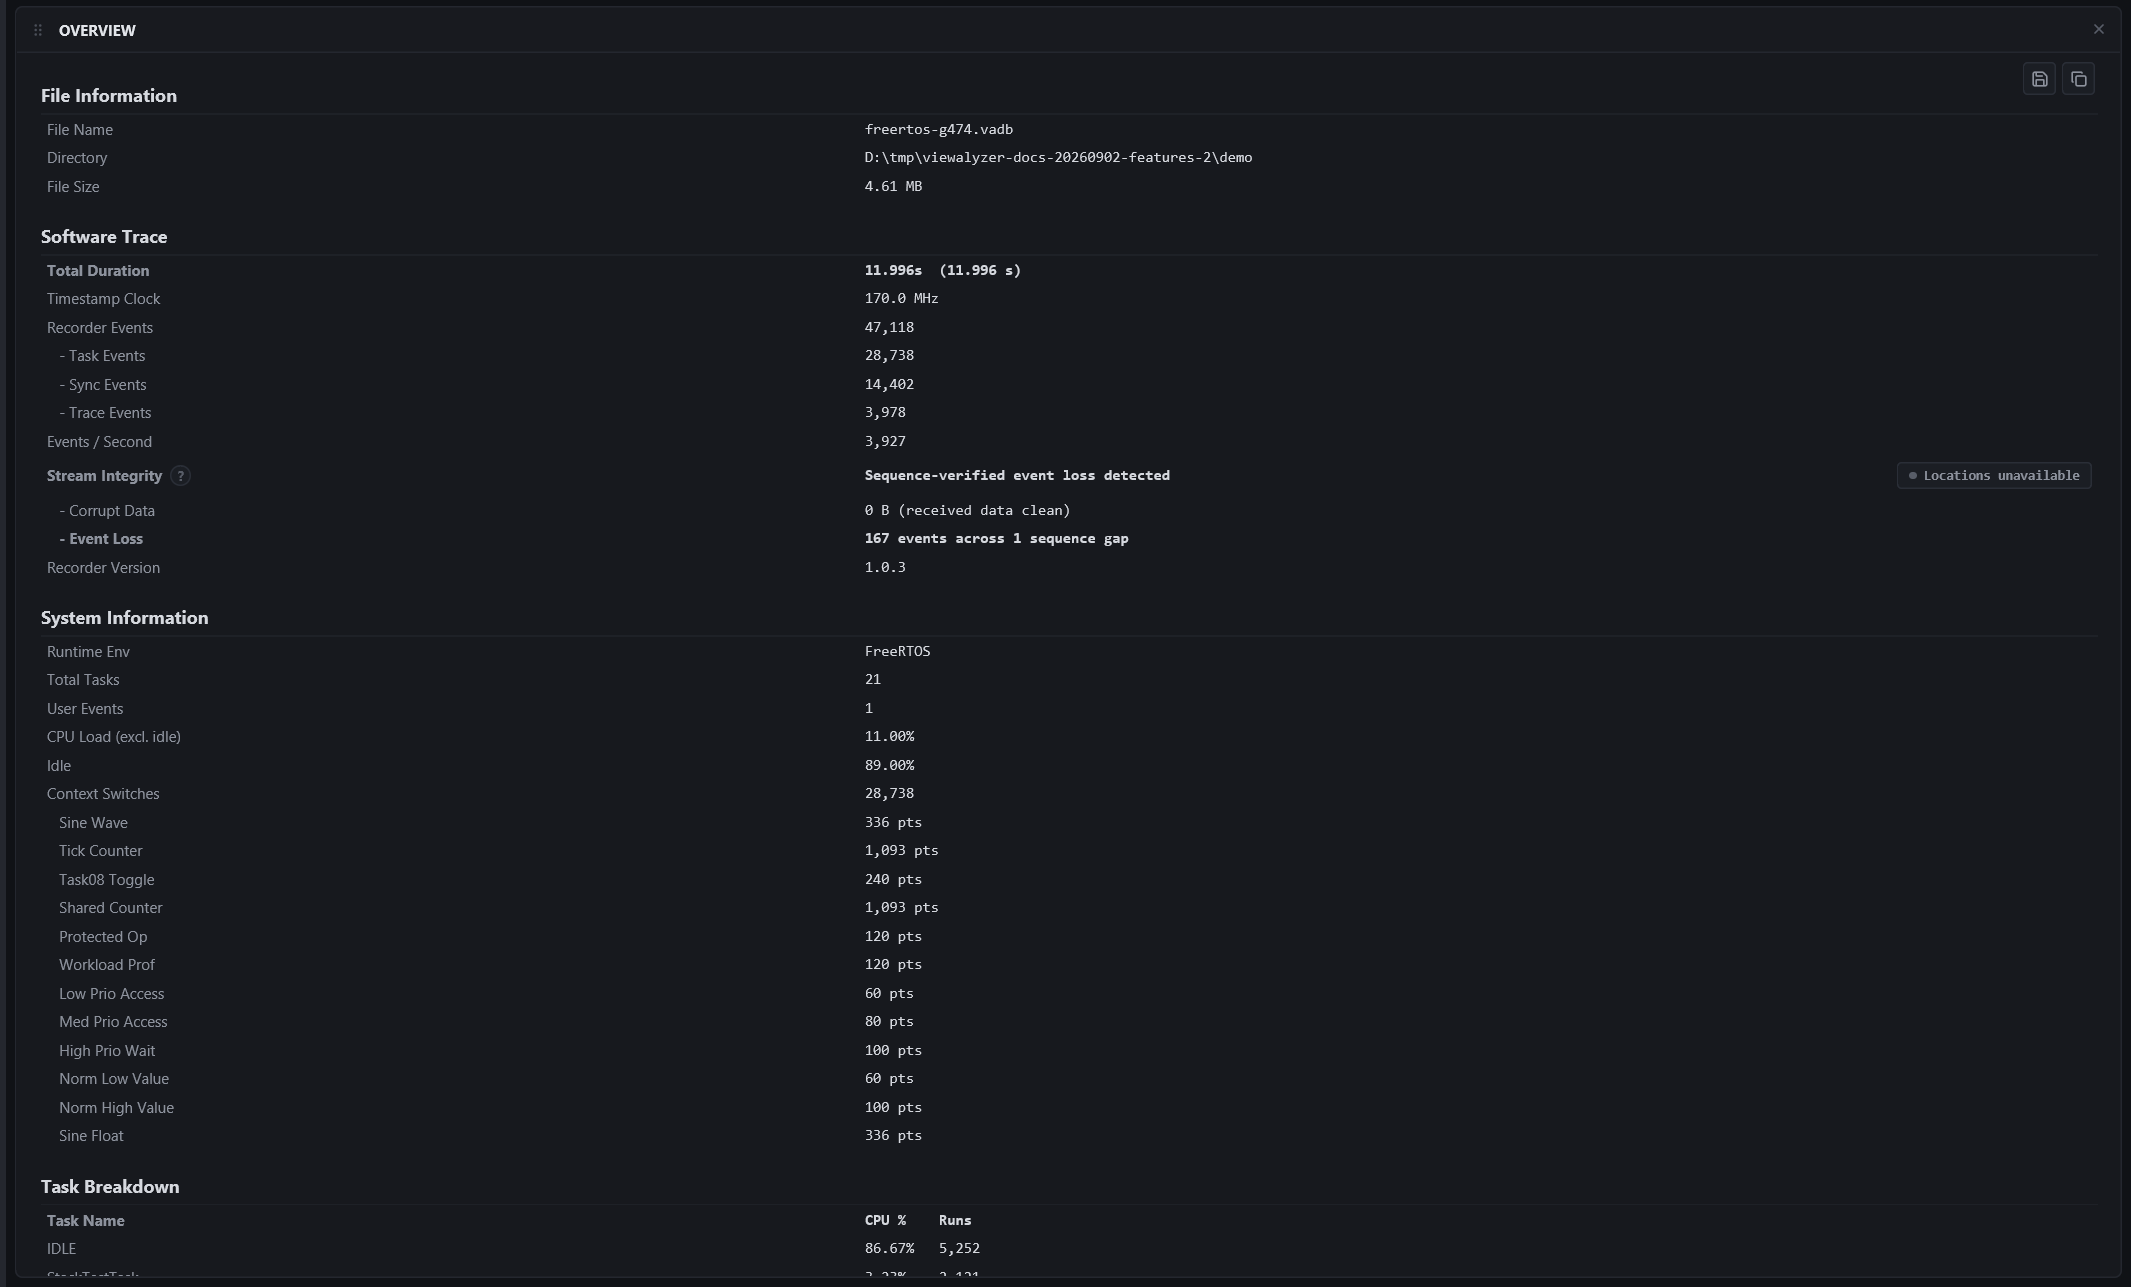
Every hardware figure is written into the recording, so the Overview tells the same story later: the sample count, source and rate, how many samples found the core asleep, the exception event count, the ITM overflow count with a lossy / lossless verdict, the console byte count, the data-trace sample count, and the SWO load with the interval it was measured at. Copy puts it on the clipboard with the rest of the report.
Over a J-Link
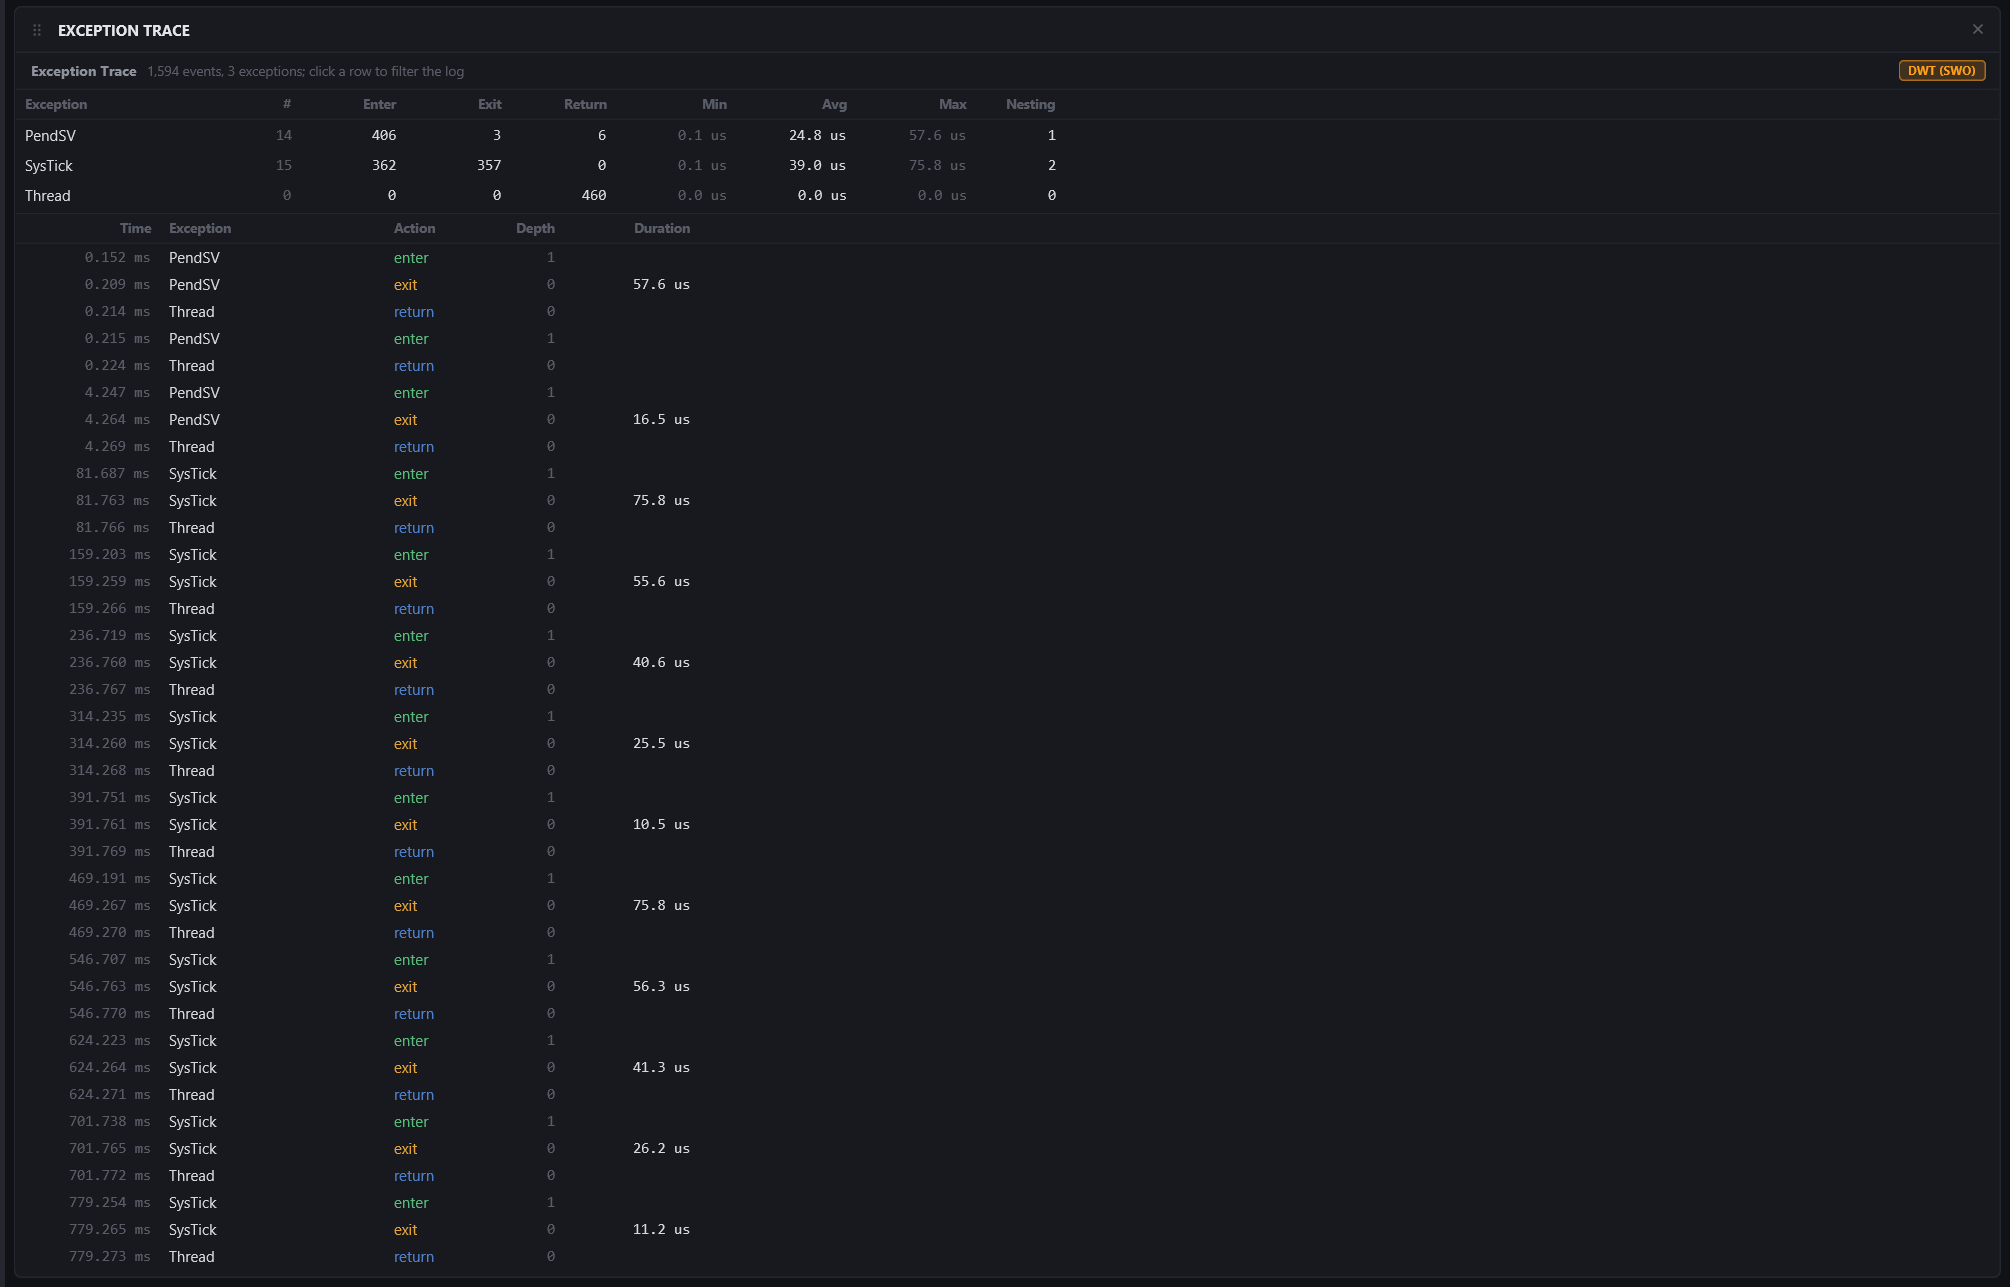
The controls and the views are the same for both probes. Pick J-Link as the Probe Type, give it the serial if several are attached, and the SEGGER software installed for the board's IDE is all the app needs (the Tools > J-Link Path setting points at it when it is somewhere unusual).
Known limits
- The SWO-borne sources (exception trace, data watches, counters, the console) need the SWO trace source. With RTT or the RAM buffer the hardware profile is PC sampling by polling the debug port.
- Data watches: one per DWT comparator (four on most Cortex-M4 and M7 parts; the scan says how many), and the ITM cannot carry a watch on a fast-changing address at a fast PC interval on a 2 MHz pin; the budget line says when.
- Event counters: six 8-bit counters emitting a packet every 256 cycles each. All six on a 2 MHz pin overflow within milliseconds; two or three are what the pin carries. The figures are lower bounds whenever the panel reports overflows.
- Manchester SWO is not supported.
- Interrupt names in the Exception Trace come from the vector table in the ELF. A firmware that funnels every interrupt through one handler (Zephyr does) shows the number,
IRQ101, not the peripheral.