 DOCS/VIEWALYZER/ITM CONSOLE
VIEWALYZER · GPUI EDITION
DOCS/VIEWALYZER/ITM CONSOLE
VIEWALYZER · GPUI EDITION
VIEWALYZER · VIEWS
ITM Console
Text the firmware writes to an ITM stimulus port (printf over SWO, port 0 by convention), one line per newline, stamped with the trace time of the chunk that started the line. Because the timestamps are the recording's own, a line sits exactly where it belongs next to the Timeline's task lanes.
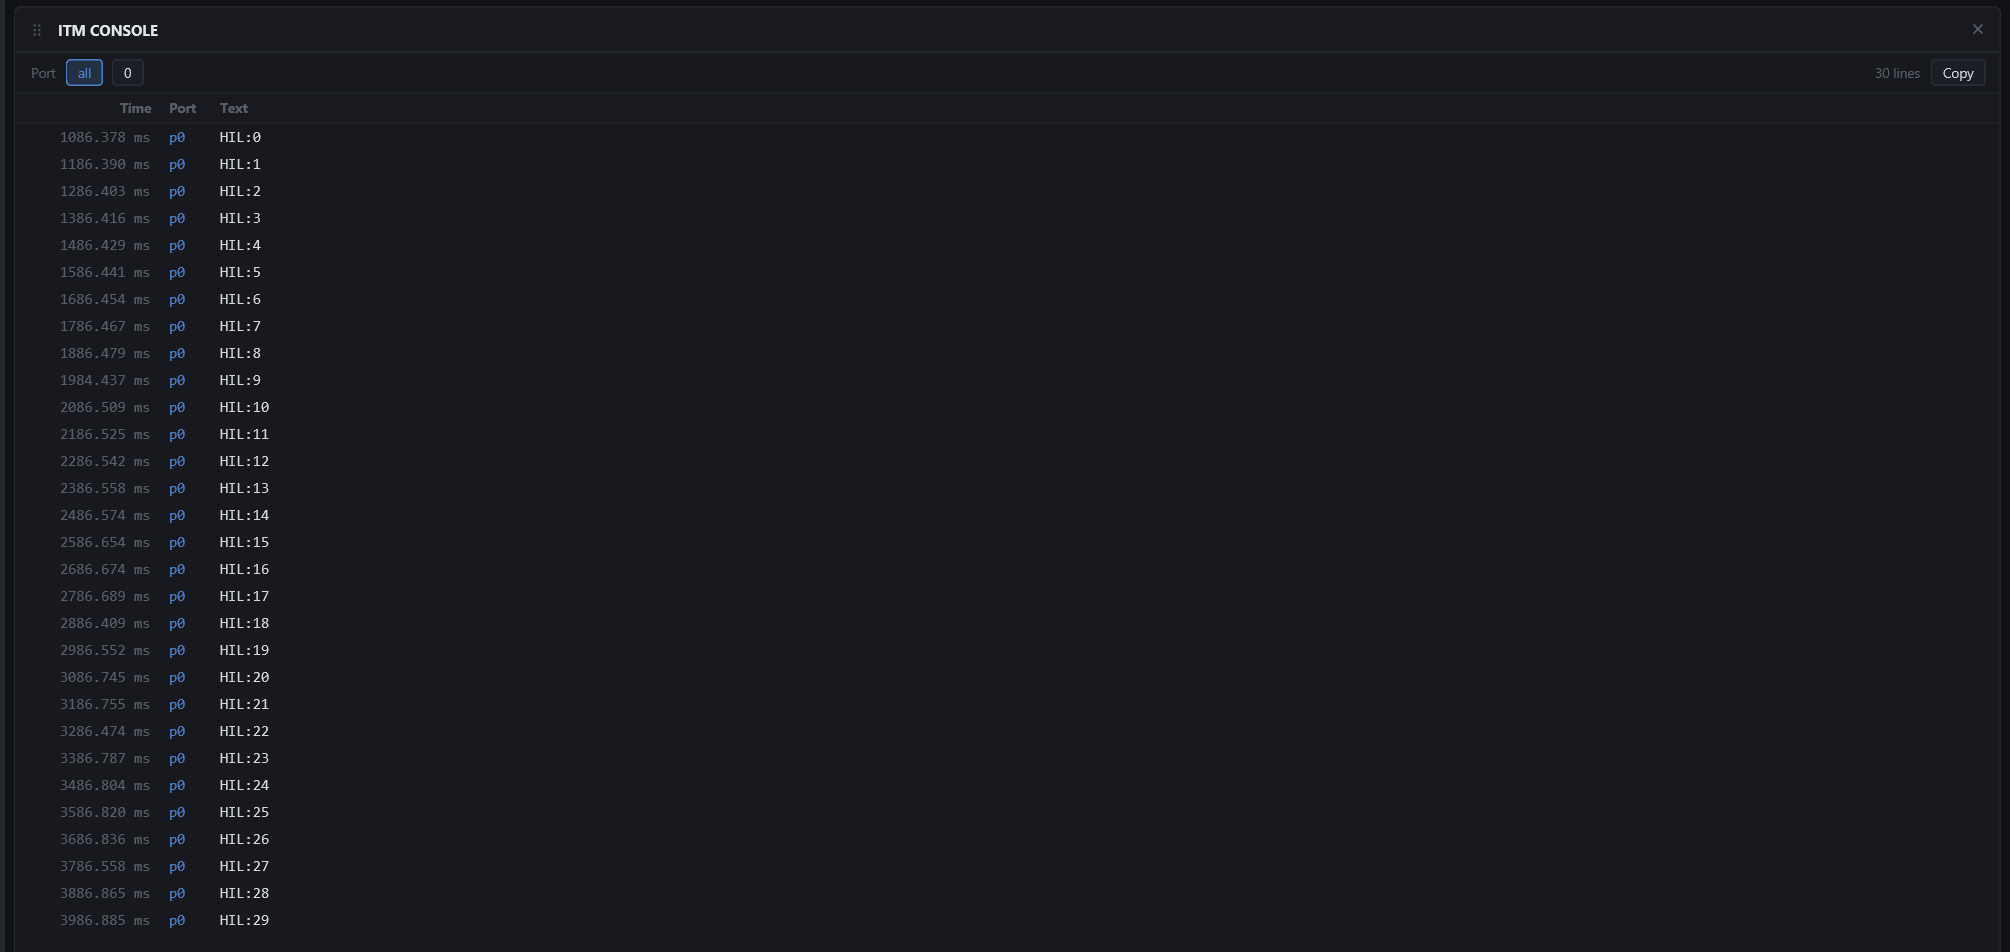
Needs: the SWO trace source, Profiling Source set to On-chip trace, and the port enabled in ITM Ports (port 0 and the recorder's port are on by default). See Hardware trace. The console is read-only: nothing is sent to the target.
Reading it
| COLUMN | CONTENT |
|---|---|
| Time | Milliseconds from the start of the recording, to the microsecond |
| Port | The stimulus port the text arrived on (p0) |
| Text | The line, as the firmware wrote it |
The header counts the lines shown. A line that arrived while the SWO pin was overflowing can lose its timestamp and shows at 0.000 ms; the Overview reports how many packets were dropped.
Toolbar
- Port chips:
all, then one chip per port that carried text. Click a port to see only its lines. - Copy puts every line shown on the clipboard, one per line, without the timestamps.
Tips
- The same lines come out of the command line as JSON:
viewalyzer-cli query itm-console --recording capture.vadb. - Firmware text sent through the recorder (
VA_LogString) is a different channel: it appears in the Event Table and the log's User tab, not here. The console is for the ITM ports only.