 DOCS/VIEWALYZER/DATA TRACE
VIEWALYZER · GPUI EDITION
DOCS/VIEWALYZER/DATA TRACE
VIEWALYZER · GPUI EDITION
VIEWALYZER · VIEWS
Data Trace
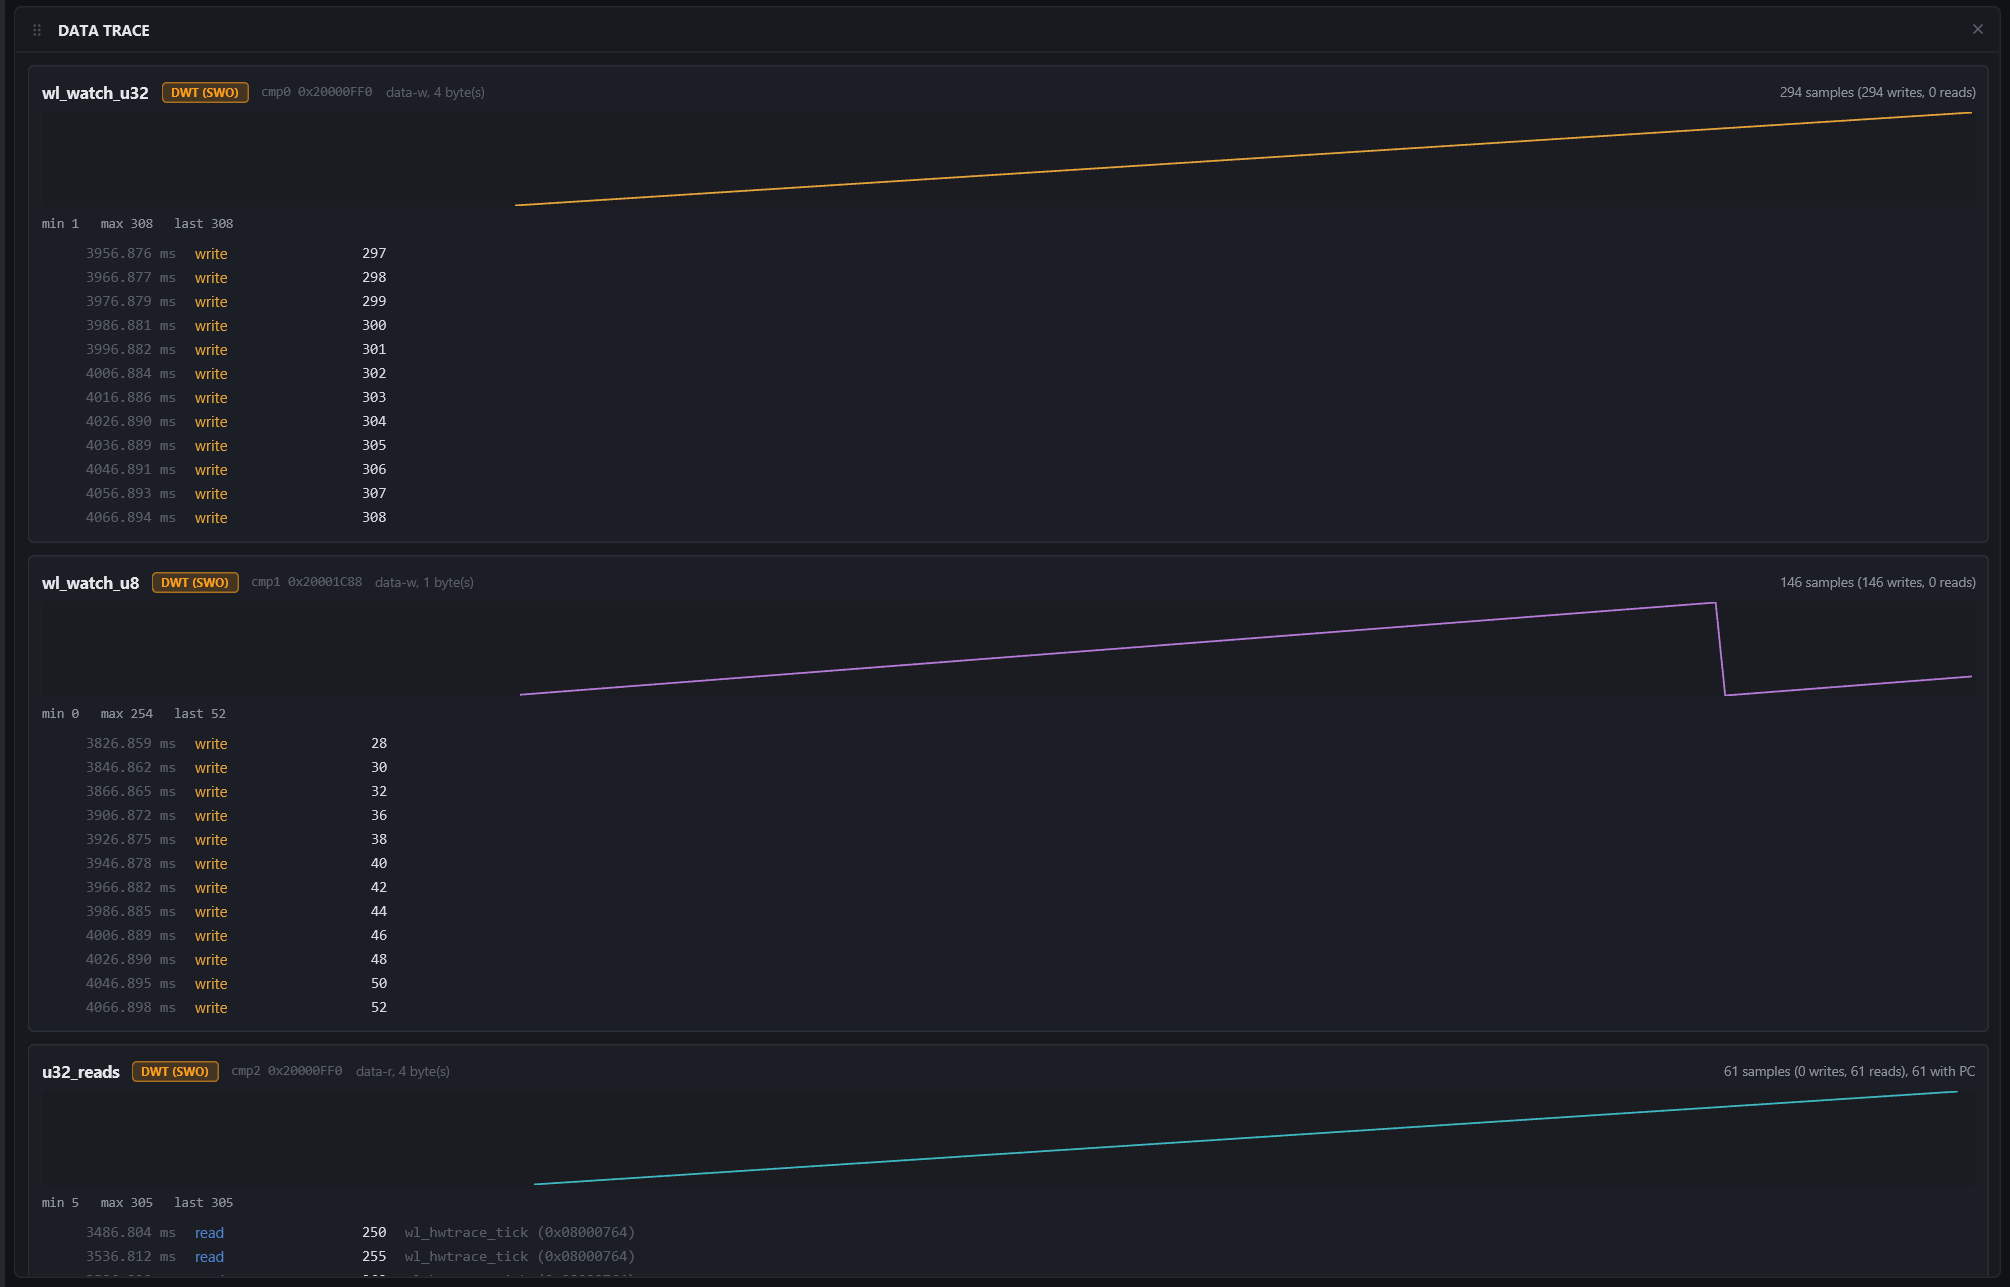
One lane per data watch: the values the hardware saw the firmware read or write at that address, plotted over the capture with the DWT (SWO) pill so they are never mistaken for software traces. Nothing in the firmware knows it is being watched.
Needs: the SWO trace source, Profiling Source On-chip trace, and one to four entries in DWT Watch Addresses (or picked with Pick Watch Symbols from the ELF). See Hardware trace.
The card
Each watch is a card:
- The header: the watch name, the comparator it uses (
cmp0), the address, the function (data-wfor writes,data-rfor reads,data-rwfor both,pcoraddressfor match-only watches) and the size, and on the right the sample count split into writes and reads (294 samples (294 writes, 0 reads)) with, for a:pcwatch, how many carry the program counter. - A sparkline of the value over the whole recording, in the lane's colour.
min,maxandlast.- The newest samples: time,
writeorread, the value, and for a:pcwatch the instruction that made the access, named from the ELF with the address after it (wl_hwtrace_tick (0x08000764); the address alone when no ELF is set).
Writing a watch
name@0xADDR[:size][:data-rw|data-r|data-w|pc|address][:pc], one per comparator, separated by spaces:
| EXAMPLE | MEANING |
|---|---|
0x20000FF0:4 | Writes of the 32-bit value at that address |
wl_watch_u32@0x20000FF0:4:data-w | The same, named |
reads@0x20000FF0:4:data-r:pc | Reads only, each with the reading instruction |
flag@0x20001C88:1:data-rw | Every access to a byte |
Pick Watch Symbols fills a line in from the ELF's symbol table so the address and size are never typed by hand; the watch keeps the symbol's name.
Tips
- The same samples, symbolicated, come out of the command line:
viewalyzer-cli query dwt-data --recording capture.vadb --elf firmware.elf. - A watch on a variable the firmware writes from several places, with
:pc, is the fastest way to find out which one wrote the bad value. - Each traced access costs pin bandwidth (about 7 bytes with the PC). A variable written every few microseconds will overflow a 2 MHz pin; the SWO Budget line under the watches says so before you record.