
Hardware regression testing
Hardware regression testing
Using recorded runtime evidence to catch timing and trace regressions on real hardware.
Study 02 · Hardware regression testing
Trace-based checks in the release process
A debugger is something you reach for after the fact. An instrument runs whether or not anyone is watching. This entry is what happens when you treat the trace engine as the second thing: it is wired into our own release process, and it decides whether a change to ViewAlyzer is allowed to merge.
Every run builds firmware from the checkout under test, flashes the rack, records live trace through the headless CLI, and then asserts on the recording itself. The workload counts out loud at 100 Hz, so a single missing value is a dropped event and a failed build. The binary stamps its own identity into the trace, so stale firmware cannot produce a green run. And the scheduler numbers are compared against baselines committed to git, so a change that quietly costs a quarter of the context switches shows up as red, not as a support ticket eight months later.
These are regressions that do not exist anywhere but on silicon. No simulator has the flash wait states, the bus contention, or the interrupt that arrives one cycle early.
- Targets
- 5 Nucleo boards · ARM M3 to M33
- Matrix
- Zephyr · FreeRTOS · baremetal, across every transport and debug server each board supports
- Gate
- Zero dropped events · scheduler counts within 25% of baseline
- Evidence
- Every cell keeps its full recording, openable in the IDE
- Run
- 48 cells in 284.7 s, unattended
- Outcome
- Timing regressions caught before merge, not in the field
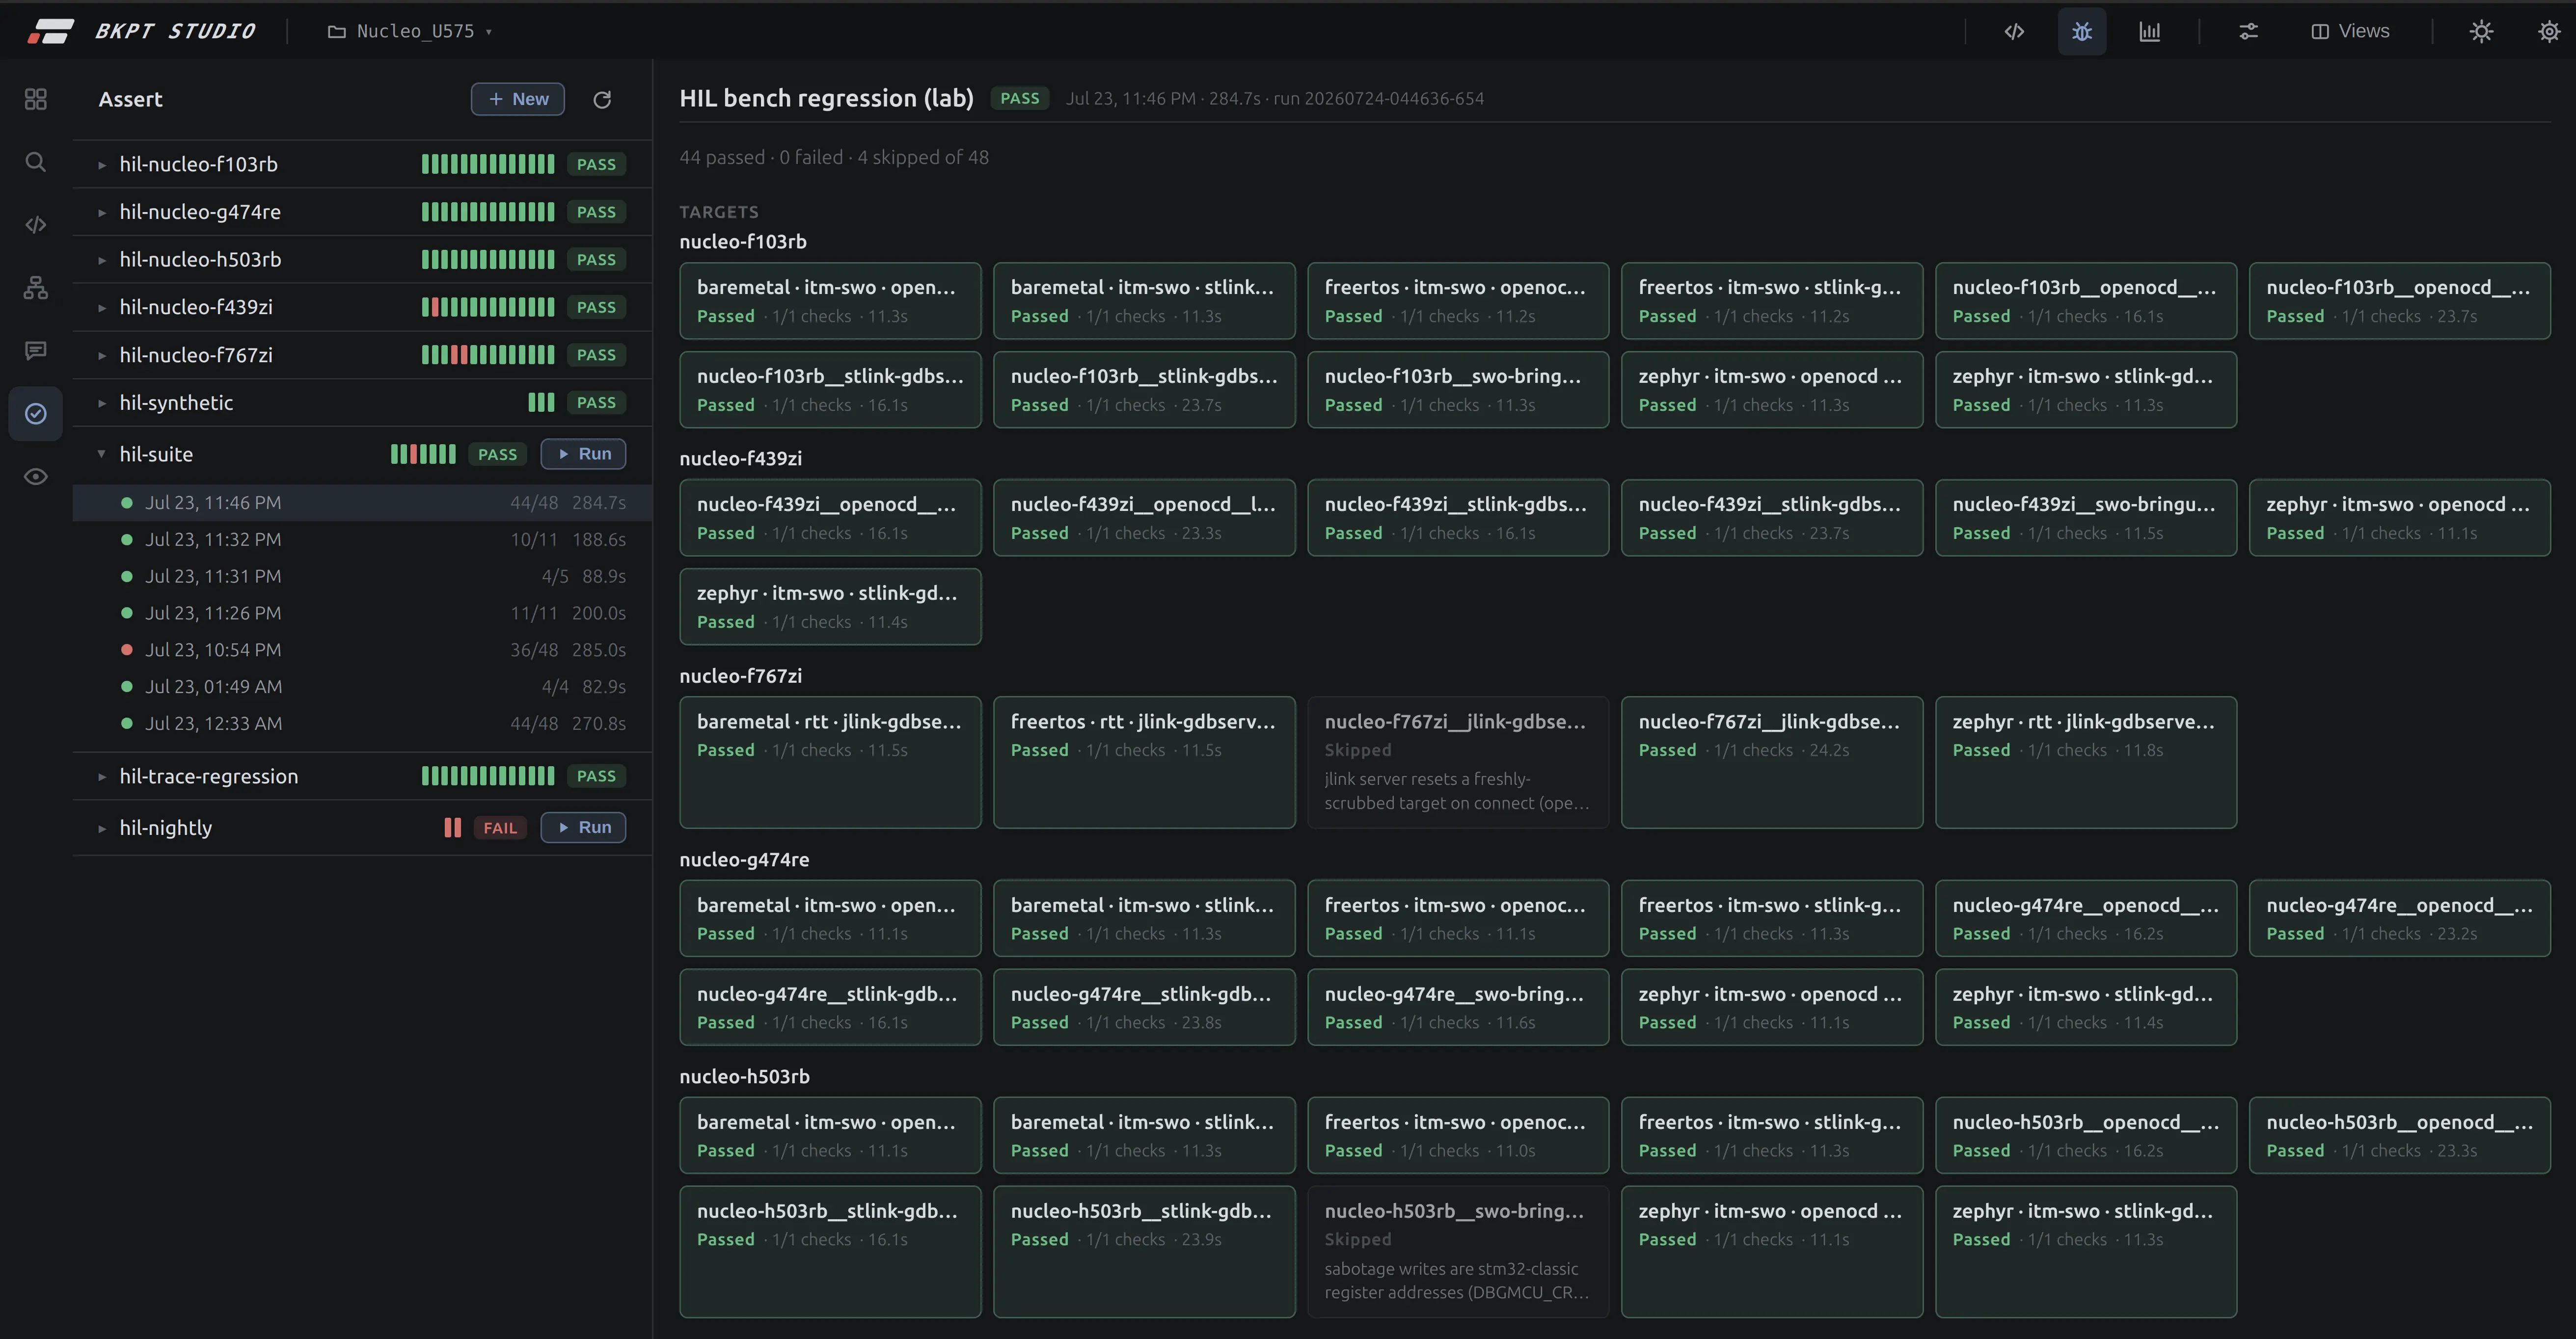
One run, as the bench reports it. Each cell is one board running one OS over one transport through one debug server. The skipped cells are not failures, they are the harness refusing to lie: it names the reason on the cell and moves on.
Evidence for each failure
A red cell is not a log line. It is a recording. Open it and you are in the same timeline you would use to debug the board by hand, at the moment the assertion broke, next to the diff that caused it.
Runtime checks in CI
Once timing is a number with a committed baseline, it is a requirement like any other. Periods, jitter, ordering, dropped events and scheduler volume all become things a pull request can break, and therefore things CI can defend.
Recordings after deployment
Turn the volume down to the events you would want at 3am and point the recorder at a ring in the device's own memory. On the bench we drain it through the probe. In the field it is your address space, so the firmware drains it itself: into flash on a fault, or up whatever radio the product already has. A returned unit stops being a guess.
SWO, RTT, a RAM ring or full ETM instruction trace. Through a J-Link, an ST-Link or our own BKPT #1 probe. The transport is a detail. What matters is that one instrument explains the system, defends it, and remembers what it did.