
At this workload
750 sample blocks/second; three 60-second runs per build; the same application and board.
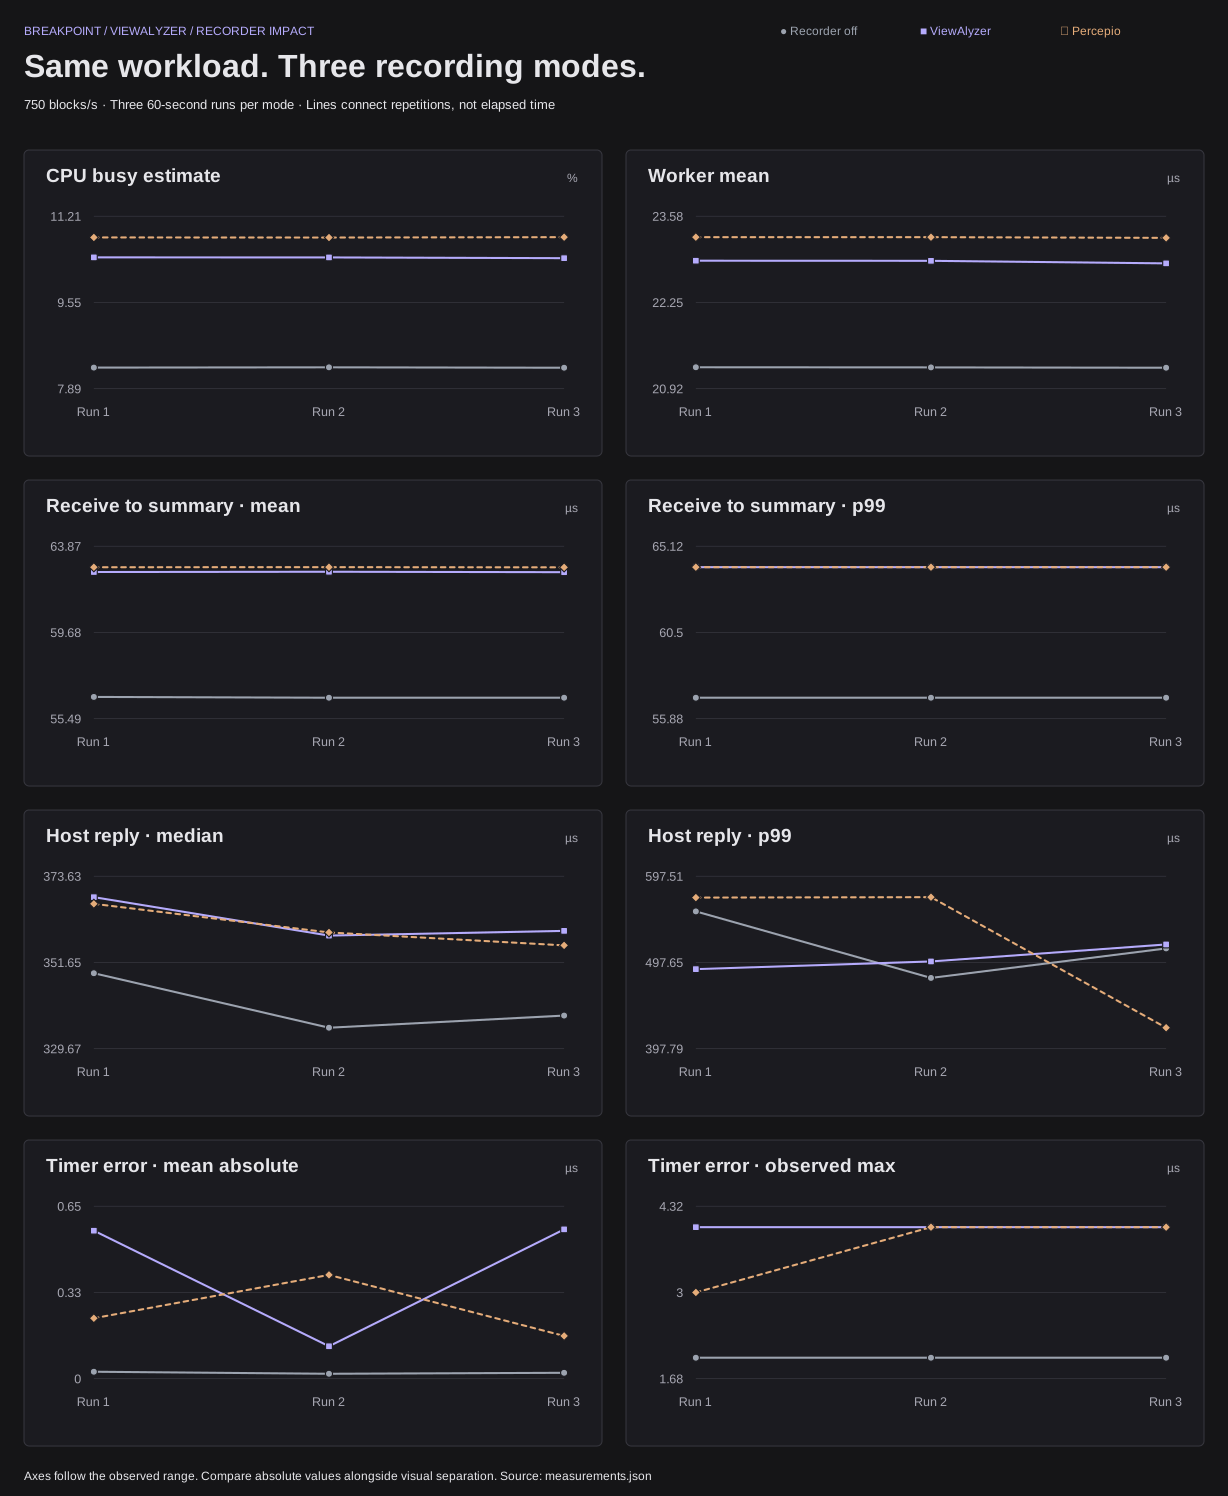
At this workload, CPU busy averaged 8.29% with recording off, 10.41% with ViewAlyzer and 10.80% with Percepio. The increases are 2.12 and 2.51 percentage points, respectively. These include active probe collection, not just recorder instructions.
Mean receive-to-summary time was 56.52 us off, 62.62 us with ViewAlyzer and 62.85 us with Percepio. The largest timer errors were 2 / 4 / 4 us, respectively, on a 10,000-us interval, with mean absolute errors of 0.02 / 0.42 / 0.26 us. These are observed maxima, not worst-case guarantees.
The comparison is specific to these recorder configurations and this collection path. Event formats and coverage differ. A lower CPU number alone does not establish a better recorder. Application loss and trace loss are separate outcomes: missing application replies total 0 / 0 / 0 for Recorder off / ViewAlyzer / Percepio; post-sync missing trace events total 0 / 210 for ViewAlyzer / Percepio.
Application impact
Each entry is the average of three run-level values, followed by their observed minimum to maximum. Delta = that recorder minus Recorder off; the last column is ViewAlyzer minus Percepio, so a negative value means ViewAlyzer measured lower. Its tag reads the difference from ViewAlyzer's side: better or behind when the two recorders' three-run ranges do not overlap, slightly better or slightly behind when they do, and equal when the means agree. CPU deltas are percentage points; other deltas use the row's units. Smaller timing values mean shorter measured times; higher delivery means more replies. These ranges are not confidence intervals.
| Measurement | Recorder off | ViewAlyzer | Delta | Percepio | Delta | ViewAlyzer vs Percepio |
|---|---|---|---|---|---|---|
| CPU busy estimate (%) | 8.293 (8.289 to 8.297) | 10.412 (10.402 to 10.417) | +2.119 | 10.803 (10.800 to 10.807) | +2.510 | -0.391 (better) |
| Worker mean (us) | 21.247 (21.242 to 21.250) | 22.878 (22.851 to 22.892) | +1.631 | 23.251 (23.244 to 23.255) | +2.005 | -0.374 (better) |
| Receive-to-summary mean (us) | 56.521 (56.508 to 56.547) | 62.623 (62.613 to 62.634) | +6.102 | 62.853 (62.849 to 62.857) | +6.332 | -0.231 (better) |
| Receive-to-summary p99 (us) | 57.000 (57.000 to 57.000) | 64.000 (64.000 to 64.000) | +7.000 | 64.000 (64.000 to 64.000) | +7.000 | +0.000 (equal) |
| Host reply median (us) | 340.667 (335.000 to 348.900) | 362.167 (358.500 to 368.300) | +21.500 | 360.633 (356.000 to 366.600) | +19.967 | +1.533 (slightly behind) |
| Host reply p99 (us) | 516.802 (479.703 to 556.801) | 502.402 (489.902 to 518.503) | -14.401 | 522.703 (422.003 to 573.304) | +5.900 | -20.301 (slightly better) |
| Timer mean absolute error (us) | 0.022 (0.018 to 0.026) | 0.416 (0.123 to 0.565) | +0.394 | 0.261 (0.162 to 0.393) | +0.239 | +0.155 (slightly behind) |
| Timer maximum observed error (us) | 2.000 (2.000 to 2.000) | 4.000 (4.000 to 4.000) | +2.000 | 3.667 (3.000 to 4.000) | +1.667 | +0.333 (slightly behind) |
| Offered blocks/s | 750.000 (750.000 to 750.000) | 750.000 (750.000 to 750.000) | +0.000 | 750.000 (750.000 to 750.000) | +0.000 | +0.000 (equal) |
| Replies/s | 750.000 (750.000 to 750.000) | 750.000 (750.000 to 750.000) | +0.000 | 750.000 (750.000 to 750.000) | +0.000 | +0.000 (equal) |
What each measurement means
- CPU busy estimate: share of the run the CPU was not in the FreeRTOS idle task; interrupt time charged to idle can understate it.
- Worker mean: time from taking a queued block to finishing its summary, including settings access and any preemption.
- Receive-to-summary mean: time from the application receiving a block on its socket to the finished summary, including queue waiting.
- Receive-to-summary p99: the value 99% of blocks stayed under for the same interval.
- Host reply median: typical PC-measured round trip from UDP send to received reply, including Ethernet, both network stacks and Windows scheduling.
- Host reply p99: the round trip 99% of replies stayed under, on the same PC path.
- Timer mean absolute error: average deviation of the 10-ms software timer's callback-to-callback interval from 10 ms.
- Timer maximum observed error: the largest such deviation seen in the run; an observed maximum, not a bound.
- Offered blocks/s: blocks the PC sent per second.
- Replies/s: unique replies the PC received per second; anything below the offered rate is loss.
Graphs and variation
Three runs per recording mode, with all three modes on the same axis for each metric. Lines connect repetitions, not elapsed time. The numbers below each graph are the means of the three run-level values.
Axes follow the observed range to make small differences visible. Read the values as well as the visual separation.
CPU busy estimate
%Run values
| Mode | Run 1 | Run 2 | Run 3 |
|---|---|---|---|
| Recorder off | 8.292 | 8.297 | 8.289 |
| ViewAlyzer | 10.417 | 10.416 | 10.402 |
| Percepio | 10.802 | 10.800 | 10.807 |
Values in %. Repetitions are in acquisition order within each mode.
Worker mean
µsRun values
| Mode | Run 1 | Run 2 | Run 3 |
|---|---|---|---|
| Recorder off | 21.250 | 21.247 | 21.242 |
| ViewAlyzer | 22.892 | 22.890 | 22.851 |
| Percepio | 23.255 | 23.255 | 23.244 |
Values in µs. Repetitions are in acquisition order within each mode.
Receive to summary · mean
µsRun values
| Mode | Run 1 | Run 2 | Run 3 |
|---|---|---|---|
| Recorder off | 56.547 | 56.508 | 56.508 |
| ViewAlyzer | 62.621 | 62.634 | 62.613 |
| Percepio | 62.854 | 62.857 | 62.849 |
Values in µs. Repetitions are in acquisition order within each mode.
Receive to summary · p99
µsRun values
| Mode | Run 1 | Run 2 | Run 3 |
|---|---|---|---|
| Recorder off | 57.000 | 57.000 | 57.000 |
| ViewAlyzer | 64.000 | 64.000 | 64.000 |
| Percepio | 64.000 | 64.000 | 64.000 |
Values in µs. Repetitions are in acquisition order within each mode.
Host reply · median
µsRun values
| Mode | Run 1 | Run 2 | Run 3 |
|---|---|---|---|
| Recorder off | 348.900 | 335.000 | 338.100 |
| ViewAlyzer | 368.300 | 358.500 | 359.700 |
| Percepio | 366.600 | 359.300 | 356.000 |
Values in µs. Repetitions are in acquisition order within each mode.
Host reply · p99
µsRun values
| Mode | Run 1 | Run 2 | Run 3 |
|---|---|---|---|
| Recorder off | 556.801 | 479.703 | 513.903 |
| ViewAlyzer | 489.902 | 498.800 | 518.503 |
| Percepio | 572.801 | 573.304 | 422.003 |
Values in µs. Repetitions are in acquisition order within each mode.
Timer error · mean absolute
µsRun values
| Mode | Run 1 | Run 2 | Run 3 |
|---|---|---|---|
| Recorder off | 0.026 | 0.018 | 0.022 |
| ViewAlyzer | 0.560 | 0.123 | 0.565 |
| Percepio | 0.229 | 0.393 | 0.162 |
Values in µs. Repetitions are in acquisition order within each mode.
Timer error · observed max
µsRun values
| Mode | Run 1 | Run 2 | Run 3 |
|---|---|---|---|
| Recorder off | 2.000 | 2.000 | 2.000 |
| ViewAlyzer | 4.000 | 4.000 | 4.000 |
| Percepio | 3.000 | 4.000 | 4.000 |
Values in µs. Repetitions are in acquisition order within each mode.
Download graphs · SVG ↗ · Exact values are in the measurement data. Three repetitions are not a broad statistical characterization; observed ranges are not confidence intervals.
What the application does
The board is a small FreeRTOS telemetry gateway. A PC supplies repeatable sensor-like data: 512-byte blocks, each containing 31 samples on eight channels. Three application tasks receive blocks, process them, and handle commands. Two queues manage a 16-block pool and pending work. The worker applies gain and a low-pass filter, computes peak and mean-square summaries, and returns an 88-byte UDP reply. A mutex protects settings; 20 gain commands/second exercise it. A 10-ms software timer checks input freshness. Network, idle, timer-service and startup tasks also run. No physical ADC is used.
No custom per-block user trace or ISR entry/exit logging is present. Both recorders use the ordinary RTOS hooks. The same small independent measurements stay enabled in all builds; this is minimal instrumentation, not zero instrumentation.
Measurement notes
Board-side times are read from a free-running microsecond counter at the points named above; the host round trip is timed by the PC. Timer error describes the callback interval, not interrupt-entry latency. Delivery compares host sends, firmware receive/processing/send counts and unique replies; loss is retained, not filtered out of the report.
TIM2 provides the same nominal 1-MHz measurement clock in all builds; recorder timestamps are not used for application timing. CPU/timer counters cover reset to final status, including brief host startup/drain; throughput uses the requested send interval. p99 and observed maxima are not worst-case bounds. No application deadline or acceptable loss budget was supplied, so these results cannot establish deadline compliance.
Recorder settings and collection
| Setting | Recorder off | ViewAlyzer | Percepio |
|---|---|---|---|
| Recorder and hooks | Compiled out | Enabled | Enabled |
| Stack monitoring | Absent | Off | Off |
| Self-profiling / custom application events | Absent | None | None |
| Trace buffer | Absent | 5,120-byte RAM ring | Stock RTT channel 1, 5,120-byte up ring |
| Full buffer policy | Absent | Whole-packet drop | Stock skip-on-full |
| Buffer cache policy | Absent | Non-cacheable | Non-cacheable RTT buffers/control |
| Recorder state | Absent | Normal application memory | Cached; only stream buffers overlaid non-cacheable |
| Setup metadata | Absent | Startup and once on reader attach; periodic retransmission disabled | Stock startup header/entry table |
| Task-ready / OS-tick records | Absent | Not provided by these hooks | Disabled to match available coverage |
| Queue / semaphore / mutex / timer / event-group hooks | Absent | Enabled defaults | Enabled |
| ISR entry/exit calls | None | None | None |
| Collector during run | None | Common raw reader | Same raw reader |
ViewAlyzer's periodic setup retransmission is disabled in this comparison: setup packets go out at startup and once when the reader attaches, the same host-started model as Percepio. Retransmission exists for hosts that attach to an already-running target without a reset, which this RAM-loaded flow never does. ViewAlyzer's housekeeping runs in the application's existing priority-3 heartbeat task. The stock Percepio FreeRTOS port adds its own trace-control task (priority 1, 10-ms period). Memory, object and ancillary hook coverage/encoding are not identical between products; event counts are not units of equivalent information. Percepio uses the stock C RTT writer, no extra internal stream buffer and a 32-byte down-command buffer. Its stream buffers lie in AXISRAM1 under a non-cacheable MPU overlay; ViewAlyzer's ring and the RTT control block lie in AXISRAM2. Recorder code was not optimized for this comparison.
Both recording modes are drained continuously through the same local ST-LINK, same probe-rs 0.30.0 reader, requested/accepted 24-MHz SWD and requested 1-ms polling. Each read collects available contiguous bytes and acknowledges consumption. A poll can take longer than 1 ms; the report includes actual collection totals. Non-halting debug reads still generate bus traffic. Raw files are decoded/checked after measurement, so neither mode performs live GUI decoding. The off build has no reader attached during measurement.
Trace health
Capture windows include startup, warmup and stopping; application measurement lasts only the specified send interval. Percepio checks use its public PSF header, entry table, event lengths, sequence numbers and timestamps. This is structural validation, not full Tracealyzer semantic analysis. Its firmware drop counter is unsupported; sequence gaps, not the zero placeholder in firmware status, measure missing events. The 16-bit sequence check assumes fewer than 65,536 consecutive missing events; the collector is continuously active and observed gaps are far below that, but a whole unobserved sequence wrap cannot be ruled out by sequence numbers alone. ViewAlyzer uses the existing offline decoder; discarded startup bytes before synchronization are reported separately.
| Run | Events | Missing events | Firmware drops | Bytes read | Mean kB/s | Peak ring backlog (B) | Corrupt/trailing bytes | Timestamp reversals | Pre-sync discard (B) |
|---|---|---|---|---|---|---|---|---|---|
| 01-VIEWALYZER-750pps | 1,663,125 | 0 | 0 | 11,799,286 | 184.7 | 952 | 0 | Decoder | 699 |
| 02-PERCEPIO-750pps | 1,580,027 | 210 | N/A | 25,837,516 | 404.3 | 4908 | 0 | 0 | 0 |
| 03-VIEWALYZER-750pps | 1,663,261 | 0 | 0 | 11,800,037 | 184.8 | 1261 | 0 | Decoder | 486 |
| 04-PERCEPIO-750pps | 1,579,993 | 0 | N/A | 25,836,908 | 404.6 | 2440 | 0 | 0 | 0 |
| 06-PERCEPIO-750pps | 1,580,245 | 0 | N/A | 25,841,396 | 404.7 | 2440 | 0 | 0 | 0 |
| 08-VIEWALYZER-750pps | 1,663,223 | 0 | 0 | 11,799,630 | 184.8 | 834 | 0 | Decoder | 273 |
All completed recording runs must also remain active, return zero internal error flags and finish the reader successfully; those conditions are checked independently of event loss. Counts and full reader statistics are retained in measurements.json.
Load selection
The offered load is the highest rate at which both recorders' streams fit this collection path. Percepio's stream is about twice the byte rate of ViewAlyzer's, and at 2,000 blocks/s it exceeds what the local ST-LINK reader sustains:
| Percepio load check | Blocks/s | Measured seconds | Captured events | Missing events | Missing fraction | Steady kB/s read |
|---|---|---|---|---|---|---|
| 1 | 2000 | 10 | 410,678 | 375,092 | 47.74% | 557.4 |
| 2 | 2000 | 10 | 410,696 | 375,348 | 47.75% | 556.6 |
Those checks lose roughly 48% of Percepio events despite active recording and continuous reading. That is a limit of this transport and collection setup, not proof that Percepio cannot handle the application rate; a larger ring would absorb bursts but not a sustained byte-rate deficit. All three builds are therefore compared at 750 blocks/s, where the Trace health table above shows the retention each recorder actually achieved.
Every application run
| Run | CPU % | Worker us | Pipeline us | Host p99 us | Timer max us | Host sent | Replies | Missing |
|---|---|---|---|---|---|---|---|---|
| 00-OFF-750pps | 8.292 | 21.250 | 56.547 | 556.801 | 2 | 45000 | 45000 | 0 |
| 01-VIEWALYZER-750pps | 10.417 | 22.892 | 62.621 | 489.902 | 4 | 45000 | 45000 | 0 |
| 02-PERCEPIO-750pps | 10.802 | 23.255 | 62.854 | 572.801 | 3 | 45000 | 45000 | 0 |
| 03-VIEWALYZER-750pps | 10.416 | 22.890 | 62.634 | 498.800 | 4 | 45000 | 45000 | 0 |
| 04-PERCEPIO-750pps | 10.800 | 23.255 | 62.857 | 573.304 | 4 | 45000 | 45000 | 0 |
| 05-OFF-750pps | 8.297 | 21.247 | 56.508 | 479.703 | 2 | 45000 | 45000 | 0 |
| 06-PERCEPIO-750pps | 10.807 | 23.244 | 62.849 | 422.003 | 4 | 45000 | 45000 | 0 |
| 07-OFF-750pps | 8.289 | 21.242 | 56.508 | 513.903 | 2 | 45000 | 45000 | 0 |
| 08-VIEWALYZER-750pps | 10.402 | 22.851 | 62.613 | 518.503 | 4 | 45000 | 45000 | 0 |
| Run | Host skipped send slots | Not counted by application | Firmware send errors | Accepted replies missing at PC | Queue drops |
|---|---|---|---|---|---|
| 00-OFF-750pps | 0 | 0 | 0 | 0 | 0 |
| 01-VIEWALYZER-750pps | 0 | 0 | 0 | 0 | 0 |
| 02-PERCEPIO-750pps | 0 | 0 | 0 | 0 | 0 |
| 03-VIEWALYZER-750pps | 0 | 0 | 0 | 0 | 0 |
| 04-PERCEPIO-750pps | 0 | 0 | 0 | 0 | 0 |
| 05-OFF-750pps | 0 | 0 | 0 | 0 | 0 |
| 06-PERCEPIO-750pps | 0 | 0 | 0 | 0 | 0 |
| 07-OFF-750pps | 0 | 0 | 0 | 0 | 0 |
| 08-VIEWALYZER-750pps | 0 | 0 | 0 | 0 | 0 |
Code and RAM cost
This is a RAM-loaded application: executable code and constants also occupy RAM. Delta is the selected recorder minus Recorder off. Fixed RTOS heap and stack reservations are allocations, not measured peak usage.
| Bytes | Recorder off | ViewAlyzer | Delta | Percepio | Delta |
|---|---|---|---|---|---|
| Loaded code/data | 144328 | 156384 | +12056 | 153824 | +9496 |
| Code and read-only allocation | 142516 | 154556 | +12040 | 152012 | +9496 |
| Writable/reserved allocation | 233236 | 242196 | +8960 | 243252 | +10016 |
| Total allocated RAM | 375752 | 396752 | +21000 | 395264 | +19512 |
| Trace-ring capacity | 0 | 5120 | +5120 | 5120 | +5120 |
The Percepio total includes stock RTT terminal-channel storage and recorder tables; its control task consumes part of the already reserved RTOS heap. Comparing the 5,120-byte up-ring alone omits other recorder storage. Flash-resident builds would move code/read-only storage out of RAM, but this report does not predict their timing or memory layout.
Reproduce and interpret
All runs use the same STM32N6570-DK at 600 MHz, GCC -O2, no LTO, the same FreeRTOS/lwIP application source and two seconds of traffic warmup. The nine runs interleave the three builds (Recorder off / ViewAlyzer / Percepio, then ViewAlyzer / Percepio / Recorder off, then Percepio / Recorder off / ViewAlyzer), each starting from a fresh RAM load. Three repetitions expose some variation; they are not a broad statistical characterization.
The host is a general-purpose Windows PC, not an isolated latency-test host, so host round trip describes this setup and cannot attribute small differences to recorder code. Application timing is measured on the board, but request arrival patterns still depend on the host.
Percepio is the public TraceRecorder source with v4.11.0 headers. Compiler: arm-none-eabi-gcc.exe (GNU Tools for STM32 13.3.rel1.20240926-1715) 13.3.1 20240614. Host: Windows-11-10.0.26200-SP0, Python 3.12.10. Exact image, source and reader hashes and the effective configuration macros are in the machine-readable data.
The practical conclusion should follow the application's own CPU budget, response deadlines and trace requirements. This experiment measures overhead and retention under one documented configuration. It does not establish universal recorder rankings, maximum throughput or timing guarantees. Host p99 differences alone cannot identify a recorder-code cause.
Put it to work
See the behavior behind the numbers.
Explore ViewAlyzer’s timelines, communication analysis, and repeatable capture workflows.
EXPLORE VIEWALYZER →